Tag

Trend

Browsing


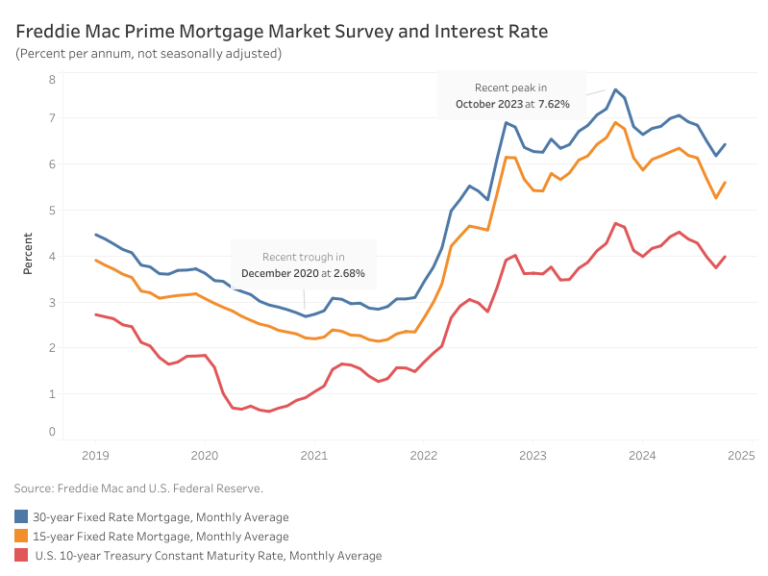
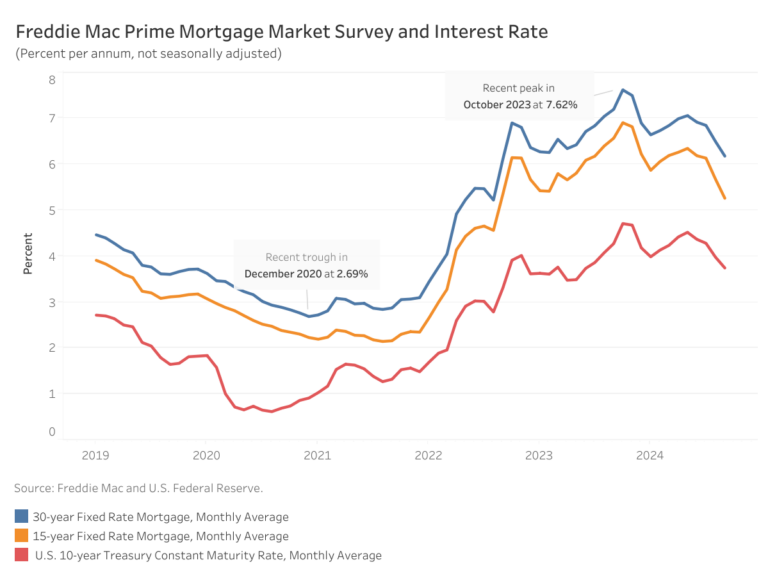
In October, mortgage rates reversed their recent downward trajectory, returning to levels two months earlier. According to Freddie Mac, the average rate for a 30-year fixed-rate mortgage increased 25 basis points (bps) from September to 6.18%. The 15-year fixed-rate mortgage saw an even steeper increase of 34 bps to land at 5.60%.

These increases coincided with heightened volatility in the 10-year Treasury yield, which jumped 38 bps over the month, moving from 3.72% in September to 4.10%. This spike followed a weaker-than-expected labor report driven by the disruptions from two hurricanes, as well as the Boeing strike, and the 2024 election.

However, the largest part of the increase for interest rates is due to growing, post-election concerns over budget deficits. NAHB will be revising its interest rate outlook as the final election results are determined and the fiscal policy position comes into focus. Nonetheless, long-term interest rates have increased since September due to election developments.

Discover more from Eye On Housing

Subscribe to get the latest posts sent to your email.


This article was originally published by a eyeonhousing.org . Read the Original article here. .


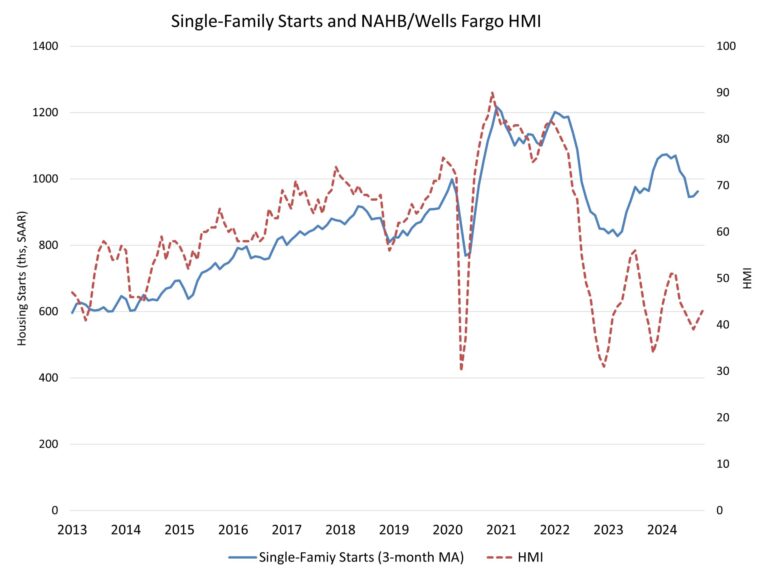
With the Federal Reserve beginning an easing of monetary policy and builder sentiment improving, single-family starts posted a modest gain in September while multifamily construction continued to weaken because of tight financing and an ongoing rise in completed apartments.

Overall housing starts decreased 0.5% in September to a seasonally adjusted annual rate of 1.35 million units, according to a report from the U.S. Department of Housing and Urban Development and the U.S. Census Bureau.

The September reading of 1.35 million starts is the number of housing units builders would begin if development kept this pace for the next 12 months. Within this overall number, single-family starts increased 2.7% to a 1.03 million seasonally adjusted annual rate. On a year-to-date basis, single-family construction is up 10.1%. The September gain for single-family home building mirrored an increase for the NAHB/Wells Fargo HMI.

While single-family home building increased in September, higher mortgage interest rates in October are likely to place a damper on growth in next month’s data. Nonetheless, NAHB is forecasting a gradual, if uneven, decline for mortgage rates in the coming quarters, with corresponding increases for single-family construction.

The multifamily sector, which includes apartment buildings and condos, decreased 9.4% to an annualized 327,000 pace. This marks the weakest pace since May. Multifamily construction will remain weak as completions of apartments are elevated.

On a regional and year-to-date basis, combined single-family and multifamily starts are 9.0% higher in the Northeast, 2.0% lower in the Midwest, 4.6% lower in the South and 5.4% lower in the West.

Overall permits decreased 2.9% to a 1.43 million unit annualized rate in September. Single-family permits increased 0.3% to a 970,000 unit rate. Multifamily permits decreased 8.9% to an annualized 458,000 pace. This is the weakest reading since May.

Looking at regional data on a year-to-date basis, permits are 0.8% higher in the Northeast, 2.6% higher in the Midwest, 2.2% lower in the South and 5.1% lower in the West.

The number of single-family homes under active construction totaled 642,000 in September. After stabilizing recently, this is down just 4.5% from a year ago. The number of multifamily units under construction declined 3.4% in September to an 842,000 total. This is 16.5% lower than a year ago and is the smallest count since February 2022.

As a sign of the reversal for multifamily construction, the seasonally adjusted annual rate of multifamily construction was 680,000 in September. This was roughly twice the pace of multifamily starts, meaning for every two apartments finishing construction, only one new unit began construction. The pace of multifamily completions was up 41% compared to a year ago.

Discover more from Eye On Housing

Subscribe to get the latest posts sent to your email.


This article was originally published by a eyeonhousing.org . Read the Original article here. .


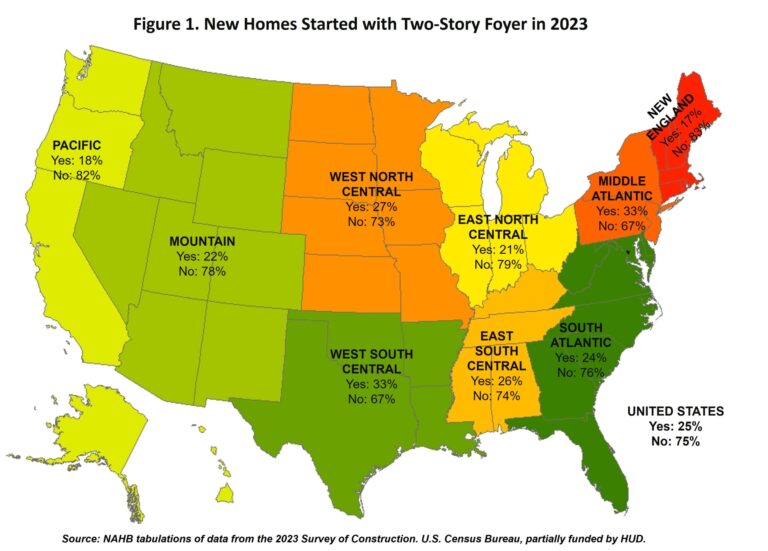
In 2023, a quarter of new homes were built with a two-story foyer, down slightly from 26% in 2022, according to data obtained from the Census Bureau’s Survey of Construction (SOC) and tabulated by NAHB. The market share of two-story foyers has been generally trending downward over the past seven years, with most new single-family homes being built without a two-story foyer nationally and regionally.

According to the Census, a two-story foyer is defined as the entranceway inside the front door of a house and has a ceiling that is at the level of the second-floor ceiling. In the United States, the share of new homes with two-story foyers fell from 26% to 25% in 2023, closer to the low level seen in 2021. This feature is often considered energy-inefficient and is seen as undesirable by both builders and buyers. The declining trend is in line with NAHB’s What Home Buyer’s Really Want, in which recent and prospective buyers rated their preference for 18 specialty rooms. The study found that two-story entry foyers was one of the least desired specialty rooms, with 32% buyers likely to reject a potential home with this feature, and only 13% seeing it as an essential/must-have feature.

Regionally, the share declined in five of the nine divisions. The decline was particularly pronounced in West South Central and New England, reversing the notable increases seen in 2022. In both divisions, the shares have now returned closer to their 2021 levels. The Middle Atlantic and West North Central were the only two divisions to see an increase in the share of two-story foyers from 2022 to 2023, with both shares reaching their highest levels since 2017. Meanwhile, shares in the South Atlantic and Pacific remained unchanged in 2023.

Discover more from Eye On Housing

Subscribe to get the latest posts sent to your email.


This article was originally published by a eyeonhousing.org . Read the Original article here. .


In September, mortgage rates maintained their downward trajectory, returning to levels last seen two years ago. According to Freddie Mac, the average rate for a 30-year fixed-rate mortgage fell to 6.18%, a decline of 32 basis points (bps) from August. The 15-year fixed-rate mortgage saw an even steeper decline, decreasing by 42 bps from August to 5.26%. Additionally, the 10-year Treasury rate declined by 23 bps, falling from 3.98% in August to 3.75%.

According to the NAHB forecast, the 30-year mortgage rate is expected to near 6% on a sustained basis by the end of 2024, with a further decline to just below 6% during 2025. NAHB also predicts furthering easing by the Federal Reserve before the end of 2024.

Discover more from Eye On Housing

Subscribe to get the latest posts sent to your email.


This article was originally published by a eyeonhousing.org . Read the Original article here. .


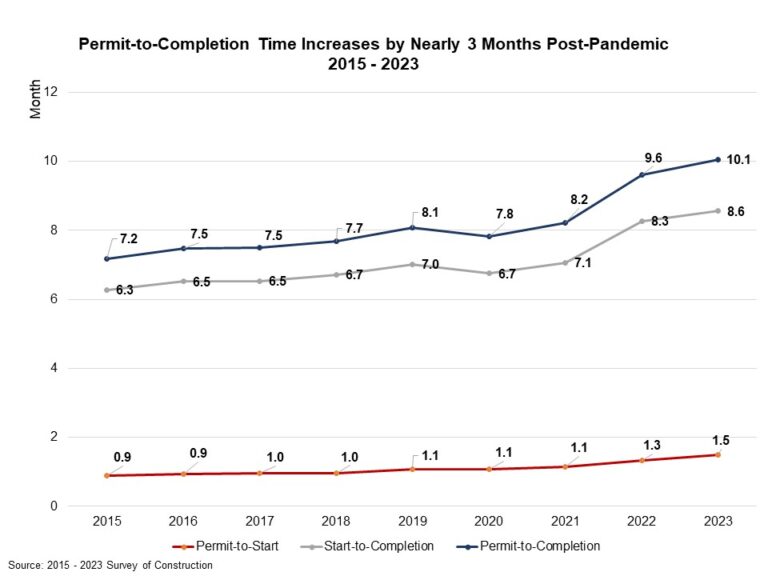
The average completion time of a single-family house in 2023 was approximately 10.1 months, breaking down to 1.5 months for authorization to start construction and another 8.6 months to finish construction. According to the Census Bureau’s Survey of Construction, the permit-to-completion time has been on an upward trend since 2015. Currently, it is almost 3 months longer than the average completion time in 2015. This extended duration is largely attributable to a more stringent regulatory environment, ongoing supply-chain challenges and a shortage of skilled labor.

Among all single-family houses completed in 2023, homes built for sale required the shortest amount of time, 8.9 months from obtaining building permits to completion. Meanwhile, homes built by owners (custom builds) required the longest time, 15.2 months. Homes built by hired contractors tookabout12.1 months, and homes built-for-rent took about 12.2 months from authorization to completion.

The time from permit to start for all types of homes was longer in 2023. The period of time necessary to start construction required, on average, 1.5 months in 2023. In contrast, prior to 2017 construction typically started within the same month after obtaining building authorization. Between authorization and the start of construction, built for sale and built by contractors on owner’s land required 1.5 months and 1.4 months respectively. The permit-to-start time was even longer for homes built-for-rent and custom builds (1.6 months).

The chart below illustrates that permit-to-completion time differs across home sizes. The smallest single-family homes, under 1,200 sq. ft., required 13 months to finish, relatively longer than larger homes under 5,000 sq. ft. This prolonged period is primarily because half of these smaller homes are constructed specifically for rental purposes, which typically takes longer building time from authorization. In contrast, homes ranging from 1,200 to 3,999 sq. ft. are built at the average building time, typically around 10 months. As the size increases beyond 4,000 sq. ft., there is a noticeable upward trend in completion times. Homes with 4,000-4,999 sq. ft. take about 12 months, while those between 5,000- 5,999 sq. ft. extend to a little more than 14 months. Homes over 6,000 sq. ft. take the longest to build, requiring almost 18 months from permit to finish.

The average time from authorization to completion also varies across divisions. The division with the longest duration was New England (13.9 months), followed by the Middle Atlantic (13.2 months), the Mountain division (11.4 months), and the Pacific division (11.2 months) in 2023. These four divisions exceeded the nation’s average of10.1 months. The shortest period, 8.9 months, is registered in the South Atlantic division. The average waiting period from permit to construction start varies from the shortest time of 0.9 months in the East North Central to the longest of 2 months in New England.

The SOC also collects additional information for houses built for sale, including a sale date when buyers sign sale contracts or make a deposit. Looking at single-family homes built for sale and completed in 2023, 17.2% were sold before construction started, 41.8% sold while under construction, 15.6% sold during the month of completion, and 19.7% sold after completion. The share of completed houses remaining unsold was 5.8% at point of survey.

Discover more from Eye On Housing

Subscribe to get the latest posts sent to your email.


This article was originally published by a eyeonhousing.org . Read the Original article here. .

Pin It