Tag

Time

Browsing


Nationally, nearly 140 million people in the United States routinely commuted to work, according to NAHB analysis of the 2023 American Community Survey data. Among these people, approximately 23.8 million people spent more than 90 minutes each day going to and from their place of employment, and nearly 12.5 million commuters traveled at least 120 minutes daily.

According to the Nobel Prize winner Daniel Kahneman’s research (2004), “commuting to work” was one of the least enjoyable activities and was most frequently associated with negative feelings during the day. While much research has revealed that longer commute times are associated with lower happiness and well-being, research by political scientists Benjamin Newman, Joshua Johnson, and Patrick Lown found that commuting significantly decreases political participation. People with long commute times are less involved in politics.

As the presidential election approaches, it is worth noting the variation in commute times across congressional districts. By analyzing the data from the American Community Survey (ACS) 1-year estimates, we summarize trends in the mean travel time among U.S. workers between 2010 and 2023 and also provide a deeper understanding of geographic patterns and the variation in commute times across congressional districts. In this article, “mean travel time to work” is calculated by dividing the total one-way commute time by the number of workers who commute. It indicates the average time workers spend traveling from home to work daily.

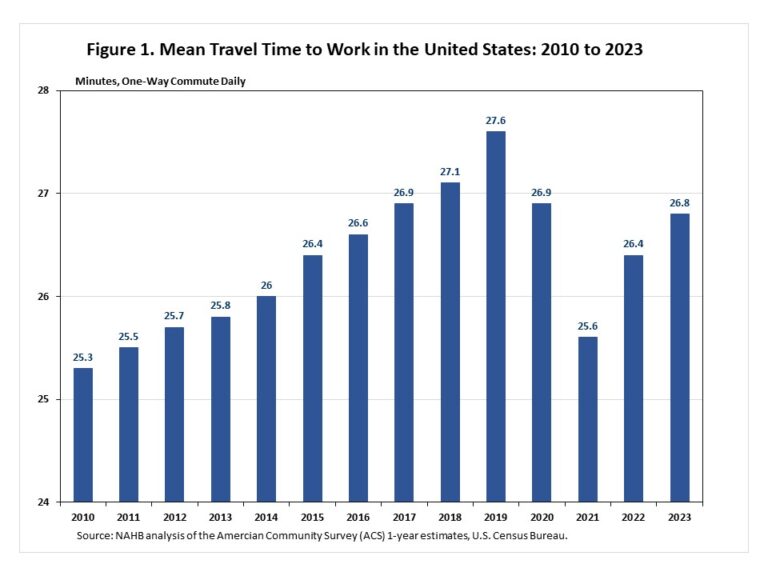
From 2010 to 2019, the mean travel time to work in the United States increased every year. In 2021, the COVID-19 pandemic led to a significant increase in remote work, meanwhile, the mean travel time to work decreased dramatically. Since then, the mean travel time to work increased by 1.2 minutes to 26.8 minutes in 2023 but remained below its historic high of 27.6 minutes in 2019.

Commute times vary across congressional districts and show geographical patterns. The map above illustrates the variation in the mean travel time to work in 2023 by five categories from light teal to dark blue (data is not available for Texas’s 27th congressional district). The lightest teal represents these congressional districts where people spend 17.2 – 19.9 minutes traveling to work daily, while the dark blue marks these congressional districts where people spend 35 minutes or more traveling to work daily, on average.

Noticeably, most people in the Mountain and West North Central Divisions have smaller travel times than those in the coastal states. In the least mean travel time category (between 17.2 and 19.9 minutes), there are 12 congressional districts in total. These include two congressional districts in both Nebraska and Iowa, one in Kansas, Texas, Montana, and Oregon, and four at-large congressional districts in South Dakota, North Dakota, Wyoming, and Alaska. Nebraska’s 3rd congressional district, one of the largest non-at-large districts in the United States, had the least mean travel time to work among all 436 congressional districts. People from Nebraska’s 3rd district spent only 17.2 minutes traveling to work on average and 80% of them drove alone to work. It was followed by Kansas’s 1st congressional district and Texas’s 19th congressional district.

Within the top mean travel time category, people spend 35 minutes or more traveling to work daily. It includes 12 congressional districts in New York, three in California, two in Maryland, and one in both Virginia and New Jersey.

It is no surprise that New York had the longest commute time in the United States. The mean travel time to work was 32.8 minutes daily, on average. Out of 26 congressional districts in New York, 18 of them had higher mean travel time to work than the national average of 26.8 minutes. The top eight congressional districts with the highest mean travel time to work were all in New York.

A larger share of people who worked outside their county of residence partially explains longer commute times in congressional districts where people spent 35 minutes or more traveling to work daily. For example, New York’s 5th congressional district, with the highest mean travel time to work of 45.5 minutes, reported that 45.3% of people worked outside their county of residence. Meanwhile, congressional districts in the least mean travel time category reported a significantly smaller share of people who worked outside their county of residence. Only 18% of people in Nebraska’s 3rd congressional district worked outside their county of residence. The majority of people in these districts worked in their county of residence.

Housing is a key issue for long commute times as it affects the distance between home and work. The results from NAHB’s HBGI showed that since the beginning of the COVID-19 pandemic housing demand has shifted from higher-density core areas to low-density markets, where homes are larger and more affordable. Additionally, a published study (2022) found that lack of affordable housing increased commute times as people moved to lower-cost housing in the outer reaches of major metro areas. To reduce commute times, the authors suggest creating and preserving dedicated affordable housing units, changing zoning to allow for more housing development, relaxing housing regulations to facilitate higher-density development, increasing government housing subsidies, and adopting tenant protections.

Additional data for your congressional district are provided by the US Census Bureau here.

Discover more from Eye On Housing

Subscribe to get the latest posts sent to your email.


This article was originally published by a eyeonhousing.org . Read the Original article here. .


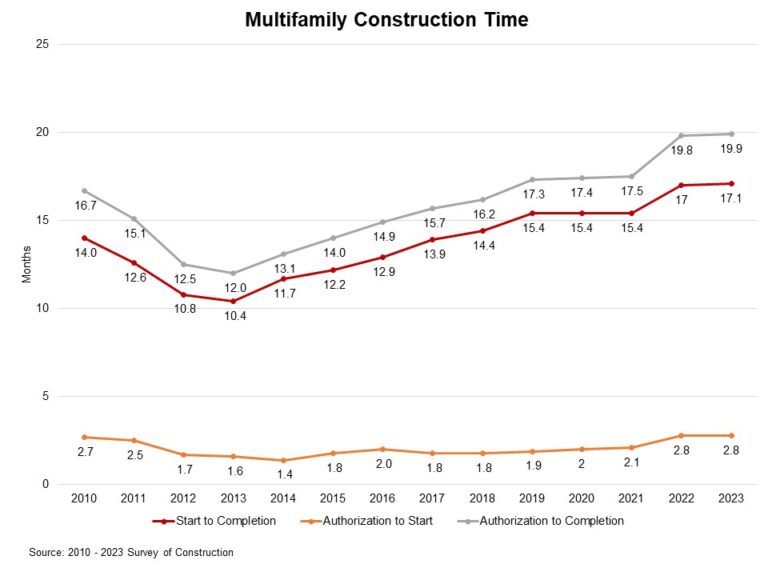
The average length of time to complete construction of a multifamily building after obtaining authorization was 19.9 months in 2023, according to the 2023 Survey of Construction (SOC) from the Census Bureau. The permit-to-completion time inched up 0.1 months in 2023, after an increase of 2.3 months in 2022, as the ongoing skilled labor shortage and supply chain issues were still challenging the industry.

The average time to build multifamily homes varies with the number of units in the building. The more units, the more time required to build. In 2023, buildings with 20 or more units took the longest time,22 months, to build after obtaining authorization. Properties with 10-to-19 units required 21.5 months. However, 2-to-4 unit buildings came in at 18.7 months, which took longer time than 5-to-9 unit buildings (16.9 months).

Compared to 2019, pre-pandemic, only buildings with 5 to 9 units took a similar time to complete. The construction process required 3.3 more months to complete multifamily buildings with 2-to-4 units, 2.8 months more for 10-to-19 unit buildings, and 3 months longer to finish for properties with 20 or more units.

The 2023 SOC data also shows a significant regional variation in the average construction duration of multifamily buildings. The West had the longest time from authorization to completion at 20.9 months, followed by the Northeast at 20.8 months, and then the South with 19.5 months. The shortest permit-to-completion period happened in the Midwest with 17.3 months.

Discover more from Eye On Housing

Subscribe to get the latest posts sent to your email.


This article was originally published by a eyeonhousing.org . Read the Original article here. .


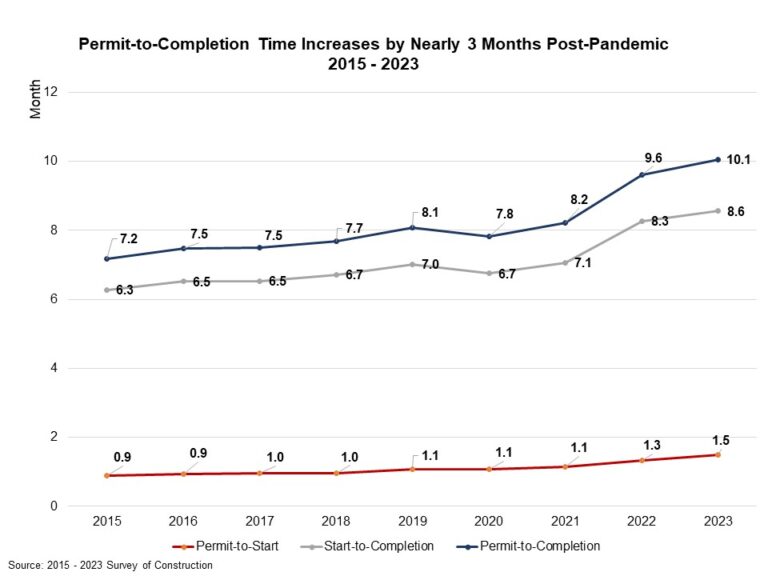
The average completion time of a single-family house in 2023 was approximately 10.1 months, breaking down to 1.5 months for authorization to start construction and another 8.6 months to finish construction. According to the Census Bureau’s Survey of Construction, the permit-to-completion time has been on an upward trend since 2015. Currently, it is almost 3 months longer than the average completion time in 2015. This extended duration is largely attributable to a more stringent regulatory environment, ongoing supply-chain challenges and a shortage of skilled labor.

Among all single-family houses completed in 2023, homes built for sale required the shortest amount of time, 8.9 months from obtaining building permits to completion. Meanwhile, homes built by owners (custom builds) required the longest time, 15.2 months. Homes built by hired contractors tookabout12.1 months, and homes built-for-rent took about 12.2 months from authorization to completion.

The time from permit to start for all types of homes was longer in 2023. The period of time necessary to start construction required, on average, 1.5 months in 2023. In contrast, prior to 2017 construction typically started within the same month after obtaining building authorization. Between authorization and the start of construction, built for sale and built by contractors on owner’s land required 1.5 months and 1.4 months respectively. The permit-to-start time was even longer for homes built-for-rent and custom builds (1.6 months).

The chart below illustrates that permit-to-completion time differs across home sizes. The smallest single-family homes, under 1,200 sq. ft., required 13 months to finish, relatively longer than larger homes under 5,000 sq. ft. This prolonged period is primarily because half of these smaller homes are constructed specifically for rental purposes, which typically takes longer building time from authorization. In contrast, homes ranging from 1,200 to 3,999 sq. ft. are built at the average building time, typically around 10 months. As the size increases beyond 4,000 sq. ft., there is a noticeable upward trend in completion times. Homes with 4,000-4,999 sq. ft. take about 12 months, while those between 5,000- 5,999 sq. ft. extend to a little more than 14 months. Homes over 6,000 sq. ft. take the longest to build, requiring almost 18 months from permit to finish.

The average time from authorization to completion also varies across divisions. The division with the longest duration was New England (13.9 months), followed by the Middle Atlantic (13.2 months), the Mountain division (11.4 months), and the Pacific division (11.2 months) in 2023. These four divisions exceeded the nation’s average of10.1 months. The shortest period, 8.9 months, is registered in the South Atlantic division. The average waiting period from permit to construction start varies from the shortest time of 0.9 months in the East North Central to the longest of 2 months in New England.

The SOC also collects additional information for houses built for sale, including a sale date when buyers sign sale contracts or make a deposit. Looking at single-family homes built for sale and completed in 2023, 17.2% were sold before construction started, 41.8% sold while under construction, 15.6% sold during the month of completion, and 19.7% sold after completion. The share of completed houses remaining unsold was 5.8% at point of survey.

Discover more from Eye On Housing

Subscribe to get the latest posts sent to your email.


This article was originally published by a eyeonhousing.org . Read the Original article here. .


Editor’s Note: This article has been updated to reflect the outcome of a legal settlement involving commissions paid to real estate agents representing home buyers. Starting in August 2024, home buyers in most markets must sign agreements with their agents before touring homes, and buyers will set their agents’ commissions through negotiation. See how this will affect home sellers and home buyers.

If you’re wondering if now is a good time to buy a house, ask this instead: Is it a good time in my life to buy a house?

Housing market trends give important context, so we’ll look at those numbers here. But ultimately, whether this is a good time to buy a house depends on your financial situation, life goals and readiness to become a homeowner.

Let’s explore both aspects of the homebuying journey: the housing market and your own readiness to buy a home.

Looking to Buy or Sell a Home?

NerdWallet has partnered with HomeLight to help you find the best performing real estate agents

How’s the housing market right now?

These are some factors affecting buyers in today’s market.

Mortgage rates: At their lowest since February 2023

The interest rate on a 30-year fixed-rate mortgage averaged 6.28% annual percentage rate (APR) for the week ending Aug. 15, down one basis point from the previous week and down 90 basis points from a year ago, according to rates provided to NerdWallet by Zillow. A basis point is one one-hundredth of 1%.

Average weekly mortgage rates

Averages are for the week ending Aug. 15, 2024, according to rates provided to NerdWallet by Zillow.

Buyers got some welcome relief this month, when the 30-year fixed-rate mortgage dropped to its lowest average rate since February 2023. In general, mortgage rates have remained stubbornly high throughout the first half of 2024. If inflation gets under control later in 2024, as many experts predict, mortgage rates are likely to continue a modest decline.

Did you know…

Higher rates shrink buying power because they make home loans more expensive. For example: Let’s say you make a 20% down payment on a $350,000 house. With a 6.8% mortgage rate, your monthly payment would be $1,825 (not including home insurance and property taxes). With a 5% mortgage rate, the monthly payment would be $1,503 — $322 lower.

You can’t influence average rates, so focus on the things you can control:

Shop around for the best deal. Especially given today’s higher rates, buyers can save $600 to $1,200 per year by applying for loans from multiple mortgage lenders, according to a February 2023 study by Freddie Mac, the government-sponsored entity that buys conforming loans from mortgage lenders.

Lock in your rate. After getting approved for a home loan, consider locking in the mortgage rate until the loan closes to protect against further rate increases.

Mortgage loans from our partners

Best Mortgage LendersFirst-time BuyerRefinanceHELOCHome Equity Loans

Mortgage loans from our partners

Best Mortgage LendersFirst-time BuyerRefinanceHELOCHome Equity Loans

Inflation and the economy: Waiting for the Fed to cut rates

The Federal Reserve, the nation’s central bank, guides the economy with two goals: encouraging job growth and keeping inflation under control. The Fed doesn’t directly set mortgage rates. However, it does set the federal funds rate, which influences interest rates for loans including mortgages.

After a series of 11 increases to the federal funds rate in 2022-2023, the Fed has kept things steady since last September. A rate cut of even a fraction of a percentage point would offer buyers more relief.

With inflation slowly easing, the Fed could consider cutting rates at its next meeting on Sept. 17-18, 2024.

Supply of homes for sale: Still limited (but getting better)

A shortage of homes for sale has made this a tough era for buyers. But inventory is finally improving: In June, the months’ supply of homes for sale reached its highest level in more than four years.

In June, there was a 4.1-month supply of homes on the market nationwide, according to the National Association of Realtors (NAR), meaning it would take a little more than four months at the current pace for all the properties to sell. That’s an improvement over last month (3.7 months) and last year (3.1 months). The market hasn’t seen inventory above a four-month supply since May 2020, when supply was 4.5 months.

Did you know…

In a balanced market, the supply of homes for sale would last six months. Supply less than that is considered a seller’s market. More than a six-month supply is considered a buyer’s market.

“We’re seeing a slow shift from a seller’s market to a buyer’s market,” NAR Chief Economist Lawrence Yun said in a news release. “Homes are sitting on the market a bit longer, and sellers are receiving fewer offers. More buyers are insisting on home inspections and appraisals, and inventory is definitively rising on a national basis.”

Home prices: Higher than ever after a 12-month climb

The national median price for existing homes sold in June was $426,900, up 4.1% from June 2023, according to the NAR. That’s the highest median price ever recorded by NAR, beating last month’s record high and following 12 straight months of year-over-year price increases.

Under the crunch of high prices, sales of existing homes — properties that were owned and occupied before going on the market — dropped 5.4% from May to June, according to the NAR. Sales are also down 5.4% compared to June 2023, when the median existing-home sales price was about $410,000.

All four U.S. regions — Midwest, Northeast, South and West — saw year-over-year price increases in June. Here’s a regional look at median prices and year-over-year price changes:

Midwest: $327,100, up 5.5%.

Northeast: $521,500, up 9.7%.

South: $373,000, up 1.7%.

No one can predict exactly what the market will do next. But in a news release, Yun paints an optimistic picture that high prices might be topping out now that inventory is improving.

“Even as the median home price reached a new record high, further large accelerations are unlikely,” Yun said. “Supply and demand dynamics are nearing a balanced market condition. The month’s supply of inventory reached its highest level in more than four years.”

Competition: Steady, but less intense than last year

Some good news: Compared to last summer, competition has cooled off. The June 2024 Realtors Confidence Index, a survey of the NAR’s members, highlights these key market indicators year over year:

Houses for sale are getting fewer offers. A home listed for sale received an average 2.9 offers in June, down from 3.5 offers per home last year.

Fewer homes are selling above list price. In June, 29% of homes sold above listing price, down from 33% a year ago. 

Homes are staying on the market longer. Houses stayed on the market for a median 22 days in June — four days longer than June 2023, when the median was 18 days. Last month, 65% of homes sold in less than a month. A year ago, that figure was 76%.

Overall, though, demand still outpaces supply. This is hardly a mellow market: Good homes sell quickly, and buyers should still expect competition out there. If you’re ready to buy, get a mortgage preapproval so you’re prepared to make a strong offer. Once mortgage rates drop, competition will only go up. There’s no time like the present to start shopping.

Homebuying readiness: Should I buy a house now or wait?

Ask yourself these questions to explore whether you’re ready to buy a home.

Are you prepared to put down roots?

Think about your life goals, relationships and interests. How long can you see yourself living in this location?

Ideally, you’d want to remain in the home long enough for rising property values and your equity to exceed the costs of buying and selling, including real estate commissions and mortgage closing costs. That will typically take several years.

You could also be subject to capital gains taxes if the home appreciates in value and you sell it after less than two years.

How’s your job security?

A mortgage is a big commitment and can become a stressful burden after a job loss, so it’s not a good time to buy a home if you think you’ll get laid off.

Wait until your employment is stable before thinking about buying a house.

Are you financially prepared?

Here are the three main ingredients to evaluate.

Savings

You’ll need money for a down payment and mortgage closing costs as well as for moving and other expenses after you buy the home. The down payment requirements vary by the type of mortgage and the lender. The more you put down, the lower your monthly mortgage payment.

The typical down payment for first-time buyers is 8% and for repeat buyers is 19%, according to an NAR survey of home buyers who purchased a primary residence from July 2022 through June 2023.

Credit

Lenders generally offer the best mortgage rates and terms to borrowers with credit scores of 740 and above, although you can qualify for a mortgage with a score in the 600s. The options are much slimmer, and loan costs can be higher for borrowers with a score in the 500s.

If your credit is marginal, it might make sense to postpone buying a house and use the time to work on building your credit.

The average FICO credit score for closed mortgage loans to purchase homes in the past 30 days was 735, according to mortgage data provider ICE Mortgage Technology.

Debt

Lenders look at your debt-to-income ratio (DTI) to help determine whether you qualify for a mortgage. Your DTI is the percentage of your monthly gross income that goes toward monthly debt payments, including housing costs, as well as car, student loan, credit card and other debt obligations. Lenders like to see a DTI under 36%, although it’s possible to qualify with a higher ratio. The lower your DTI, the better your chances of qualifying for a mortgage and getting offered the lowest available rate.

The average DTI for purchase mortgages in the past 30 days was 40%, according to ICE Mortgage Technology.

Mortgage loans from our partners

Best Mortgage LendersFirst-time BuyerRefinanceHELOCHome Equity Loans

Mortgage loans from our partners

Best Mortgage LendersFirst-time BuyerRefinanceHELOCHome Equity Loans


This article was originally published by a www.nerdwallet.com . Read the Original article here. .


Key takeaways

The current housing market is causing many prospective buyers to wait for better conditions, but there’s no guarantee that it will improve considerably anytime soon.

If your credit score is strong, your employment is stable and you have enough savings to cover a down payment and closing costs, buying now might still be smart.

If your personal finances are not ideal at the moment, or if home values in your area are on the decline, it might be better to wait.

Buy now, or wait? That’s the question prospective homeowners have been struggling to answer in today’s housing market. Home prices have been skyrocketing recently, and the Federal Reserve’s work to tame inflation sent mortgage rates soaring, too.

The combination has led many would-be buyers to pick the “wait” side of the equation. The median sale price of an existing home in the U.S. hit its second all-time-high of the year in June 2024 — an astonishing $426,900 — according to the National Association of Realtors (NAR). And, according to the Fannie Mae Home Purchase Sentiment Index released in July 2024, 81 percent of consumers believe it’s a bad time to buy a house.

However, after being at a constant disadvantage for the past few years, things have actually started to look a bit better for buyers in some respects. For example, days-on-market figures are up, giving buyers more time to make an informed decision. NAR data shows that homes typically spent 22 days on the market before selling in June, up from 18 days a year ago. And available housing inventory, while still on the low side, is rising — up a healthy 23.4 percent year-over-year, per NAR.

June’s National Housing Report from RE/MAX, one of the biggest real estate brokerages in the country, also reported a sharp uptick in new listings, up 38.1 percent from June 2023. “It’s good to see inventory levels rising, as more listings represent more options for buyers,” said RE/MAX president Amy Lessinger in the report. However, she continued, “it’s evident that buyers are sensitive to interest rates, highlighting the need for lower rates to stimulate significant growth in market activity.”

So, is it a good time to buy a home? Or is it better to wait on the sidelines, in the hopes that either prices or rates see a significant drop soon? And are there still concerns about a possible recession? Here are some key considerations to help determine the way forward.

Is now a good time to buy a house?

Mortgage rates have backed off from the 8 percent highs hit in October, but they’re still close to 7 percent. And home prices are sky-high as well: June data showed the highest median price NAR has ever recorded, reflecting 12 consecutive months of year-over-year increases. Together, these factors might dissuade you from buying right now, and that’s understandable.

No matter which way the real estate market is leaning, though, buying now means you can start building equity immediately. It also means avoiding the potential for additional mortgage rate increases later: Rising rates can spell serious trouble for your monthly budget, and they also result in paying more in interest over the life of the loan.

“If a buyer finds a property they would like to call home, they should not delay,” says Stacey Froelich, a broker with Compass in New York City. “You cannot time the market, and a home should be a long-term investment.”

“Remember, you ‘marry the house and date the rate,’” Melissa Cohn, regional vice president of William Raveis Mortgage in Connecticut, recently told her newsletter subscribers.  To put it another way, if you find the right place, buy now — you can always refinance later.

In general, if you can answer yes to these three questions, now is a good time to buy.

Do you have excellent credit? Anytime you’re borrowing money, start by checking your credit score. The best deals on mortgages will be available to those with the best scores — in fact, the median credit score for mortgage borrowers in the first quarter of 2024 was a very high 770, according to the Federal Reserve Bank of New York. If you have demonstrated that you are a low-risk borrower with a history of on-time payments, you’ll be in line for the lowest mortgage rates a lender offers.

Have you saved enough for a down payment? In addition to paying your bills on time, you should be sitting on a sizable chunk of change for a down payment. The more you can pay upfront, the less you’ll have to borrow (and so the less interest you’ll have to pay). Make sure you’ll have plenty left over, too: Lenders like to see additional cash reserves that can provide a cushion if something unexpected happens.

Are you planning to stay in the home for a while? Beyond the purchase price, buying a home comes with closing costs that can run thousands more. So, to justify those one-time transaction costs, it’s wise to be reasonably certain that you won’t move again anytime soon — or that you’ll be financially stable enough to hold on to the property and rent it out. Selling a home very soon after buying can have serious tax implications.

Should I buy a house now or wait?

Ultimately, the decision of when to buy a home is up to you. Life goes on, whether the timing is perfect or not. If you’re anxious to become a homeowner, you’ve met the criteria above and you’re financially stable, go ahead and start house-hunting.

If you’re holding out for lower mortgage rates, a bit of patience might be in order. They have been volatile lately, topping 8 percent in October 2023 before falling back below 7 percent, then rising back above it, and lately just a hair under 7 percent again. That’s more than a full percentage point swing in just a few months.

While 1 percent might not sound like much, it can make a big difference in how much house you can afford over the long run. For example, Bankrate’s mortgage calculator shows that if you buy a $350,000 home with a 20 percent down payment, the monthly payment for principal and interest on a 30-year loan with a 7 percent interest rate is $1,862. The same loan at 8 percent brings those monthly payments up to $2,054 — $192 higher every month. That’s more than $2,300 each year, or $69,000 over the life of the loan.

Of course, it’s impossible to predict where rates will land eventually. But here are three instances in which it might make more sense to wait out the market for at least a while:

If home values in your area are dropping: The country’s overall median home price may have hit a record high in June, but some individual areas have still seen price declines. Take Austin, Texas, for example: Redfin data shows that the median price in Austin in June 2022 was $616,444. A year later, that figure was down to $600,000 even, and by June 2024, it had fallen to $564,000. Such declines may not be done yet, so it could pay to be patient for a bit longer.

If inventory in your area is increasing: When there are more properties on the market to choose from, buyers enjoy more bargaining power. Since many buyers have been sitting on the sidelines due to the interest rate environment, many areas have seen a jump in inventory. Even so, according to NAR, the country overall had 4.1 months worth of housing supply in June — an improvement over recent months, but still too low to meet demand.

If your personal finances could use some love: The biggest reason to wait is if your current financial situation is not ideal. For example, if you are expecting a sizable commission check or bonus, an inheritance or some other windfall that would make a big difference in your down payment, waiting until it arrives makes sense. And if your credit score is low, waiting is also smart. Take some time to improve your credit and pay down your debt so you can qualify for better loan terms.

Analyze your local market carefully

Deciding whether to buy a house now or wait depends a lot on where you want to call home. Regardless of national headlines, real estate is a local game and can vary greatly from one market to another, even within the same state.

Consider this June Redfin data from North Carolina’s Research Triangle cities of Raleigh and Chapel Hill, only about 30 miles away from each other: Raleigh homes cost a median of $450,000 and spend about 16 days on the market before selling. But in nearby Chapel Hill, the median home costs a much higher $667,500 and sells in less than half the time (just 6 days). That’s a notable difference.

In today’s homebuying market, it’s more important than ever to find a real estate agent who really knows your local area — down to your specific neighborhood — and can help you successfully navigate its unique quirks.

What if there’s a recession?

The odds of a recession within the next 12 months now stand at 32 percent, according to Bankrate’s most recent survey. And as you might imagine, recessions are a risky time to buy a home. If you lose your job, for example, a lender will be much less likely to approve your loan application.

Even if a recession doesn’t affect you directly, if your area is hard-hit, that could have a serious effect on the local real estate market. Fewer people with the means to buy means a lower chance of homes selling, which could keep homeowners from listing and decrease your options as a buyer.

There are some potential upsides to buying a home during a recession, though, if you’re financially able to do so. Notably, there will be less competition, which could help you find a great property that you otherwise couldn’t.

Next steps

Trying to buy a house right now might feel overwhelming, but waiting too long can present challenges as well. Review your finances in detail, and think about how much you’re able to pay upfront as a down payment. Be sure to take the pulse of the town in which you’re hoping to live. Then, talk with an experienced local real estate agent to figure out whether you should buy now or wait until the market is a bit more friendly to your bank account.

FAQs

Is now a good time to buy a house?

We’re in a volatile time for real estate. Prices are at record highs, mortgage rates reached 20-year highs last year, and some economic experts still believe we are heading for a recession. A high-interest-rate climate gives you less buying power, so buyers who opt to wait for lower rates may find themselves able to afford a higher-priced house, due to the lower mortgage payments. But there’s no guarantee that rates will actually go down. Ultimately, whether it’s a good time to buy depends on your personal circumstances. If you need to move now, then go for it: Shop around for the best deal possible, and remember, you can always refinance down the line if rates do decrease.

Can I buy and sell a house at the same time?

Yes — lots of people buy a new house while selling their old one at the same time. However, it does create some additional challenges, especially if you’re showing your home while still living in it. It’s important to work with an expert real estate agent who can help you find the right buyer and the right listings to look at. You’ll also want to stay close with your loan officer, to make sure the complexities of putting the proceeds from your sale toward your new down payment are as smooth as possible.

Is the housing market going to crash?

Housing experts do not think so. While there is certainly some economic uncertainty swirling right now, most experts believe that the housing market will not crash. Home prices may decline in some areas, but it won’t be catastrophic — think of it as more of a soft landing.
This article was originally published by a www.bankrate.com . Read the Original article here. .


Selling a house is a big decision that requires careful consideration, especially in today’s uncertain economic climate. Given the dramatic rise in mortgage rates over the past year, this is a question on the minds of many sellers who are considering selling their homes.

The latest survey reveals that the percentage of respondents who believe it is a good time to sell a house has increased while those considering it a bad time to sell have decreased. Let’s take a closer look at the factors that can influence whether it’s a good time to sell your house.

Is It a Good Time to Sell a House in 2024?

So, let’s unpack the current trends to see if selling your house right now is a smart move for you.

Sellers Hold the Cards (For Now)

There’s a clear trend emerging: sellers are currently in a sweet spot. The Fannie Mae Home Purchase Sentiment Index® indicates a significant 67% of consumers believe it’s a good time to sell a house. That’s a substantial increase since the end of 2023, even though mortgage rates have been steadily climbing.

This suggests two key things. First, there are plenty of potential buyers out there, fueled by factors like job security and continued income growth (though at a slower pace). Second, with a limited number of houses available on the market, sellers have the upper hand in negotiations.

So, if you’ve been considering selling, this could be a golden opportunity to get top dollar for your property. Here’s the thing: while bidding wars may not be as common as they once were, a well-maintained house in a desirable location is likely to attract multiple offers, giving you the leverage to negotiate a favorable sale price.

A Market with Nuances

However, the market isn’t without its complexities. While home prices are expected to continue rising, the pace of that increase is likely to slow down compared to the rapid acceleration seen in recent years. Additionally, mortgage rates have been on the rise, making affordability a challenge for some buyers. This means that while there are still plenty of buyers out there, they may be more cautious about overspending. As a seller, this translates to the need to price your house competitively to attract serious offers. Don’t expect bidding wars to be the norm anymore.

Making a Strategic Decision

So, should you sell your house now? The answer depends on your individual circumstances. Here are some factors to consider that go beyond national trends:

Your Timeline: Are you flexible on your move-out date? If you can afford to wait, you might benefit from a period of mortgage rate stabilization. But if you have a pressing need to sell, the current market conditions could still be favorable.
Local Market Dynamics: National trends provide a helpful backdrop, but your local market can be quite different. Research what’s happening in your area to get a better understanding of buyer demand and listing prices. Talk to a local real estate agent to get a feel for the specific inventory levels and competition you’ll face.
Your Financial Picture: Are you carrying a high mortgage balance? If so, selling now could help you free up some cash and potentially reduce your monthly housing costs. However, factor in any selling costs and potential moving expenses to ensure the sale makes financial sense for you.

Beyond the Data: Considering the Human Factor

Remember, the decision to sell your house is also a personal one. Consider your emotional attachment to the property and how ready you are for a change. If you’re unsure, don’t feel pressured to jump on the bandwagon.

The Takeaway

The housing market is constantly evolving, but right now, the data suggests that sellers have the upper hand. If you’ve been thinking about selling your house, there’s no reason to wait. However, carefully consider your individual needs and the state of your local market before making a final decision. Consulting with a qualified real estate agent who is familiar with your area can be a valuable step to ensure you get the most out of your sale. They can help you with pricing strategies, navigating negotiations, and ensuring a smooth transaction.

Source: Fannie Mae
Should I Sell My House Now or Wait?

So, the question remains, should you sell your house in 2024 or wait until 2025? The answer is not straightforward, as it depends on a number of factors specific to your personal situation. Some of the key considerations are discussed below. Selling a house is a major decision that requires careful consideration of various factors, including market conditions, personal circumstances, and financial goals.

Assess Current Market Conditions

The first step in deciding whether to sell your house now or wait is to evaluate the current state of the real estate market in your area. Consider the following:

Local Housing Market: Research recent sales data for homes similar to yours in your neighborhood. Are properties selling quickly or languishing on the market? A seller’s market, characterized by high demand and low inventory, might be favorable for selling now.
Home Prices: Monitor trends in home prices in your area. If prices have been steadily increasing, it could be an advantageous time to sell.
Interest Rates: Keep an eye on mortgage interest rates. Lower rates might attract more buyers to the market, potentially leading to a quicker sale.

Evaluate Your Financial Goals

Your personal financial goals and needs play a significant role in the decision-making process:

Profit Margin: Consider how much equity you have in your current home. If you’ve built substantial equity and can sell at a profit, it might be a good time to capitalize on your investment.
Downsizing or Upsizing: Are you planning to downsize or upsize? Your plans for your next home can influence the timing of your sale. If you’re downsizing, the current market conditions might align well with your goals.

Life Circumstances

Your personal circumstances should also be factored in:

Job Relocation: If you’re moving for a new job or career opportunity, the timing of your move might be determined by external factors.
Family Changes: Life events like marriage, divorce, or growing families can impact your housing needs. Consider how your changing family circumstances play into your decision.

Market Trends and Projections

While it’s impossible to predict the future with certainty, researching market trends and projections can provide insights into potential market shifts. Consult with real estate professionals who can offer expert opinions on where the market might be headed.

Real estate professionals, including real estate agents and financial advisors, can offer invaluable guidance. An experienced real estate agent can provide a Comparative Market Analysis (CMA) to help you understand your home’s value in the current market. Financial advisors can help you evaluate the financial implications of selling now versus waiting.

Examining the current housing market trends and data provided by Realtor.com, it’s essential to evaluate whether it’s an opportune moment to sell a house or if waiting might be a strategic move. Let’s delve into the key findings to make an informed decision:

Current Market Trends

The past week’s housing trends offer insights into the dynamics at play. Mortgage rates, which had been steadily increasing for five weeks, finally stabilized but remained above 7%. This stability, however, did little to boost seller confidence, as high mortgage rates have dampened enthusiasm among sellers in recent years.

Buyers, on the other hand, are facing a competitive market characterized by higher down payments compared to previous years. This trend is likely driven by increased competition over limited inventory and buyers with more disposable income, either from recent home sales or higher earnings.

Furthermore, the Consumer Price Index (CPI) inflation data showed improvement, indicating progress in the economic landscape. This positive development can potentially influence mortgage rates in the near future, offering hope for both buyers and sellers.

Key Findings

The median listing price: It remained steady year-over-year for the second consecutive week. Despite this stability, the median listing price per square foot was 3.8% higher than the previous year, suggesting a shift in the types of homes available on the market.
New listings: There was a 6.6% increase compared to one year ago. While seller activity has been on the rise, the rate of growth slowed down, indicating a potential slowdown in new listings.
Active inventory: Homes listed for sale were 35.0% higher than the previous year, giving buyers more options. This abundance of inventory varies geographically, with the South experiencing the highest growth.
Days on the market: Homes spent one day more on the market compared to the previous year. Despite this slight increase, homes continue to sell relatively quickly, driven by competition among buyers.

Given the current market conditions, the decision to sell your house hinges on various factors, including your financial situation, housing needs, and long-term goals. While high mortgage rates may deter some sellers, improving economic indicators offer hope for a more favorable market environment in the future.

If you’re considering selling, it’s essential to weigh the pros and cons carefully. Selling now could mean facing less competition from other sellers, but waiting might allow you to capitalize on potentially lower mortgage rates and increased buyer demand.

Ultimately, the right timing depends on your individual circumstances and risk tolerance. Consulting with a real estate professional can provide valuable insights tailored to your specific situation, helping you make a well-informed decision.

RELATED POSTS:

Is Now a Good Time to Buy a House? Should You Wait in 2024?

Should I Buy a House Now or Wait Until 2025?


This article was originally published by a www.noradarealestate.com . Read the Original article here. .


Total outstanding US consumer debt stood at $5.08 trillion for the first quarter of 2024, increasing at an annualized rate of 2.46% (seasonally adjusted), according to the Federal Reserve’s G.19 Consumer Credit Report. From the second quarter of 2023 to the second quarter of 2024, the total increased by 1.84%. This year-over-year (YoY) growth rate is the lowest observed since the first quarter of 2021.

Nonrevolving and Revolving Debt

Of the total outstanding US debt in the first quarter of 2024, the nonrevolving share is 74%, with revolving at 26%. Nonrevolving debt (primarily student and auto loans) stands at $3.73 trillion (SA) for the second quarter of 2024. Revolving debt (mainly credit card debt) stands at $1.34 trillion.

The pace of growth has slowed for both nonrevolving and revolving debt as households’ pandemic-era savings have dwindled. In terms of YoY growth, both nonrevolving and revolving debt peaked in the fourth quarter of 2022 at 15.10% and 5.34% respectively. In the second quarter of 2024, the YoY growth rate for nonrevolving debt decreased to 6.12%, from 7.99% in the first quarter, while the growth rate for revolving debt increased from 0.14% to 0.39%. This was the sixth consecutive quarterly decline in YoY growth for nonrevolving debt while revolving debt saw its first uptick in the YoY rate in five quarters.

Student and Auto Loans

Breaking down the components of nonrevolving debt, student loans account for 47%, and auto loans make up 42% (the G.19 report excludes real estate loans). Collectively, the other loans make up the remaining 11% of nonrevolving debt.

Student loans in the second quarter of 2024 totaled $1.74 trillion (non-seasonally adjusted), marking the fourth consecutive decrease in the YoY rate at -0.96%, following an annual decrease of -1.22% in the previous quarter. The third quarter of 2023 marked the first YoY decrease for student loan debt since the data was first reported.

Auto loan debt for the second quarter of 2024 was $1.57 trillion (NSA). Auto loan YoY growth has steadily decelerated over the past six quarters. The fourth quarter of 2021 saw a high of 13.74% YoY growth compared to the second quarter of 2024 YoY growth rate of 1.95%. This slowdown partially reflects the relatively high interest rate on auto loans, which have increased from 4.52% in Q1 2022 to 8.20% in Q2 2024 (60-month new car loans). However, this car loan rate experienced its first (albeit slight) decline in over two years, falling from 8.22% in the previous quarter.

Credit Cards

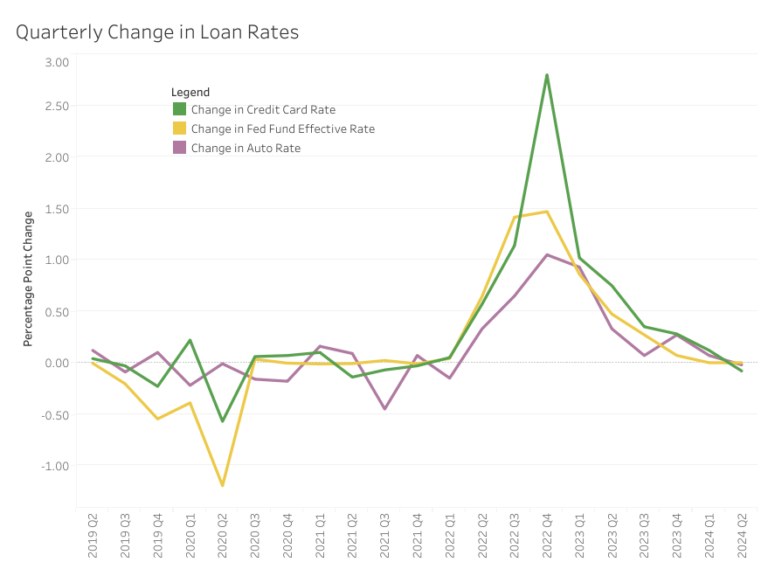
The interest rate on credit cards saw its first decrease since the fourth quarter of 2021.  The interest rate for the second quarter of 2024 was 21.51%, falling from 21.59% in the previous quarter. Before this quarter, the rate experienced nine consecutive quarterly increases, with a dramatic increase of 2.8 percentage points from Q3 2022 to Q4 2022. This aligns closely with the Federal Funds Effective Rate increasing 1.47 percentage points during the same period, the highest increase since the 1980s.

Discover more from Eye On Housing

Subscribe to get the latest posts sent to your email.


This article was originally published by a eyeonhousing.org . Read the Original article here. .


If you’re a homeowner waiting on the sidelines for the perfect time to sell your home, this week could be your time to shine.

Despite mortgage rates inching closer to 7%, a recent research from Realtor.com indicated the week of April 14-20 might be the ideal week for potential sellers to list, as spring historically brings with it higher buyer demand and a market with low inventory, setting the stage for bigger bids.

Some homeowners have been on the sidelines for two years, waiting for mortgage rates to fall, additional survey data from the site showed.

However, while 50% say they’re willing to hold out longer in hopes of rate drops, nearly 30% say they need to sell soon for “personal reasons,” including profits, need for more space, or plans to rent, to name a few.

SELLING YOUR HOUSE? HERE’S THE BEST TIME TO DO IT

The best time to sell your home might be the week of April 14-20, according to Realtor.com data. (REUTERS/Jeff Haynes  / Reuters Photos)

Survey data also showed that sellers are adjusting their expectations to meet the current market, with 8 in 10 settling in on the expectation that the mortgage for a newer home will be higher than their current home. 

“With the market cooling in many areas, 12% expect a bidding war to take place (vs 27% in 2023), and only 15% expect to get more than their asking price (vs 31% last year),” the report continued.

The separate analysis from last month pointed to the April 14-20 listing timeframe by taking into account the number of buyers, listing prices and seasonal trends, to determine the period for the most favorable for home selling conditions.

TIME TO SELL YOUR HOME? HERE ARE 3 QUESTIONS TO ASK YOURSELF

50% of sellers still on the sidelines say they will wait out rates while 29% say they need to sell soon. (FOX Business / Getty Images)

“We’ve got the most favorable balance of all of these factors for sellers. It suggests they will be able to sell quickly at a good price and be happy with the outcome,” said Realtor.com chief economist Danielle Hale.

The report indicated that this week offers a higher-than-average number of buyers along with a lower-than-average time on the market and higher-than-average prices, coming in at 1.1% higher than the average for other weeks throughout the year.

REALTOR DESCRIBES THE SHIFT THAT’S DRIVING REAL ESTATE ‘ACROSS THE BOARD’ IN TOP MARKETS

Realtor.com analysis indicates that homes historically reached higher prices during the week of April 14. (Photo by STEFANI REYNOLDS/AFP via Getty Images / Getty Images)

FOX Business’ Gerri Willis, speaking on “Varney & Co.,” on Monday said “sellers are getting more realistic,” noting that they have to “embrace” current rates.

Rates for 30-year mortgages averaged 6.88% last week, according to Freddie Mac’s latest survey. 

GET FOX BUSINESS ON THE GO BY CLICKING HERE


This article was originally published by a www.foxbusiness.com . Read the Original article here. .


Key takeaways

Broadly speaking, spring is generally the best time of year to sell your home.

Many families need to be in their new home by the start of the school year, and house-hunting is easier when days are warmer and longer.

Fall and winter typically see the lowest amount of homebuying activity.

During the height of the pandemic, normal seasonal patterns all but disappeared from the housing market. There was so much demand for homes that any time was a good time to sell. But now that the market has settled back into a more normal cadence, timing is once again becoming an important consideration for home sellers.

Some patterns and trends usually do hold true throughout the year, and one is that late spring and early summer are the best times to sell. Sellers can net thousands of dollars more if they sell during the peak months of May, June and April compared to the three slowest months of the year, October, November and December, according to a 2023 report by ATTOM Data Solutions.

Best month to sell a house

Spring — specifically, the month of May — is the best time to sell a house. Homes sold in May net a 12.8 percent seller premium (the amount above the home’s market value), based on ATTOM’s analysis of single-family home and condo sales over the past 10 years.

Best and worst times to sell a house, by month

To determine the premium or discount sellers realized on a given day, ATTOM compared the median sale price for homes with a purchase closing on that day with the median automated valuation model (AVM) for those same properties at the time of sale. Here’s how each month of the year ranked for the best time to sell a house.

May
$220,000
$195,000
12.8%

June
$228,000
$206,000
10.7%

April
$215,000
$195,000
10.3%

March
$210,000
$191,357
9.7%

July
$227,500
$207,537
9.6%

February
$200,000
$184,000
8.7%

August
$225,000
$208,000
8.2%

September
$223,504
$207,000
8.0%

January
$200,000
$186,000
7.5%

October
$220,000
$206,000
6.8%

December
$220,000
$206,000
6.8%

November
$220,000
$207,000
6.3%

The highest-earning months are, in ranking order, May, June, April and March. Just over 18 million purchase transactions took place during this period, according to ATTOM.

June edges out April for second place, with a 10.7 percent seller premium compared to May’s 12.8 percent. March and April usher in prime homebuying season with premiums of 9.7 percent and 10.3 percent, respectively. By October, seller premiums have tapered off, falling to 6.8 percent.

These stats underscore the conventional wisdom about selling a home: Spring and summer attract the most buyer attention. Conversely, that can be a challenging time to buy, owing to high prices and more demand.

Seasonality is important

While all regions experience seasonality, it is more or less pronounced depending on where you are in the country.

For example, in the South and West — where temperatures are largely more moderate — there’s less discrepancy between the peak and slow seasons, according to the National Association of Realtors. However, there’s more disparity between summer and winter in the Midwest and Northeast.

These seasonal patterns can help give sellers an indication of what to expect throughout the year.

Spring and summer are the best seasons to sell

Typically, sellers list their homes in the spring and summer because the weather is good, especially for people in colder climates. In addition, families want to buy their next home before school starts, says Realtor Liede DeValdivielso, one half of the DeValdivielso Team with the Keyes Company in Coral Gables, Florida.

Daylight savings time might also play a part in why the warmer months stimulate buying activity. “One of the reasons buyers are more eager to view properties during spring and summer may be due to the longer days,” says Marilyn Blume, a real estate agent with Sotheby’s International Realty in New York City. “By getting more exposure for your listing through more traffic, you increase the chances to receive more offers.”

Homebuyers on a deadline — for example, those who want to acquire a house before the school year begins — should make sure they’re in top financial shape before spring. That means checking your credit score and debt-to-income ratio to ensure you’re in a strong position to get a mortgage preapproval. Otherwise, your efforts might be delayed.

“April is plenty of time to get a house before school starts, as long as your financing is in order,” DeValdivielso says. “The best thing to do is shop around for a loan before you start looking for a house. This will give you a good idea of what you can qualify for.”

Fall and winter are the worst seasons to sell

The decline in seller premiums typically begins in September, when the average premium drops to 8 percent — significantly less than the peak in May. By then, many buyers with school-aged kids have likely found a home, so the sharp drop is no surprise.

Combine the new school year with the start of the busy holiday season, and homebuying goes on the back burner during the latter part of the year. Just like in the warmer months, the weather plays a factor in the winter months, too. As the days get dark earlier and temperatures drop, people tend to stay closer to home. This means less foot traffic for sellers.

November is the worst month to sell

The worst month of the year to sell a house is November, with a 6.3 percent seller premium, according to ATTOM. And those premiums stay pretty low in ensuing months. Homebuying activity typically comes to a near-standstill in December, when people tend to travel and are busy with holiday celebrations.

Of course, if you’re a buyer, the opposite holds true: The cooler months can actually be a hot time to house-hunt. There’s less competition from other buyers, and antsy sellers might be more willing to negotiate on price or offer other concessions.

The best day of the week to list your home

Want to get even more specific? If you really want to maximize your profits and sell quickly, list your home on a Thursday. Data from Zillow suggests that Thursday is the sweet spot for new listings to appear on the market, as both house-hunters and real estate agents tend to plan their weekend showings toward the end of the week. Friday is a good bet as well, per Redfin data. Avoid listing at the beginning of the week, as that raises the likelihood that the listing will sit for a few days before most buyers are ready to look — newly added listings look fresher to buyers.

What if there’s a recession?

As happened during the pandemic, the possibility of a recession might see established housing-market trends fly out the window. Recessions can be a dicey time to sell — or buy — a home. When the economy contracts, unemployment rises and potential buyers may experience a decline in income, making it more difficult for them to be approved for a mortgage.

In addition, selling a home requires paying real estate commissions and closing costs that will likely total tens of thousands of dollars. So it’s only worth doing if you really need to. If you’re worried about a recession and can afford to hold off until the economy stabilizes a bit, that could be the smarter financial option.

More tips for sellers

Here are a few more suggestions for homeowners hoping to maximize their selling success:

Real estate is very localized, so speak with an experienced real estate agent in your market who understands local sales trends. Agents can give you neighborhood-specific information to help you make the most strategic decision about when to list your home.
Keep prep time in mind. Sellers should consider making key repairs and updates to their homes to maximize their return, but this can be a lengthy process. Even simple decluttering can be time-consuming, so plan accordingly and finish these projects before putting your home on the market.
Make sure you get expert, professional-quality listing photos taken. All homebuyers search for homes online these days — a full 100 percent, according to National Association of Realtors data — so it’s important to put your home’s best foot forward right from the beginning.


This article was originally published by a www.bankrate.com . Read the Original article here. .

Pin It