Tag

Taxes

Browsing


With the end of 2024 approaching, NAHB’s Eye on Housing is reviewing the posts that attracted the most readers over the last year. In October, Jesse Wade shared the average real estate tax by state and also an effective rate controlling for home value.

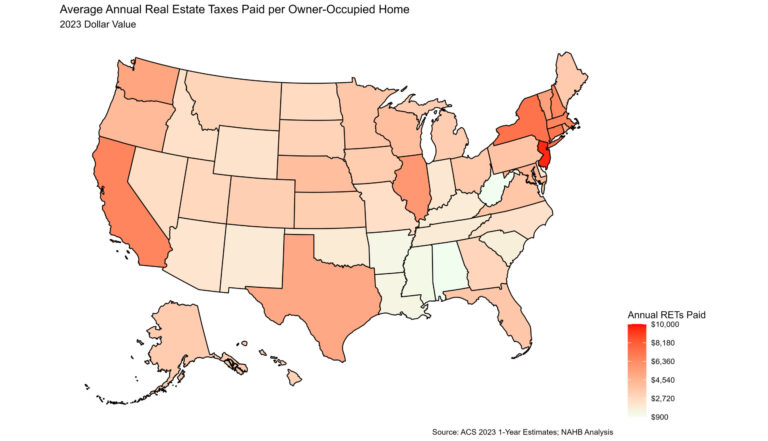
Nationally, across the 86 million owner-occupied homes in the U.S., the average annual real estate taxes paid in 2023 was $4,112, according to NAHB analysis of the 2023 American Community Survey. Homeowners in New Jersey continued to pay the highest real estate taxes, paying an average of $9,572, 30.6% higher than the second highest, New York, at $7,329 . On the other end of the distribution, homeowners in Alabama paid the lowest average amount of real estate taxes at $978. The map below shows the geographic variation of average annual real estate taxes (RETs) paid.

Compared to 2022, every state saw increases in the average amount of real estate taxes paid. The largest percentage increase was in Hawaii, up 21.1% from $2,541 to $3,078.  The smallest increase was in New Hampshire, up 1.1% from $6,385 to $6,453.

Average Effective Property Tax Rates

While average annual real estate taxes paid is important, it provides an incomplete picture. Property values vary across states, which explains some, if not most, of the variation across the nation in average annual real estate taxes. To control for property values and create a more informative state-by-state analysis, NAHB calculates the average effective property tax rate by dividing aggregate real estate taxes paid by aggregate value of owner-occupied housing within each state. For example, the aggregate real estate taxes paid across the U.S. was $352.3 billion with an aggregate value of owner-occupied real estate totaling $38.8 trillion in 2023. Using these two amounts, the average effective property tax rate nationally was $9.09 ($352.3 billion/$38.8 trillion) per $1,000 in home value. This effective rate can be expressed as a percentage of home value or as a dollar amount taxed per $1,000 of a home’s value. The map below displays the effective rate by state below.  

Illinois, a change from New Jersey in 2022 , had the highest effective property tax rate at $18.25 per $1,000 of home value. Consistent with 2022, Hawaii had the lowest effective property tax rate at $3.18 per $1,000 of home value. Additionally, Hawaii had the largest increase over the year, up 18.8% from $2.68 in 2022. Twenty states saw their effective property tax rates fall between 2022 and 2023, with the largest decrease occurring in West Virginia where it fell 6.0%, from $5.06 to $4.75 per $1,000.

Intrastate Variation: Examples from New York

While property taxes clearly vary by state, there also exists variation within states themselves. The latest county level data available comes from 2022 5-year ACS estimates. Analyzing these data , New York showed the highest degree of variation of average property taxes paid and effective real estate tax rates across the counties of any state. Home owners in Westchester County on average paid $14,156 in real estate taxes in 2022, the highest of any county in New York. The lowest amount was in Hamilton County, where home owners paid on average $2,827 in real estate taxes.

For effective property tax rates, New York continues to tell the story of intrastate variation. As shown above, Westchester County paid the higher average annual real estate taxes in 2022, but looking at effective property tax rate, which accounts for home value, Westchester’s effective property tax rate is near the middle at $18.34.  Home owners in Monroe County seem to get the short end of the stick, paying at a rate of $26.27 per $1,000 of home value, the highest in New York. The lowest effective property tax rate was in Kings County, paying a mere $5.30 per $1,000 of home value in taxes.

Discover more from Eye On Housing

Subscribe to get the latest posts sent to your email.


This article was originally published by a eyeonhousing.org . Read the Original article here. .


State & local tax revenue from property taxes paid reached $203.9 billion in the third quarter of 2024 (seasonally adjusted), according to the Census Bureau’s quarterly summary of state & local tax revenue. This marks a 2.8% increase from the revised $198.3 billion in the second quarter of 2024 and also marks the first quarter where property tax revenue topped $200 billion for state & local governments. Year-to-date, total state & local tax revenue was $1.56 trillion. This was 5.4% higher than the $1.48 trillion through the first three quarters of 2023.

The 2.8% quarterly increase in the property tax revenue was up from the previous quarter of 2.6%. Property tax revenues have grown at an average rate of 0.87% from 2009 to 2024.  This quarter marks the fourth consecutive quarter of above average growth.

Year-over-year, property tax revenue was 11.2% higher, a notable uptick from the 8.0% increase in the previous quarter. The average year-over-year growth rate from 2010 to 2024 is 3.60%. The last time yearly growth was below the average was the 1.1% decline in the third quarter of 2022.

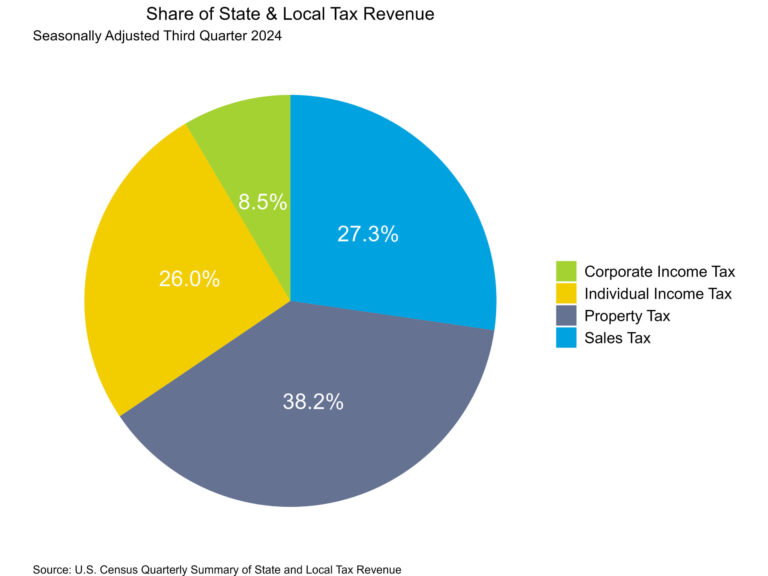
Of total state & local collections in the third quarter, property tax made up the largest share at 38.2%, followed by sales tax at 27.3%. Individual income tax represented 26.0% of tax revenue, while corporate tax made up the remaining 8.5% for state & local revenues in the third quarter of 2024.

Over the past decade, state & local governments have been most reliant on property taxes for revenue. Sales tax has had an increased importance since 2023, when the share of sales tax of total revenues grew above individual income tax shares. See the chart below for the trends of total state & local government tax revenue shares.

Discover more from Eye On Housing

Subscribe to get the latest posts sent to your email.


This article was originally published by a eyeonhousing.org . Read the Original article here. .

Nationally, across the 86 million owner-occupied homes in the U.S., the average annual real estate taxes paid in 2023 was $4,112, according to NAHB analysis of the 2023 American Community Survey. Homeowners in New Jersey continued to pay the highest real estate taxes, paying an average of $9,572, 30.6% higher than the second highest, New York, at $7,329 . On the other end of the distribution, homeowners in Alabama paid the lowest average amount of real estate taxes at $978. The map below shows the geographic variation of average annual real estate taxes (RETs) paid.

Compared to 2022, every state saw increases in the average amount of real estate taxes paid. The largest percentage increase was in Hawaii, up 21.1% from $2,541 to $3,078.  The smallest increase was in New Hampshire, up 1.1% from $6,385 to $6,453.

Average Effective Property Tax Rates

While average annual real estate taxes paid is important, it provides an incomplete picture. Property values vary across states, which explains some, if not most, of the variation across the nation in average annual real estate taxes. To control for property values and create a more informative state-by-state analysis, NAHB calculates the average effective property tax rate by dividing aggregate real estate taxes paid by aggregate value of owner-occupied housing within each state. For example, the aggregate real estate taxes paid across the U.S. was $352.3 billion with an aggregate value of owner-occupied real estate totaling $38.8 trillion in 2023. Using these two amounts, the average effective property tax rate nationally was $9.09 ($352.3 billion/$38.8 trillion) per $1,000 in home value. This effective rate can be expressed as a percentage of home value or as a dollar amount taxed per $1,000 of a home’s value. The map below displays the effective rate by state below.  

Illinois, a change from New Jersey in 2022 , had the highest effective property tax rate at $18.25 per $1,000 of home value. Consistent with 2022, Hawaii had the lowest effective property tax rate at $3.18 per $1,000 of home value. Additionally, Hawaii had the largest increase over the year, up 18.8% from $2.68 in 2022. Twenty states saw their effective property tax rates fall between 2022 and 2023, with the largest decrease occurring in West Virginia where it fell 6.0%, from $5.06 to $4.75 per $1,000.

Intrastate Variation: Examples from New York

While property taxes clearly vary by state, there also exists variation within states themselves. The latest county level data available comes from 2022 5-year ACS estimates. Analyzing these data , New York showed the highest degree of variation of average property taxes paid and effective real estate tax rates across the counties of any state. Home owners in Westchester County on average paid $14,156 in real estate taxes in 2022, the highest of any county in New York. The lowest amount was in Hamilton County, where home owners paid on average $2,827 in real estate taxes.

For effective property tax rates, New York continues to tell the story of intrastate variation. As shown above, Westchester County paid the higher average annual real estate taxes in 2022, but looking at effective property tax rate, which accounts for home value, Westchester’s effective property tax rate is near the middle at $18.34.  Home owners in Monroe County seem to get the short end of the stick, paying at a rate of $26.27 per $1,000 of home value, the highest in New York. The lowest effective property tax rate was in Kings County, paying a mere $5.30 per $1,000 of home value in taxes.

Discover more from Eye On Housing

Subscribe to get the latest posts sent to your email.


This article was originally published by a eyeonhousing.org . Read the Original article here. .
Pin It