Tag

Strong

Browsing


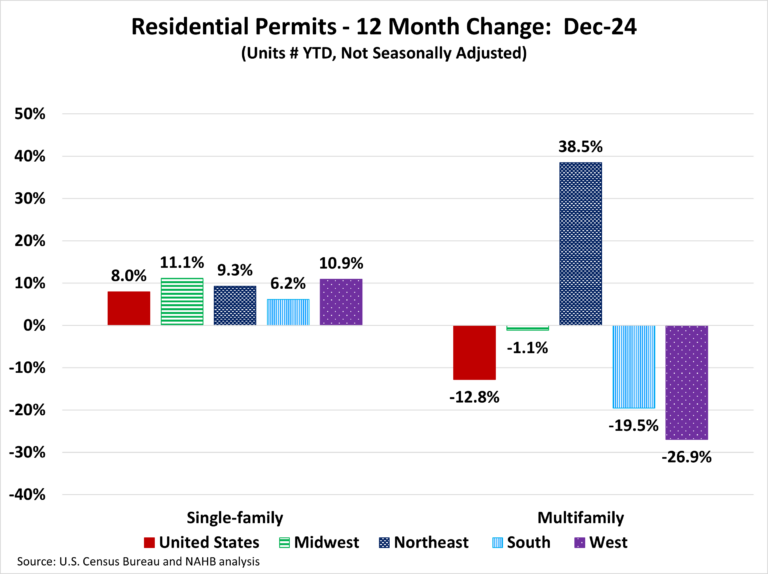
Over 2024, the total number of single-family permits issued year-to-date (YTD) nationwide reached 981,834. On a year-over-year (YoY) basis, this is an increase of 8.0% over the 2023 level of 909,227.

Year-to-date ending in December, single-family permits were up in all four regions. The range of permit increases spanned 11.1% in the Midwest to 6.2% in the South. The West was up by 10.9% and the Northeast was up by 9.3% in single-family permits during this time. For multifamily permits, three out of the four regions posted declines. The Northeast, driven by New York City’s MSA, was the only region to post an increase and was up by 38.5%. Meanwhile, the West posted a decline of 26.9%, the South declined by 19.5%, and the Midwest declined by 1.1%.

Between December 2024 YTD and December 2023 YTD, 45 states posted an increase in single-family permits. The range of increases spanned 33.8% in Montana to 0.1% in South Dakota. The remining five states and the District of Columbia reported declines in single-family permits. The ten states issuing the highest number of single-family permits combined accounted for 63.1% of the total single-family permits issued. Texas, the state with the highest number of single-family permits, issued 158,544 permits over 2024, which is an increase of 9.3% compared to the same period last year. The second highest state, Florida, was down by 0.9%, while the third highest, North Carolina, posted an increase of 6.7%.

For 2024, the total number of multifamily permits issued nationwide reached 489,533. This is 12.8% below the 2023 level of 561,369.

Between December 2024 YTD and December 2023 YTD, 22 states recorded growth in multifamily permits, while 28 states and the District of Columbia recorded a decline. New York (+128.7%) led the way with a sharp rise in multifamily permits from 15,293 to 34,982, while Idaho had the biggest decline of 53.0% from 5,891 to 2,771. The ten states issuing the highest number of multifamily permits combined accounted for 62.4% of the multifamily permits issued. Over 2024, Texas, the state with the highest number of multifamily permits issued, experienced a decline of 18.6%. Florida, the second-highest state in multifamily permits, saw a decline of 27.5%. California, the third largest multifamily issuing state, decreased by 26.2%.

At the local level, below are the top ten metro areas that issued the highest number of single-family permits.

For multifamily permits, below are the top ten local areas that issued the highest number of permits.

Discover more from Eye On Housing

Subscribe to get the latest posts sent to your email.


This article was originally published by a eyeonhousing.org . Read the Original article here. .

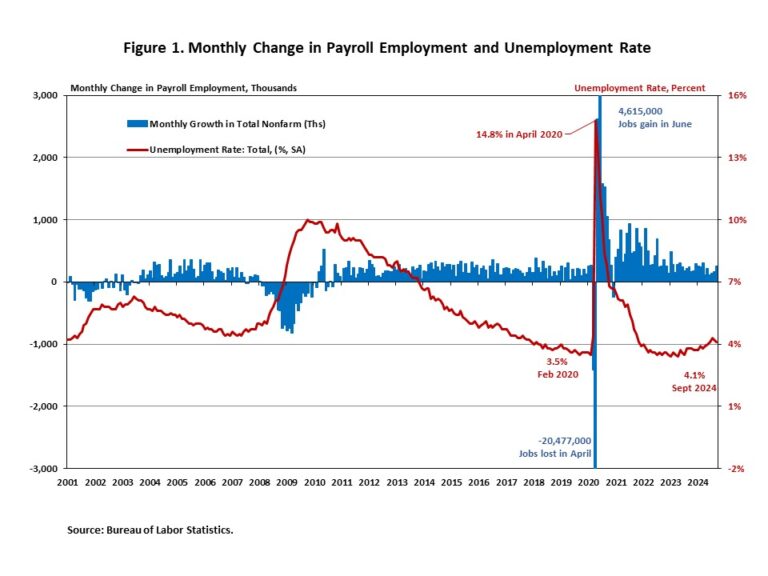
The September jobs report indicates that the U.S. labor market remains strong. Job growth accelerated, and the unemployment rate fell to a three-month low of 4.1%.  Meanwhile, job growth for the previous two months (July and August) was upwardly revised.

In September, wage growth accelerated for the second straight month. Wages grew at a 4.0% year-over-year (YOY) growth rate in September, down 0.5 percentage points from a year ago. Wage growth is outpacing inflation, which typically occurs as productivity increases.

National Employment

Total nonfarm payroll employment increased by 254,000 in September, following an upwardly revised increase of 159,000 jobs in August, as reported in the Employment Situation Summary. It marks the largest monthly job gain in the past six months. The estimates for the previous two months were revised higher. The monthly change in total nonfarm payroll employment for July was revised up by 55,000, from +89,000 to +144,000, while the change for August was revised up by 17,000 from +142,000 to +159,000. Combined, the revisions were 72,000 higher than previously reported.

In the first nine months of 2024, 1,801,000 jobs were created. Additionally, monthly employment growth averaged 200,000 per month, compared with the 251,000 monthly average gain for 2023. The Fed’s easing cycle began on September 18, marking the end of a period of restrictive monetary policy. The U.S. economy has created roughly 8 million jobs since March 2022, when the Fed enacted the first interest rate hike of this cycle.

The unemployment rate fell slightly to 4.1% in September, from 4.2% in August. The September decrease in the unemployment rate reflected the decrease in the number of persons unemployed (-281,000) and the increase in the number of persons employed (+430,000).

Meanwhile, the labor force participation rate—the proportion of the population either looking for a job or already holding a job—was 62.7% for the third consecutive month. However, for people aged between 25 and 54, the participation rate dipped slightly to 83.8%. This rate exceeds the pre-pandemic level of 83.1%. Meanwhile, the overall labor force participation rate is still below its pre-pandemic levels when it stood at 63.3% at the beginning of 2020.

In September, employment continued to trend up in food services and drinking places (+69,000), health care (+45,000), government (+31,000), social assistance (+27,000), and construction (+25,000).

Construction Employment

Job gains in the overall construction sector continued in September, averaging 20,000 per month over the past 12 months. While residential construction gained 7,800 jobs, non-residential construction employment added 17,900 jobs for the month.

Residential construction employment now stands at 3.4 million in September, broken down as 952,000 builders and 2.4 million residential specialty trade contractors. The 6-month moving average of job gains for residential construction was 3,450 a month. Over the last 12 months, home builders and remodelers added 60,500 jobs on a net basis. Since the low point following the Great Recession, residential construction has gained 1,393,800 positions.

In September, the unemployment rate for construction workers rose to 4.9% on a seasonally adjusted basis. The unemployment rate for construction workers has remained at a relatively lower level, after reaching 15.3% in April 2020 due to the housing demand impact of the COVID-19 pandemic.

Discover more from Eye On Housing

Subscribe to get the latest posts sent to your email.


This article was originally published by a eyeonhousing.org . Read the Original article here. .
Pin It