Tag

Stock

Browsing


With the end of 2024 approaching, NAHB’s Eye on Housing is reviewing the posts that attracted the most readers over the last year. In February, Na Zhao shared the latest data on ages of homeowners as well as when their homes were built. 

The median age of owner-occupied homes is 40 years old, according to the latest data from the 2022 American Community Survey[1]. The U.S. owner-occupied housing stock is aging rapidly especially after the Great Recession, as the residential construction continues to fall behind in the number of new homes built. New home construction faces headwinds such as rising material costs, labor shortage, and elevated interest rates nowadays.

With a lack of sufficient supply of new construction, the aging housing stock signals a growing remodeling market, as old structures need to add new amenities or repair/replace old components. Rising home prices also encourage homeowners to spend more on home improvement. Over the long run, the aging of the housing stock implies that remodeling may grow faster than new construction.

New construction added nearly 1.7 million units to the national stock from 2020  to 2022, accounting for only 2% of owner-occupied housing stock in 2022. Relatively newer owner-occupied homes built between 2010 and 2019 took up around 9%.  Owner-occupied homes constructed between 2000 and 2009 make up 15% of the housing stock. The majority, or around 60%, of the owner-occupied homes were built before 1980, with around 35% built before 1970.

Due to modest supply of housing construction, the share of new construction built within the past 12 years declined greatly, from 17% in 2012 to only 11% in 2022. Meanwhile, the share of housing stock that is at least 53 years old experienced a significant increase over the 10 years ago. The share in 2022 was 35% compared to 29% in 2012.

[1] : Census Bureau did not release the standard 2020 1-year American Community Survey (ACS) due to the data collection disruptions experienced during the COVID-19 pandemic. The data quality issues for some topics remain in the experimental estimates of the 2020 data. To be cautious, the 2020 experimental data is not included in the analysis.

Discover more from Eye On Housing

Subscribe to get the latest posts sent to your email.


This article was originally published by a eyeonhousing.org . Read the Original article here. .


 In 2022, the total count of second homes was 6.5 million representing 4.6% of the total housing stock, according to NAHB estimates. This reflects a decline from 2020, when the number of second homes stood at 7.15 million.

As of 2022, the state with the largest stock of second homes was Florida (1 million), accounting for 15.3% of all second homes. Wyoming had the smallest stock with approximately 16,320 second homes, . Half of the nation’s second homes can be found in these seven states – Florida, California, New York, Texas, Michigan, North Carolina, Arizona, and Pennsylvania.

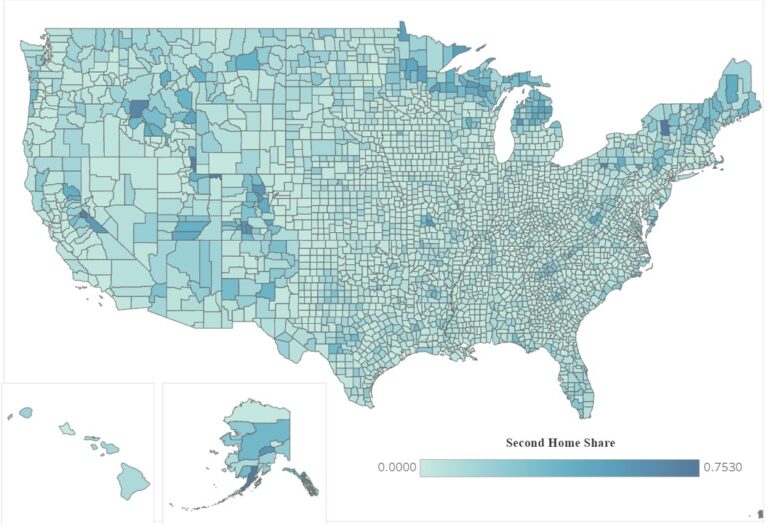
In-depth analysis of the county level data shows that the concentration of second homes is not simply restricted to conventional locations like beachfront areas. There were 807 counties spread over 50 states where second homes accounted for at least 10% of the local housing stock. Only Washington D.C. was the exception, reporting a second home share of 1.8%. Across the nation 314 counties, 10% of all counties in the U.S., had at least 20% of housing units that were made up of second homes.

Counties where at least half of their housing stock is second homes were widely spread over in 14 states.  Of these counties, four were in Wisconsin, four in Colorado, two in Michigan, Minnesota, Utah, California, Massachusetts, and Pennsylvania, and one county each in Alaska, Idaho, Maryland, Missouri, New Jersey, and New York, These national patterns are mapped below.

Counties with more than 25,000 second homes are mostly located in or near metropolitan areas.  The top 10 counties with the most second homes account for around 11.2% of second home stocks, most of which were in Arizona, Florida, California, Massachusetts, and New York. Of the top 10 counties regarding absolute numbers of second homes, only three counties (Lee County, Florida, Barnstable County, Massachusetts, and Collier County, Florida) had more than 20% of their housing stock in second homes.

In terms of methodology, this analysis focuses on the number and location of second homes that would be qualified for the home mortgage interest deduction by individuals using the Census Bureau’s 2022 American Community Survey (ACS). It does not account for homes held primarily for investment or business purposes.

NAHB estimates are based on the definition used for home mortgage interest deduction: a second home is a non-rental property that is not classified as taxpayer’s principal residence. Examples could be: (1) a home that used to be a primary residence due to a move or a period of simultaneous ownership of two homes due to a move; (2) a home under construction for which the eventual homeowner acts as the builder and obtains a construction loan (Treasury regulations permit up to 24 months of interest deductibility for such construction loans); or (3) a non-rental seasonal or vacation residence. However, homes under construction are not included in this analysis because the ACS does not collect data on units under construction.

Discover more from Eye On Housing

Subscribe to get the latest posts sent to your email.


This article was originally published by a eyeonhousing.org . Read the Original article here. .
Pin It