Tag

State

Browsing


With the end of 2024 approaching, NAHB’s Eye on Housing is reviewing the posts that attracted the most readers over the last year. In October, Jesse Wade shared the average real estate tax by state and also an effective rate controlling for home value.

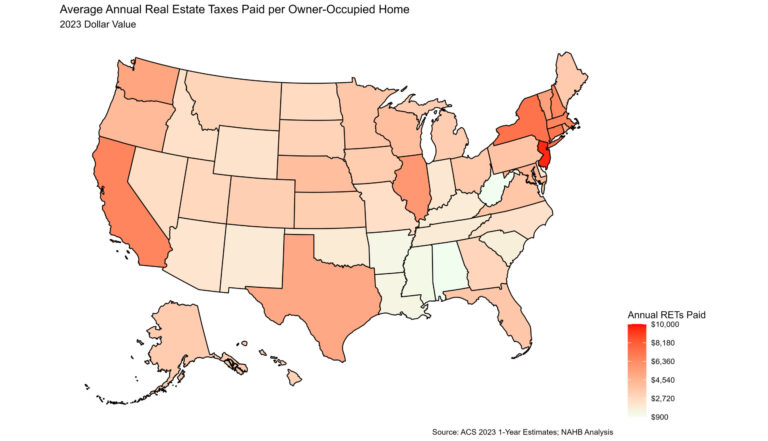
Nationally, across the 86 million owner-occupied homes in the U.S., the average annual real estate taxes paid in 2023 was $4,112, according to NAHB analysis of the 2023 American Community Survey. Homeowners in New Jersey continued to pay the highest real estate taxes, paying an average of $9,572, 30.6% higher than the second highest, New York, at $7,329 . On the other end of the distribution, homeowners in Alabama paid the lowest average amount of real estate taxes at $978. The map below shows the geographic variation of average annual real estate taxes (RETs) paid.

Compared to 2022, every state saw increases in the average amount of real estate taxes paid. The largest percentage increase was in Hawaii, up 21.1% from $2,541 to $3,078.  The smallest increase was in New Hampshire, up 1.1% from $6,385 to $6,453.

Average Effective Property Tax Rates

While average annual real estate taxes paid is important, it provides an incomplete picture. Property values vary across states, which explains some, if not most, of the variation across the nation in average annual real estate taxes. To control for property values and create a more informative state-by-state analysis, NAHB calculates the average effective property tax rate by dividing aggregate real estate taxes paid by aggregate value of owner-occupied housing within each state. For example, the aggregate real estate taxes paid across the U.S. was $352.3 billion with an aggregate value of owner-occupied real estate totaling $38.8 trillion in 2023. Using these two amounts, the average effective property tax rate nationally was $9.09 ($352.3 billion/$38.8 trillion) per $1,000 in home value. This effective rate can be expressed as a percentage of home value or as a dollar amount taxed per $1,000 of a home’s value. The map below displays the effective rate by state below.  

Illinois, a change from New Jersey in 2022 , had the highest effective property tax rate at $18.25 per $1,000 of home value. Consistent with 2022, Hawaii had the lowest effective property tax rate at $3.18 per $1,000 of home value. Additionally, Hawaii had the largest increase over the year, up 18.8% from $2.68 in 2022. Twenty states saw their effective property tax rates fall between 2022 and 2023, with the largest decrease occurring in West Virginia where it fell 6.0%, from $5.06 to $4.75 per $1,000.

Intrastate Variation: Examples from New York

While property taxes clearly vary by state, there also exists variation within states themselves. The latest county level data available comes from 2022 5-year ACS estimates. Analyzing these data , New York showed the highest degree of variation of average property taxes paid and effective real estate tax rates across the counties of any state. Home owners in Westchester County on average paid $14,156 in real estate taxes in 2022, the highest of any county in New York. The lowest amount was in Hamilton County, where home owners paid on average $2,827 in real estate taxes.

For effective property tax rates, New York continues to tell the story of intrastate variation. As shown above, Westchester County paid the higher average annual real estate taxes in 2022, but looking at effective property tax rate, which accounts for home value, Westchester’s effective property tax rate is near the middle at $18.34.  Home owners in Monroe County seem to get the short end of the stick, paying at a rate of $26.27 per $1,000 of home value, the highest in New York. The lowest effective property tax rate was in Kings County, paying a mere $5.30 per $1,000 of home value in taxes.

Discover more from Eye On Housing

Subscribe to get the latest posts sent to your email.


This article was originally published by a eyeonhousing.org . Read the Original article here. .

House prices posted modest annual growth for the third quarter of 2024, as elevated mortgage rates kept many potential home buyers away from the housing market. Nonetheless, housing inventory has improved in recent months.

Nationally, house price appreciation has decelerated for two straight quarters. According to the quarterly all-transactions House Price Index (HPI) released by the Federal Housing Finance Agency (FHFA), U.S. house prices rose 5.1% in the third quarter of 2024, compared to the third quarter of 2023.

The quarterly FHFA HPI not only reports house prices at the national level, but also provides insights about house price fluctuations at the state and metro area levels. The FHFA HPI used in this article is the all-transactions index, measuring average price changes in repeat sales or refinancings on the same single-family properties.  

Between the third quarter of 2023 and the third quarter of 2024, all 50 states and the District of Columbia had positive house price appreciation, ranging from 1.2% to 8.8%. New Jersey and Connecticut topped the house price appreciation list with an 8.8% gain. They were followed by Rhode Island with an 8.4% gain. Meanwhile, the District of Columbia had the lowest price growth (+1.2%). Among all 50 states and the District of Columbia, 29 states exceeded the national growth rate of 5.1%. Compared to the second quarter of 2024, 40 out of the 50 states had a deceleration in house price appreciation in the third quarter.

House prices have changed unevenly across U.S. metro areas, from the third quarter of 2023 to the third quarter of 2024. House price appreciation ranged from -9.0% to +19.1%. In the third quarter of 2024, 21 metro areas, in reddish color on the map above, had negative house price appreciation, while the remaining 363 metro areas experienced positive price appreciation.

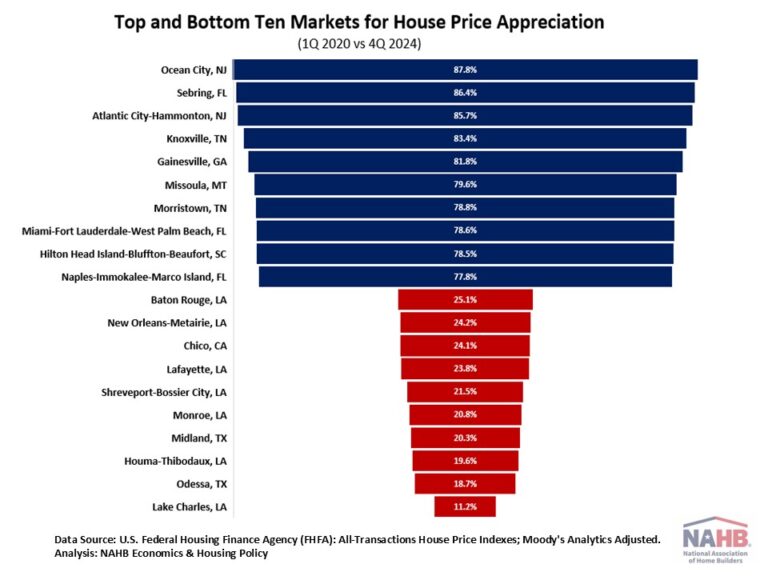
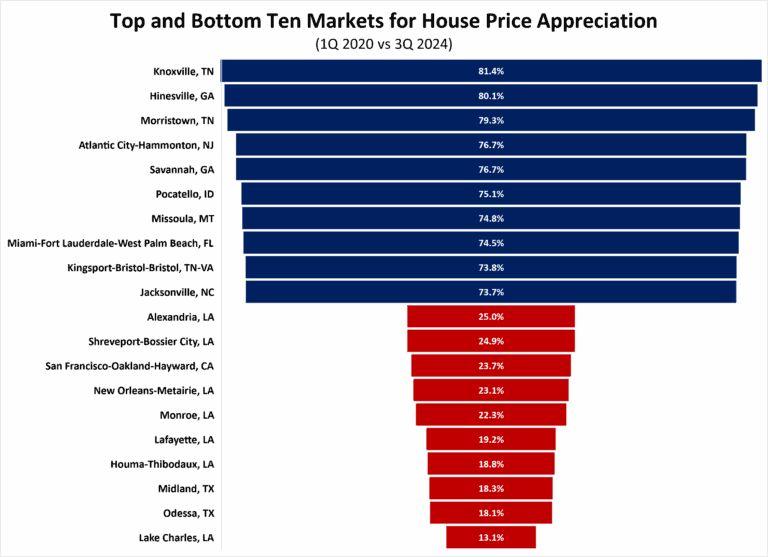
Additionally, house prices have increased dramatically since the COVID-19 pandemic. Nationally, house prices rose 50.4% between the first quarter of 2020 and the third quarter of 2024. More than half of the metro areas saw house prices rise by more than the national price growth rate of 50.4%.

The table below shows the top and bottom ten markets for house price appreciation between the first quarter of 2020 and the third quarter of 2024. Among all the metro areas, house price appreciation ranged from 13.1% to 81.4%. Knoxville, TN has experienced the highest house price appreciation. Lake Charles, LA had the lowest appreciation.

Discover more from Eye On Housing

Subscribe to get the latest posts sent to your email.


This article was originally published by a eyeonhousing.org . Read the Original article here. .


Nonfarm payroll employment increased in 41 states and the District of Columbia in September compared to the previous month, while eight states saw a decrease. Nevada reported no change. According to the Bureau of Labor Statistics, nationwide total nonfarm payroll employment increased by 254,000 in September, following a gain of 159,000 jobs in August.

On a month-over-month basis, employment data was most favorable in Texas, which added 29,200 jobs. New Jersey came in second (+19,200), followed by Florida (+17,000). A total of 17,400 jobs were lost across eight states, with Iowa reporting the steepest job losses at 4,800. In percentage terms, employment increased the highest in Idaho at 0.7%, while Iowa saw the biggest decline at 0.3% between August and September.

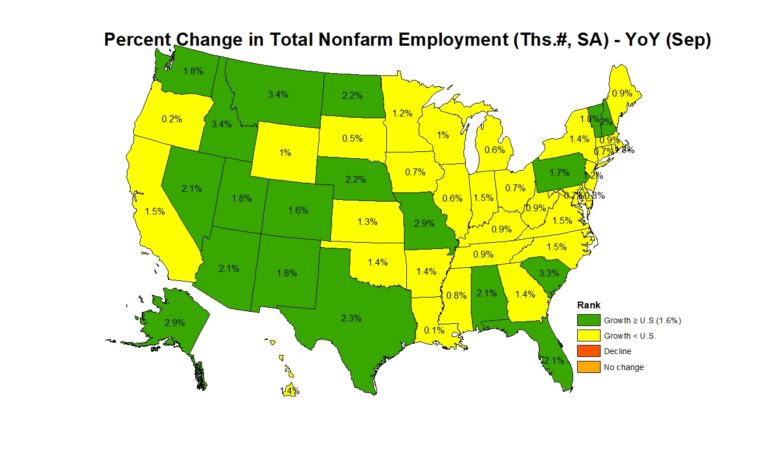
Year-over-year ending in September, 2.4 million jobs have been added to the labor market across all 50 states and the District of Columbia. The range of job gains spanned from 2,000 jobs in Louisiana to 327,400 jobs in Texas. In percentage terms, the range of job growth spanned 3.4% in Idaho to 0.1% in Louisiana.

Across the nation, construction sector jobs data   —which includes both residential and non-residential construction—showed that 24 states and the District of Columbia reported an increase in September compared to August, while 23 states lost construction sector jobs. The three remaining states reported no change on a month-over-month basis. Texas, with the highest increase, added 8,100 construction jobs, while Tennessee, on the other end of the spectrum, lost 1,600 jobs. Overall, the construction industry added a net 25,000 jobs in September compared to the previous month. In percentage terms, Ohio reported the highest increase at 2.7% and North Dakota reported the largest decline at 2.1%.

Year-over-year, construction sector jobs in the U.S. increased by 238,000, which is a 3.0% increase compared to the September 2023 level. Texas added 42,300 jobs, which was the largest gain of any state, while New York lost 6,900 construction sector jobs. In percentage terms, Alaska had the highest annual growth rate in the construction sector at 21.1%. Over this period, Oregon reported the largest decline of 4.1%.

Discover more from Eye On Housing

Subscribe to get the latest posts sent to your email.


This article was originally published by a eyeonhousing.org . Read the Original article here. .

Nationally, across the 86 million owner-occupied homes in the U.S., the average annual real estate taxes paid in 2023 was $4,112, according to NAHB analysis of the 2023 American Community Survey. Homeowners in New Jersey continued to pay the highest real estate taxes, paying an average of $9,572, 30.6% higher than the second highest, New York, at $7,329 . On the other end of the distribution, homeowners in Alabama paid the lowest average amount of real estate taxes at $978. The map below shows the geographic variation of average annual real estate taxes (RETs) paid.

Compared to 2022, every state saw increases in the average amount of real estate taxes paid. The largest percentage increase was in Hawaii, up 21.1% from $2,541 to $3,078.  The smallest increase was in New Hampshire, up 1.1% from $6,385 to $6,453.

Average Effective Property Tax Rates

While average annual real estate taxes paid is important, it provides an incomplete picture. Property values vary across states, which explains some, if not most, of the variation across the nation in average annual real estate taxes. To control for property values and create a more informative state-by-state analysis, NAHB calculates the average effective property tax rate by dividing aggregate real estate taxes paid by aggregate value of owner-occupied housing within each state. For example, the aggregate real estate taxes paid across the U.S. was $352.3 billion with an aggregate value of owner-occupied real estate totaling $38.8 trillion in 2023. Using these two amounts, the average effective property tax rate nationally was $9.09 ($352.3 billion/$38.8 trillion) per $1,000 in home value. This effective rate can be expressed as a percentage of home value or as a dollar amount taxed per $1,000 of a home’s value. The map below displays the effective rate by state below.  

Illinois, a change from New Jersey in 2022 , had the highest effective property tax rate at $18.25 per $1,000 of home value. Consistent with 2022, Hawaii had the lowest effective property tax rate at $3.18 per $1,000 of home value. Additionally, Hawaii had the largest increase over the year, up 18.8% from $2.68 in 2022. Twenty states saw their effective property tax rates fall between 2022 and 2023, with the largest decrease occurring in West Virginia where it fell 6.0%, from $5.06 to $4.75 per $1,000.

Intrastate Variation: Examples from New York

While property taxes clearly vary by state, there also exists variation within states themselves. The latest county level data available comes from 2022 5-year ACS estimates. Analyzing these data , New York showed the highest degree of variation of average property taxes paid and effective real estate tax rates across the counties of any state. Home owners in Westchester County on average paid $14,156 in real estate taxes in 2022, the highest of any county in New York. The lowest amount was in Hamilton County, where home owners paid on average $2,827 in real estate taxes.

For effective property tax rates, New York continues to tell the story of intrastate variation. As shown above, Westchester County paid the higher average annual real estate taxes in 2022, but looking at effective property tax rate, which accounts for home value, Westchester’s effective property tax rate is near the middle at $18.34.  Home owners in Monroe County seem to get the short end of the stick, paying at a rate of $26.27 per $1,000 of home value, the highest in New York. The lowest effective property tax rate was in Kings County, paying a mere $5.30 per $1,000 of home value in taxes.

Discover more from Eye On Housing

Subscribe to get the latest posts sent to your email.


This article was originally published by a eyeonhousing.org . Read the Original article here. .

Residential improvement spending softened in 2023 due to elevated interest rates, high inflation, and sluggish home sales. According to the Bureau of Economic Analysis’ National Income and Product Accounts (NIPA), expenditures for residential home improvements rose 2% to $363 billion in 2023, from $356 billion in 2022. The 2% year-over-year (YOY) gain in 2023 marks the smallest YOY gain since 2011. This annual data indicates that the YOY gain in residential improvement spending slowed, but the remodeling market remained solid.

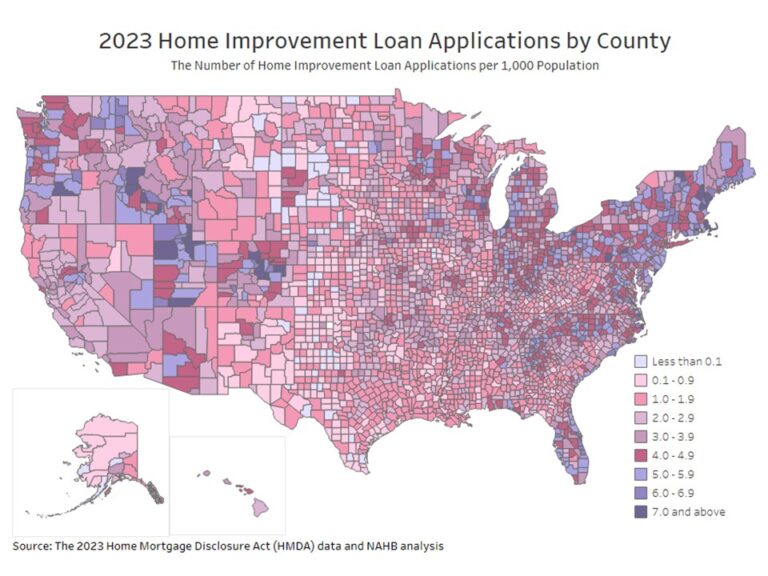
In this article, NAHB’s analysis of the 2023 Home Mortgage Disclosure Act (HMDA) data provides insight into remodeling activity in 2023 by age group, and by U.S. states and counties. The 2023 HMDA data, published by the Consumer Financial Protection Bureau (CFPB), covers detailed information on residential mortgage lending in 2023, including the type, purpose, and characteristics of home mortgage applications or purchased loans, and demographic and other information about loan applicants.

According to the 2023 HMDA data, the number of home improvement loan applications declined by 17% in 2023, compared to the previous year. Moreover, the total amount of home improvement loans was about 44 billion (24%) less than the total amount in 2022.

Age Group Analysis:

Figure 1 below presents the number of home improvement loan applications by applicants’ age from 2018 to 2023. Among all age groups, the number of home improvement loan applications surged in 2022 and declined in 2023. Compared to 2022, the number of home improvement loan applications decreased by 23% in 2023 for applicants aged between 25 and 34 and between 35 and 40. Applicants between the ages of 45 and 54 remained the largest age group to apply for home improvement loan applications, even though the number of loan applications for this age group reduced by 18% in 2023.

For applicants under 55 years old and above 74 years old, the number of loan applications in 2023 was higher than the pre-pandemic level in 2018 and 2019. Meanwhile, applicants aged between 55 and 74 had a lower number of loan applications in 2023 than in 2018 and 2019. As interest rates reached historically high levels in 2023, homeowners used savings to pay for home improvements, avoiding the extra expense of interest on loans.

State-Level Analysis:

While remodeling activity changed among different age groups, remodeling has also varied across geographic locations due to the cost of living, local economic conditions, and house prices.

With respect to total home improvement loan applications, California had the highest number of home improvement loan applications in 2023, with 118,649 applications. Florida came in second with 102,746 home improvement loan applications. Wyoming and Alaska had the lowest total numbers of home improvement loan applications with 1,312 and 1,358, respectively.

When we look at home improvement loan applications per 1,000 population, two states in New England, Rhode Island and New Hampshire, had the highest number of home improvement loan applications, with a rate of 6.4 and 6.0 applications per 1,000 population, respectively. Louisiana had the lowest number of home improvement loan applications, with a rate of 1.6 applications per 1,000 population.

In total, there were 3.7 loan applications for home improvements for every 1,000 population in the United States. California, the most populous state of the United States, reported 3.0 applications per 1,000 population, which is lower than the national average rate.

County-Level Analysis:

The analysis of county-level home improvement loan applications per 1,000 population reveals that the aggregate market population is not significantly related to the number of per capita home improvement loan applications. In 2023, the top 10 most populated counties in the United States had an average rate of 2.6 loan applications per 1,000 population. Los Angeles County in California, one of the most populous counties, reported a rate of 2.8 loan applications per 1,000 population in 2023.  Meanwhile, some counties with a lower population had a higher loan application rate (that is, the number of home improvement loan applications per 1,000 population). For example, Nantucket County in Massachusetts, with a population of about 14,000, had the highest loan application rate of 11.1 among all the counties in the United States. Camas County in Idaho, with roughly one thousand population, had a loan application rate of 8.9, higher than about 99.7% of the counties in the United States.

Additionally, the analysis finds that home improvement loan applications are relatively more common in the Mountain and New England Divisions. In total, there were 43 counties that reported 7 or higher home improvement loan applications per 1,000 population, and more than 72% of these counties were in the Mountain and New England Divisions. None of these 43 counties were in the West South Central, East South Central, or West North Central Divisions. The top five counties with the highest home improvement loan application rate were: Nantucket County (MA), Grand Isle County (VT), Dare County (NC), Boise County (ID), and Barnstable County (MA).

Discover more from Eye On Housing

Subscribe to get the latest posts sent to your email.


This article was originally published by a eyeonhousing.org . Read the Original article here. .

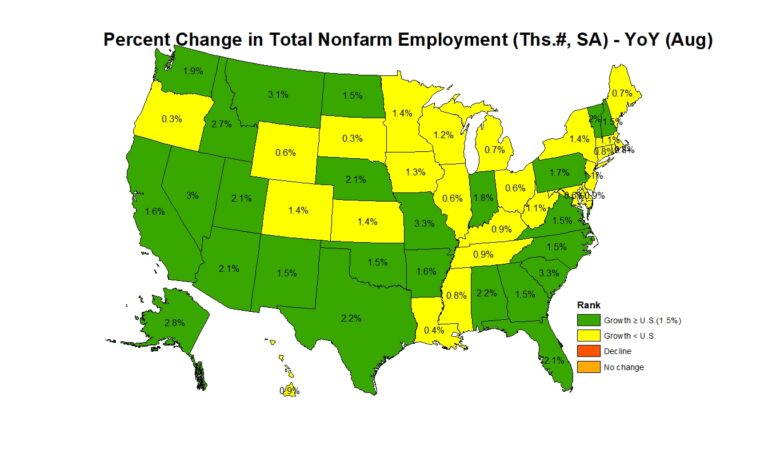
Nonfarm payroll employment increased in 32 states in August compared to the previous month, while 17 states and the District of Columbia saw a decrease. Kansas reported no change. According to the Bureau of Labor Statistics, nationwide total nonfarm payroll employment increased by 142,000 in August, following a gain of 89,000 jobs in July.

On a month-over-month basis, employment data was most favorable in Texas, which added 78,000 jobs. Texas accounted for more than half the jobs created nationwide in August. Indiana came in second (+19,800), followed by Minnesota (+14,400). A total of 42,400 jobs were lost across the 17 states and the District of Columbia, with New York reporting the steepest job losses at 7,400. In percentage terms, employment increased the highest in Texas and Indiana at 0.6%, while South Dakota saw the biggest decline at 0.7% between July and August.

Year-over-year ending in August, 2.4 million jobs have been added to the labor market across all 50 states and the District of Columbia. The range of job gains spanned from 1,500 jobs in South Dakota to 302,400 jobs in Texas. In percentage terms, the range of job growth spanned 3.3% in Missouri to 0.3% in South Dakota.

Across the nation, construction sector jobs data1 —which includes both residential and non-residential construction—showed that 27 states and the District of Columbia reported an increase in August compared to July, while 20 states lost construction sector jobs. The three remaining states reported no change on a month-over-month basis. Texas, with the highest increase, added 8,300 construction jobs, while California, on the other end of the spectrum, lost 3,300 jobs. Overall, the construction industry added a net 34,000 jobs in August compared to the previous month. In percentage terms, Wyoming reported the highest increase at 2.3% and Tennessee reported the largest decline at 1.6%.

Year-over-year, construction sector jobs in the U.S. increased by 228,000, which is a 2.8% increase compared to the August 2023 level. Texas added 36,600 jobs, which was the largest gain of any state, while Maryland lost 4,800 construction sector jobs. In percentage terms, Alaska had the highest annual growth rate in the construction sector at 17.8%. Over this period, Maine reported the largest decline of 4.7%.

Discover more from Eye On Housing

Subscribe to get the latest posts sent to your email.


This article was originally published by a eyeonhousing.org . Read the Original article here. .

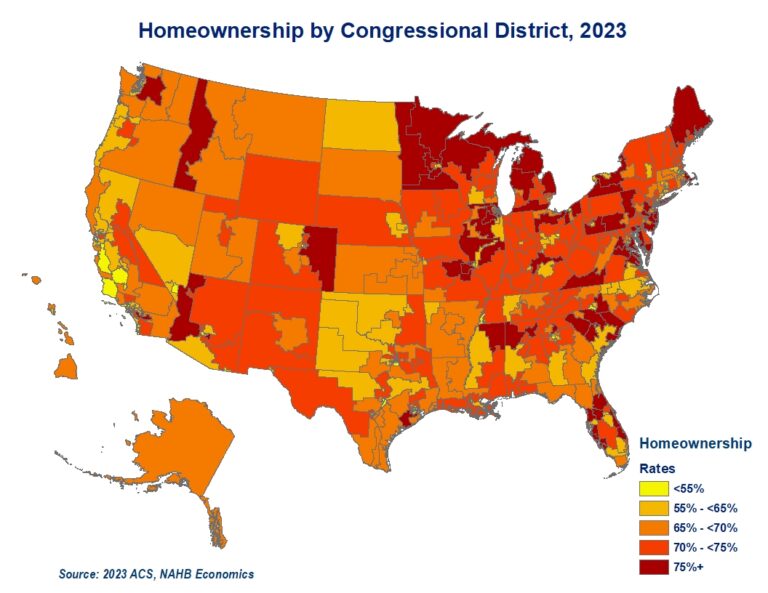
With housing being a key issue for the 2024 election cycle, it is worth analyzing distinct characteristics as well as similarities that housing markets in congressional districts share. The differences start with a substantial variation in homeownership rates across congressional districts.

While the 2023 American Community Survey (ACS) reports that close to two thirds of US households (65.2%) are home owners, there are forty congressional districts where renter households represent the majority. In twelve of these districts, renters account for more than two thirds of households. This list includes eight urban high-density congressional districts in New York, three districts in California and New Jersey’s 8th congressional district. The pattern of urban congressional districts registering lower home ownership rates repeats across the country.

At the other end of the spectrum, there are seven congressional districts with home owners representing over 80% of households. These include three districts in Michigan, two in New York, and one in both Maryland, and Minnesota.

New York stands out with simultaneous congressional districts with the lowest and second highest homeownership rates. Close to 84% of households in New York’s 1st district located in eastern Long Island are home owners. The only other congressional district that registers a higher homeownership rate is Michigan’s 9th congressional district located in the Thumb at 85%.   In contrast, in New York’s urban 13th and 15th districts, home owners comprise a minority of less than 16% and 13%, respectively.

California is another example of substantial variation of homeownership rates across congressional districts within a state. In California’s 41st district in Riverside County, 3 out of 4 households are home owners. At the same time, in California’s 34th district in the city of Los Angeles, only 22% of households live in a home they own. 

Population density, racial and ethnical makeup, as well as varying cost of ownership, all contribute to substantial variation in homeownership rates across the US congressional districts.

Additional housing data for your congressional district are provided by the US Census Bureau here.

Discover more from Eye On Housing

Subscribe to get the latest posts sent to your email.


This article was originally published by a eyeonhousing.org . Read the Original article here. .

State & local tax revenue from property taxes paid reached $780.9 billion in the four quarters ending in the second quarter of 2024 (seasonally adjusted), according to the Census Bureau’s estimates. This is a 1.7% increase from the revised $767.7 billion in the four quarters ending in the first quarter of 2024. Year-to-date, total state and local tax revenue was $1.05 trillion. This was 5% higher than the $995.7 billion through the first two quarters of 2023.

The 1.7% increase in the four-quarter property tax revenue was down from the previous quarter of 1.8%. Property tax revenues have continued to grow above the average rate of 0.96% since 2011, with this quarter marking the seventh consecutive quarter of above average growth.

Year-over-year, property tax revenue was 9.1% higher. Year-over-year growth in property tax revenue has consistently been above 9% for four consecutive quarters. Dating back to 2012, the average year-over-year growth is 4.0%.

The property tax share of total state & local tax collections in the second quarter stood at 37.8%, down from 37.9%. This was the first decline in the share since its recent trough in the third quarter of 2022 (33.7%).

Of total collections, property tax made up the largest share, followed by sales tax at 28.0%. Individual income tax represented 25.5% of tax revenue, while corporate tax made up the remaining 8.7% of revenues for state & local revenues in the second quarter of 2024.

Over the past decade, state & local governments have been most reliant on property taxes for revenue. Sales tax has had an increased importance since 2023, when the share of sales tax of total revenues grew above individual income tax shares. See the chart below for the trends of total tax revenues shares.

Discover more from Eye On Housing

Subscribe to get the latest posts sent to your email.


This article was originally published by a eyeonhousing.org . Read the Original article here. .

House price appreciation was recorded in all 50 states and the District of Columbia. Limited resale inventory and strong growth in demand continued to put upward pressure on house prices.

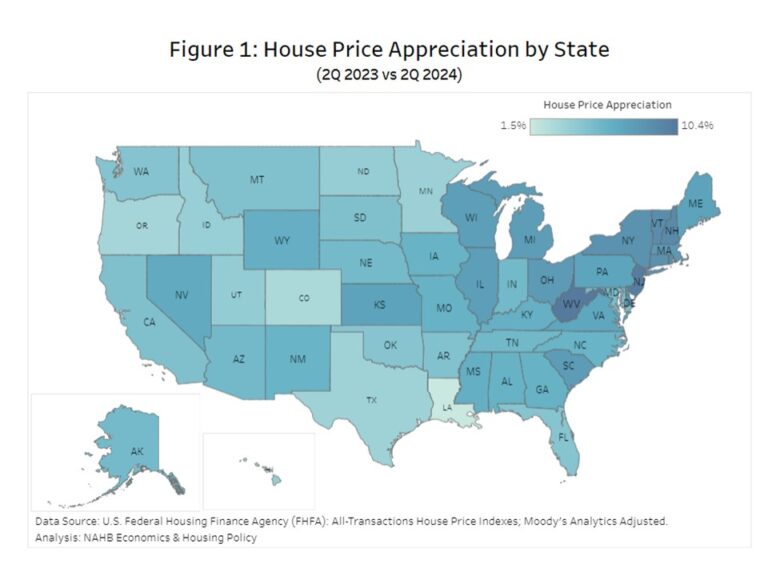
Nationally, house prices grew at a relatively slower pace, compared to double-digit annual growth during the COVID-19 pandemic. According to the quarterly all-transactions House Price Index (HPI) released by the Federal Housing Finance Agency (FHFA), U.S. house prices rose 5.9% in the second quarter of 2024, compared to the second quarter of 2023. This rate of price growth decreased from 6.4% in the first quarter of 2024.

The quarterly FHFA HPI not only reports house prices at the national level, but it also provides insights about house price fluctuations at the state and metro area levels. The FHFA HPI used in this article is the all-transactions index, measuring average price changes in repeat sales or refinancings on the same single-family properties.  

Between the second quarter of 2023 and the second quarter of 2024, all 50 states and the District of Columbia had positive house price appreciation, ranging from 1.5% to 10.4%. West Virginia led the way with the highest price appreciation (+10.4%). It was followed by New Jersey with a 10.1% gain, and New Hampshire with a 9.1% gain. Meanwhile, Louisiana had the lowest price growth (+1.5%). Among all 50 states and the District of Columbia, 28 states exceeded the national growth rate of 5.9%. Compared to the first quarter of 2024, thirty-five out of the 50 states had a deceleration in house price appreciation in the second quarter.

House prices have changed unevenly across U.S. metro areas, from the second quarter of 2023 to the second quarter of 2024. House price appreciation ranged from -4.6% to +20.7%. In the second quarter of 2024, 14 metro areas, in reddish color on the map above, had negative house price appreciation, while the remaining 370 metro areas experienced positive price appreciation.

Meanwhile, house prices in the second quarter of 2024 are much higher than they were before the pandemic. Nationally, house prices rose 49.7% between the first quarter of 2020 and the second quarter of 2024. More than half of the metro areas saw house prices rise by more than the national price growth rate of 49.7%. Among all the metro areas, house price appreciation ranged from 13.8% to 81.0%. House prices in the South and the West have grown faster than the prices in the Midwest and Northeast. Within the top 20 metro areas that had the highest house price appreciation, 11 metro areas are in the South Atlantic Division and six in the East South Central Division, while none were in the Midwest.

Discover more from Eye On Housing

Subscribe to get the latest posts sent to your email.


This article was originally published by a eyeonhousing.org . Read the Original article here. .


Nonfarm payroll employment increased in 28 states in July compared to the previous month, while 22 states saw a decrease. The District of Columbia reported no change. According to the Bureau of Labor Statistics, nationwide total nonfarm payroll employment increased by 114,000 in July, following a gain of 179,000 jobs in June.

On a month-over-month basis, employment data was most favorable in New York, which added 41,400 jobs, followed by Florida (+21,800), and then California (+21,100). A total of 81,700 jobs were lost across the 22 states, with Missouri reporting the steepest job losses at 22,400. In percentage terms, employment increased the highest in Vermont at 0.5%, while Missouri saw the biggest decline at 0.7% between June and July.

Year-over-year ending in July, 2.5 million jobs have been added to the labor market across all 50 states and the District of Columbia. The range of job gains spanned from 1,900 jobs in Wyoming to 284,400 jobs in California. In percentage terms, the range of job growth spanned 3.7% in South Carolina to 0.4% in Oregon.

Across the nation, construction sector jobs data[1]—which includes both residential and non-residential construction—showed that 29 states and the District of Columbia reported an increase in July compared to June, while 16 states lost construction sector jobs. The five remaining states reported no change on a month-over-month basis. Florida, with the highest increase, added 6,300 construction jobs, while New York, on the other end of the spectrum, lost 3,800 jobs. Overall, the construction industry added a net 25,000 jobs in July compared to the previous month. In percentage terms, Tennessee reported the highest increase at 3.3% and Arkansas reported the largest decline at 1.2%.

Year-over-year, construction sector jobs in the U.S. increased by 239,000, which is a 3.0% increase compared to the July 2023 level. Florida added 36,700 jobs, which was the largest gain of any state, while New York lost 8,100 construction sector jobs. In percentage terms, Alaska had the highest annual growth rate in the construction sector at 19.9%. Over this period, Maine reported the largest decline of 4.1%.

[1] For this analysis, BLS combined employment totals for mining, logging, and construction are treated as construction employment for the District of Columbia, Delaware, and Hawaii.

Discover more from Eye On Housing

Subscribe to get the latest posts sent to your email.


This article was originally published by a eyeonhousing.org . Read the Original article here. .
Pin It