Tag

Slow

Browsing


Home price growth continued to slow in October, growing at a rate of 3.60% year-over-year, according to the S&P CoreLogic Case-Shiller Home Price Index (seasonally adjusted – SA). This marks a decline from the 3.90% growth rate recorded in September and represents the seventh consecutive drop in the annual growth rate since reaching a peak of 6.54% in March 2024. As shown in the graph below, the index level has experienced monthly declines since July. 

By Metro Area

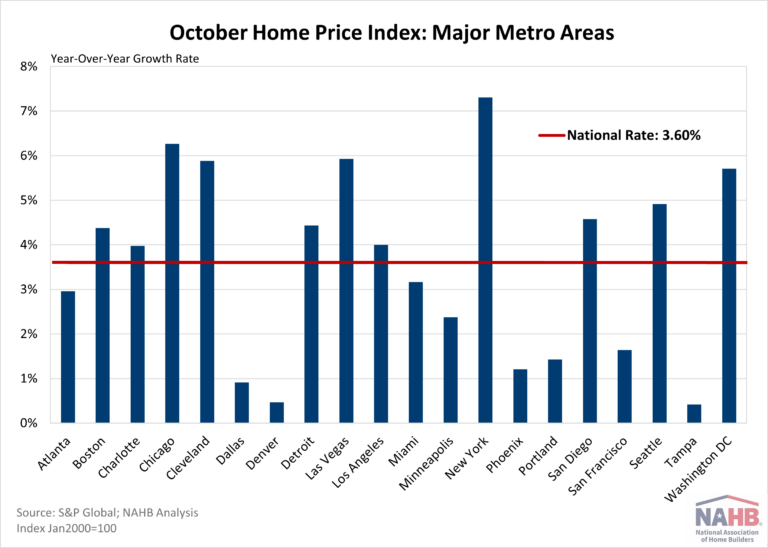
In addition to tracking national home price changes, the S&P CoreLogic Index (SA) also reports home price indexes across 20 metro areas. Compared to last year, all 20 metro areas reported a home price increase.  There were 11 metro areas that grew more than the national rate of 3.60%. The highest annual rate was New York at 7.31%, followed by Chicago at 6.27% and Las Vegas at 5.93%. The smallest home price growth over the year was seen by Tampa at 0.41%, followed by Denver at 0.47%, and Dallas at 0.91%. 

By Census Division

A similar index, the Federal Housing Finance Agency Home Price Index (SA) publishes not only national data but also data by census division. The national year-over-year rate was 4.43% for October. Meanwhile, the division with the highest year-over-year rate was 6.95% in the Middle Atlantic, while the lowest was 2.30% in the Pacific. A three-month trend in rates is shown for each division below. The FHFA Home Price Index releases their metro and state data on a quarterly basis, which NAHB analyzed in a previous post. 

Discover more from Eye On Housing

Subscribe to get the latest posts sent to your email.


This article was originally published by a eyeonhousing.org . Read the Original article here. .


Housing starts edged lower last month as average monthly mortgage rates increased a quarter-point from 6.18% to 6.43% between September and October, according to Freddie Mac.

Overall housing starts decreased 3.1% in October to a seasonally adjusted annual rate of 1.31 million units, according to a report from the U.S. Department of Housing and Urban Development and the U.S. Census Bureau.

The October reading of 1.31 million starts is the number of housing units builders would begin if development kept this pace for the next 12 months. Within this overall number, single-family starts decreased 6.9% to a 970,000 seasonally adjusted annual rate. On a year-to-date basis, single-family construction is up 9.3%. The volatile multifamily sector, which includes apartment buildings and condos, increased 9.6% to an annualized 341,000 pace but are down 29.3% on a year-to-date basis.

Although housing starts declined in October, builder sentiment improved for a third straight month in November as builders anticipate an improved regulatory environment in 2025 that will allow the industry to increase housing supply. Further interest rate cuts from the Federal Reserve through 2025 should result in lower interest rates for construction and development loans, helping to lead to a stabilization for apartment construction and expansion for single-family home building.

While multifamily starts increased in October, the number of apartments under construction is down to 821,000, the lowest count since March 2022 and down 18.9% from a year ago. In October, there were 1.8 apartments that completed construction for every one apartment that started construction. The three-month moving average reached a ratio of 2 in October.

There were 644,000 single-family homes under construction in October, down 3.6% from a year ago and down 22% from the peak count in the Spring of 2022.

On a regional and year-to-date basis, combined single-family and multifamily starts are 10.4% higher in the Northeast, 1.7% lower in the Midwest, 5.0% lower in the South due to hurricane effects, and 4.4% lower in the West.

Overall permits decreased 0.6% to a 1.42 million unit annualized rate in October. Single-family permits increased 0.5% to a 968,000 unit rate and are up 9.4% on a year-to-date basis. Multifamily permits decreased 3.0% to an annualized 448,000 pace.

Looking at regional data on a year-to-date basis, permits are 0.9% higher in the Northeast, 3.9% higher in the Midwest, 2.4% lower in the South and 4.8% lower in the West.

Discover more from Eye On Housing

Subscribe to get the latest posts sent to your email.


This article was originally published by a eyeonhousing.org . Read the Original article here. .


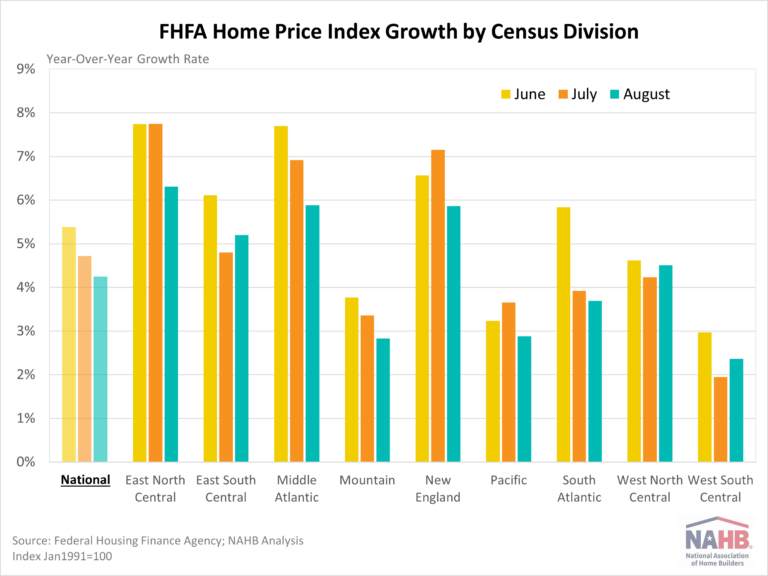
Home price growth continued to slow in August, growing at a rate just above 4% year-over-year. The S&P CoreLogic Case-Shiller Home Price Index (seasonally adjusted – SA) posted a 4.24% annual gain, down from a 4.82% increase in July. Similarly, the Federal Housing Finance Agency Home Price Index (SA) rose 4.25%, down from 4.72% in July. Both indexes experienced a sixth consecutive year-over-year deceleration in August. The year-over-year rate peaked in February 2024 when the S&P CoreLogic Case-Shiller stood at 6.57% and the FHFA at 7.28%.

By Metro Area

In addition to tracking national home price changes, the S&P CoreLogic Index (SA) also reports home price indexes across major metro areas. Compared to last year, all 20 metro areas reported a home price increase.  There were 12 metro areas that grew more than the national rate of 4.24%. The highest annual rate was New York at 8.07%, followed by Las Vegas and Chicago both with rates of 7.22%. The smallest home price growth over the year was seen by Denver at 0.68%, followed by Portland at 0.82%, and Dallas at 1.57%.

By Census Division

Monthly, the FHFA Home Price Index (SA) publishes not only national data but also data by census division. All divisions saw an annual increase of over 2% in August. The highest rate for August was 6.31% in the East South Central division, while the lowest was 2.36% in the West South Central division. As shown in graph below, all divisions saw a slow in rates compared to June. The FHFA Home Price Index releases their metro and state data on a quarterly basis, which NAHB analyzed in a previous post.

Discover more from Eye On Housing

Subscribe to get the latest posts sent to your email.


This article was originally published by a eyeonhousing.org . Read the Original article here. .

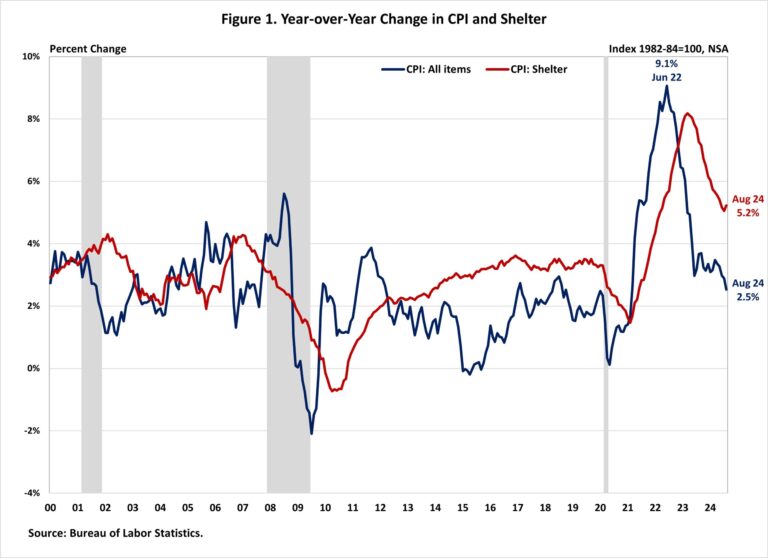
Inflation eased further in August, reaching a new 3-year low despite persistent elevated housing costs. This inflation report is seen as the final key piece of data before the Fed’s meeting next week. The headline reading provides another dovish signal for future monetary policy, after recent signs of weakness in job reports.

Although shelter costs have been trending downward since peaking in early 2023, they continue to exert significant upward pressure on inflation, contributing over 70% of the total 12-month increase in core inflation. As consistent disinflation and a cooling labor market bring the economy into better balance, the Fed is likely to further solidify behind the case for rate cuts, which could help ease some pressure on the housing market.

Though shelter remains the primary driver of inflation, the Fed has limited ability to address rising housing costs, as these increases are driven by a lack of affordable supply and increasing development costs. Additional housing supply is the primary solution to tame housing inflation. However, the Fed’s tools for promoting housing supply are constrained.

In fact, further tightening of monetary policy would hurt housing supply because it would increase the cost of AD&C financing. This can be seen on the graph below, as shelter costs continue to rise at an elevated pace despite Fed policy tightening. Nonetheless, the NAHB forecast expects to see shelter costs decline further in the coming months, as an additional apartment supply reaches the market.  This is supported by real-time data from private data providers that indicate a cooling in rent growth.

The Bureau of Labor Statistics reported that the Consumer Price Index (CPI) rose by 0.2% in August on a seasonally adjusted basis, the same increase as in July. Excluding the volatile food and energy components, the “core” CPI increased by 0.3% in August, after a 0.2% increase in July.

The price index for a broad set of energy sources fell by 0.8% in August, with declines in electricity (-0.7%), gasoline (-0.6%) and natural gas (-1.9%). Meanwhile, the food index rose 0.1%, after a 0.2% increase in July. The index for food away from home increased by 0.3% while the index for food at home remained unchanged.

The index for shelter (+0.5%) continued to be the largest contributor to the monthly increase in all items index. Other top contributors that rose in August include indexes for airline fares (+3.9%) and motor vehicle insurance (+0.6%). Meanwhile, the top contributors that experienced a decline include indexes for used cars and trucks (-1.0%), household furnishings and operations (-0.3%), medical care (-0.1%) and communication (-0.1%). The index for shelter makes up more than 40% of the “core” CPI. The index saw a 0.5% rise in August, following an increase of 0.4% in July. The indexes for owners’ equivalent rent (OER) increased by 0.5% and rent of primary residence (RPR) rose by 0.4% over the month. These gains have been the largest contributors to headline inflation in recent months.

During the past twelve months, on a non-seasonally adjusted basis, the CPI rose by 2.5% in August, following a 2.9% increase in July. This was the slowest annual gain since February 2021. The “core” CPI increased by 3.2% over the past twelve months, the same increase as in July. The food index rose by 2.1%, while the energy index fell by 4.0%, ending five consecutive months of year-over-year increases for the energy index since February 2024.

NAHB constructs a “real” rent index to indicate whether inflation in rents is faster or slower than overall inflation. It provides insight into the supply and demand conditions for rental housing. When inflation in rents is rising faster than overall inflation, the real rent index rises and vice versa. The real rent index is calculated by dividing the price index for rent by the core CPI (to exclude the volatile food and energy components).

In August, the Real Rent Index rose by 0.1%, after a 0.3% increase in July. Over the first eight months of 2024, the monthly growth rate of the Real Rent Index averaged 0.1%, slower than the average of 0.2% in 2023.

Discover more from Eye On Housing

Subscribe to get the latest posts sent to your email.


This article was originally published by a eyeonhousing.org . Read the Original article here. .

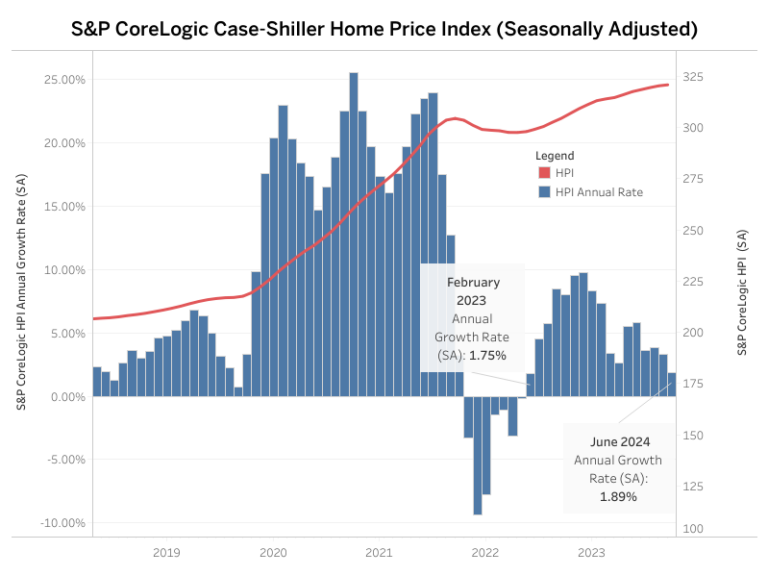
Home price growth continues to decelerate, according to the recent release of the S&P CoreLogic Case-Shiller Home Price Index (HPI). The S&P CoreLogic Case-Shiller HPI increased at a seasonally adjusted annual rate of 1.89% for June 2024, slowing from a revised rate of 3.28% in May. Home prices have not seen an outright decrease since January of 2023. However, 1.89% is the smallest growth in prices since February of 2023. Additionally, the growth rate has shown a generally declining trend since a peak of 9.76% in August 2023.

Meanwhile, the Home Price Index released by the Federal Housing Finance Agency (FHFA; SA), recorded a decline in home prices for June. The index declined at an annual rate of -1.04% for June, decreasing from a revised 0.51% rate in May. The FHFA Index has experienced just one other decrease since August of 2022, with a decline of -1.03% in January 2024.

Year-Over-Year

Home prices experienced a fourth year-over-year deceleration in June, tabulated by both indexes. The S&P CoreLogic Case-Shiller HPI (not seasonally adjusted – NSA) posted a 5.42% annual gain in June, down from a 5.94% increase in May. Since June of 2023, the index has seen steady increases in the year-over-year growth rate. However, this growth rate began slowing in March of 2024 and has continued to decelerate through June. Meanwhile, the FHFA HPI (NSA) index rose 5.23%, down from 5.95% in May. This rate has decelerated from 7.19% in February.

By Metro Area

In addition to tracking national home price changes, the S&P CoreLogic Index (NSA) also reported home price indexes across 20 metro areas in May. At an annual rate, five out of 20 metro areas reported home price declines: Phoenix at -3.02%, Portland at -2.90%, Dallas at -0.69%, Charlotte at -0.56%, and Miami at -0.03%. Among the 20 metro areas, thirteen exceeded the national rate of 1.89%. Seattle had the highest rate at 10.80%, followed by San Diego at 9.18%, and then Los Angeles at 7.89%. The monthly trends are shown in the graph below.

By Census Division

Monthly, the FHFA HPI (SA) releases not only national data but census division data as well. Out of the nine census divisions, seven posted negative monthly depreciation (adjusted to an annual rate) for June, ranging from -7.59% in the Mountain division to -0.82% in the Middle Atlantic. The remaining two divisions with positive home price appreciation were East South Central at 8.66% and the South Atlantic at 3.09%. The FHFA HPI releases its metro and state data on a quarterly basis, which NAHB analyzes in a previous post.

Discover more from Eye On Housing

Subscribe to get the latest posts sent to your email.


This article was originally published by a eyeonhousing.org . Read the Original article here. .
Pin It