Tag

SingleFamily

Browsing


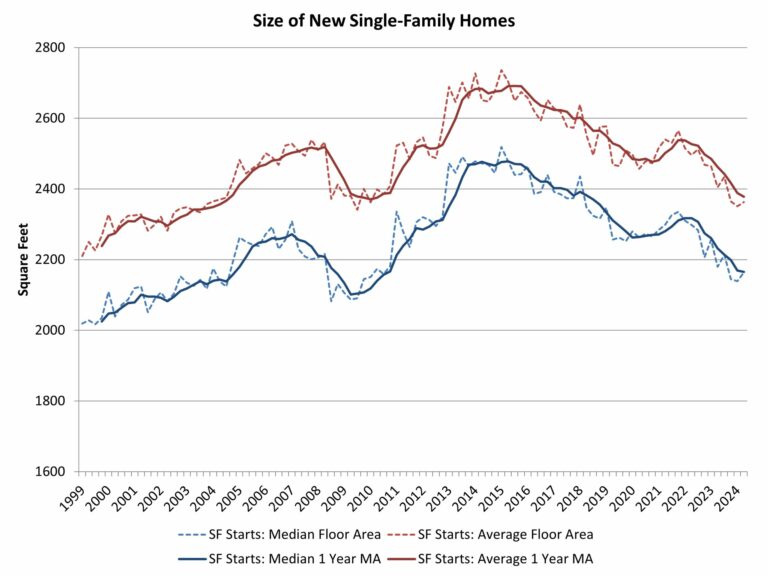
An expected impact of the virus crisis was a need for more residential space, as people use homes for more purposes including work. Home size correspondingly increased in 2021 as interest rates reached historic lows. However, as interest rates increased in 2022 and 2023, and housing affordability worsened, the demand for home size has trended lower.

According to second quarter 2024 data from the Census Quarterly Starts and Completions by Purpose and Design and NAHB analysis, median single-family square floor area edged up to 2,164 square feet, just off the lowest reading since the second half of 2009. Average (mean) square footage for new single-family homes registered at 2,363 square feet.

Since Great Recession lows (and on a one-year moving average basis), the average size of a new single-family home is now effectively flat at 2,387 square feet, while the median size is about 3% higher at 2,165 square feet.

Home size rose from 2009 to 2015 as entry-level new construction lost market share. Home size declined between 2016 and 2020 as more starter homes were developed. After a brief increase during the post-COVID building boom, home size trended lower due to declining affordability conditions. As interest rates decline, new home size could level off and increase in the quarters ahead.

Discover more from Eye On Housing

Subscribe to get the latest posts sent to your email.


This article was originally published by a eyeonhousing.org . Read the Original article here. .

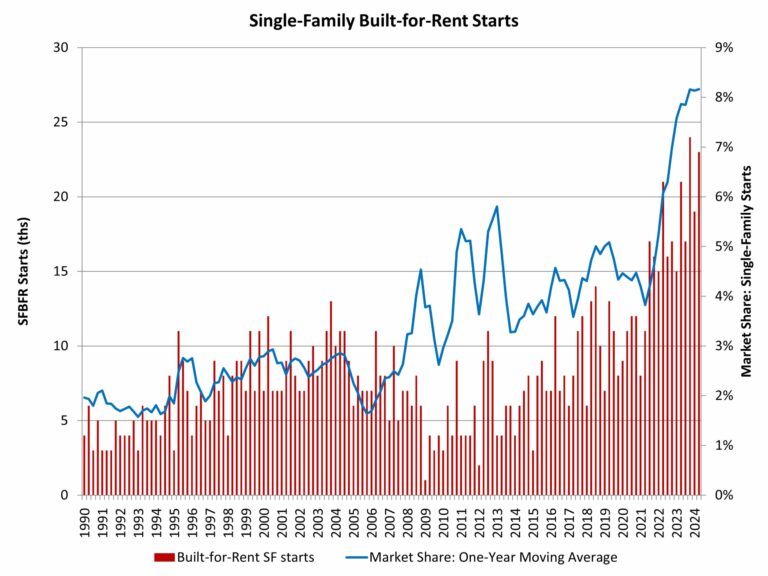
Single-family built-for-rent construction posted year-over-year gains as of the second quarter of 2024, as builders sought to add additional rental housing in a market facing ongoing, elevated mortgage interest rates.

According to NAHB’s analysis of data from the Census Bureau’s Quarterly Starts and Completions by Purpose and Design, there were approximately 23,000 single-family built-for-rent (SFBFR) starts during the second quarter of 2024. This is almost 10% higher than the second quarter of 2023. Over the last four quarters, 83,000 such homes began construction, which is a more than 20% increase compared to the 69,000 estimated SFBFR starts in the four quarters prior to that period.

The SFBFR market is a source of inventory amid challenges over housing affordability and downpayment requirements in the for-sale market, particularly during a period when a growing number of people want more space and a single-family structure. Single-family built-for-rent construction differs in terms of structural characteristics compared to other newly-built single-family homes, particularly with respect to home size. However, investor demand for single-family homes, both existing and new, has cooled with higher interest rates. Nonetheless, builders continue to build projects of built-for-rent homes for their own operation.

Given the relatively small size of this market segment, the quarter-to-quarter movements typically are not statistically significant. The current four-quarter moving average of market share (8%) is nonetheless higher than the historical average of 2.7% (1992-2012).

Importantly, as measured for this analysis, the estimates noted above include only homes built and held by the builder for rental purposes. The estimates exclude homes that are sold to another party for rental purposes, which NAHB estimates may represent another three to five percent of single-family starts based on industry surveys.

The Census data notes an elevated share of single-family homes built as condos (non-fee simple), with this share averaging more than 3% over recent quarters. Some, but certainly not all, of these homes will be used for rental purposes. Additionally, it is theoretically possible some single-family built-for-rent units are being counted in multifamily starts, as a form of “horizontal multifamily,” given these units are often built on a single plat of land. However, spot checks by NAHB with permitting offices indicate no evidence of this data issue occurring.

Nonetheless, demand by investors for single-family rental units, new and existing, has cooled in recent quarters as financial conditions remain tight. This will continue to cool some investor demand for SFBFR housing.

With the onset of the Great Recession and declines for the homeownership rate, the share of built-for-rent homes increased in the years after the recession. While the market share of SFBFR homes is small, it has clearly expanded. Given affordability challenges in the for-sale market, the SFBFR market will likely retain an elevated market share even as the sector cools in the quarters ahead.

Discover more from Eye On Housing

Subscribe to get the latest posts sent to your email.


This article was originally published by a eyeonhousing.org . Read the Original article here. .

High interest rates for construction and development loans as well as ongoing challenges regarding labor shortages and higher prices for many building materials continued to slow the building market this summer.

Overall housing starts decreased 6.8% in July to a seasonally adjusted annual rate of 1.24 million units, according to a report from the U.S. Department of Housing and Urban Development and the U.S. Census Bureau. This is the lowest pace since May 2020.

The July reading of 1.24 million starts is the number of housing units builders would begin if development kept this pace for the next 12 months. Within this overall number, single-family starts decreased 14.1% from an upwardly revised June figure to an 851,000 seasonally adjusted annual rate. However, on a year-to-date basis, single-family starts are up 11.4%.

The multifamily sector, which includes apartment buildings and condos, increased 14.5% to an annualized 387,000 pace.

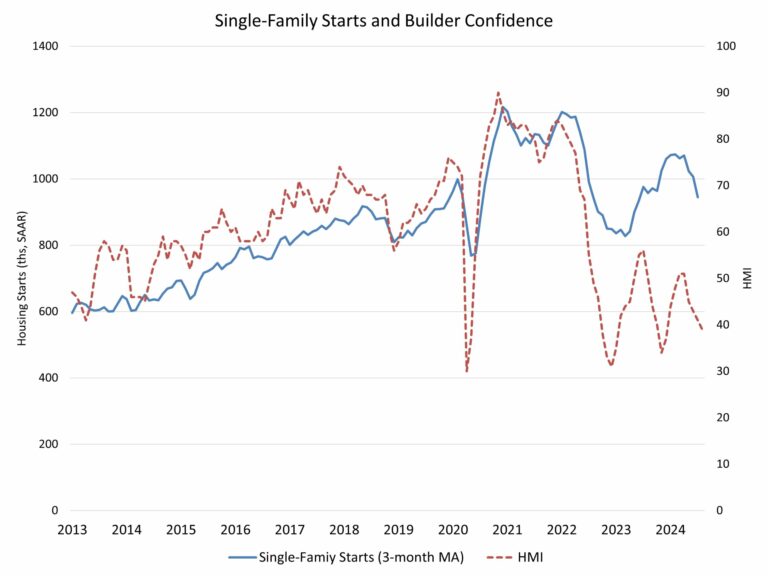
The decline in new home construction mirrors our latest builder surveys (the NAHB/Wells Fargo HMI), which show that buyers remain concerned about challenging affordability conditions and builders are grappling with elevated rates for builder loans, a shortage of workers and lots, and supply chain concerns for some building materials.

Better inflation data points to the Federal Reserve moving to cut interest rates possibly as early as September, and with interest rates expected to moderate in the months ahead, this will help both buyers and builders who are dealing with tight lending conditions.

On a regional and year-to-date basis, combined single-family and multifamily starts are 1.3% lower in the Northeast, 5.1% lower in the Midwest, 5.4% lower in the South and 5.1% lower in the West.

Overall permits decreased 4.0% to a 1.40 million unit annualized rate in July. Single-family permits decreased 0.1% to a 938,000 unit rate. Multifamily permits decreased 11.1% to an annualized 458,000 pace.

Looking at regional data on a year-to-date basis, permits are 1.1% higher in the Northeast, 3.2% higher in the Midwest, 0.3% lower in the South and 4.1% lower in the West.

Single-family homes under construction fell back to a count of 653,000—down 4.1% compared to a year ago. The number of multifamily units under construction fell to an 886,000 count—down 13.2% compared to a year ago. The number of multifamily units under construction is now the lowest since July 2022.

Discover more from Eye On Housing

Subscribe to get the latest posts sent to your email.


This article was originally published by a eyeonhousing.org . Read the Original article here. .

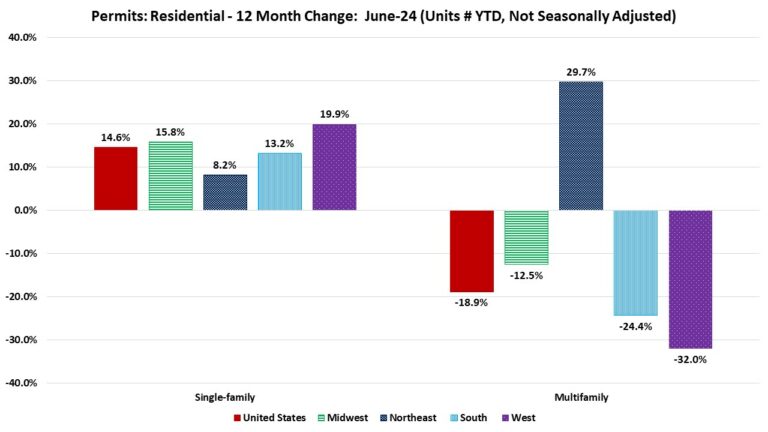
Over the first half of 2024, the total number of single-family permits issued year-to-date (YTD) nationwide reached 514,728. On a year-over-year (YoY) basis, this is an increase of 14.6% over the June 2023 level of 449,226.

Year-to-date ending in June, single-family permits were up in all four regions. The range of permit increases spanned 19.9% in the West to 8.2% in the Northeast. The Midwest was up by 15.8% and the South was up by 13.2% in single-family permits during this time. For multifamily permits, three out of the four regions posted declines. The Northeast, the only region to post an increase, was up by 29.7%. Meanwhile the West posted a decline of 32.0%, the South declined by 24.4%, and the Midwest declined by 12.5%.

Between June 2024 YTD and June 2023 YTD, 47 states posted an increase in single-family permits. The range of increases spanned 44.3% in Arizona to 3.0% in Alaska. Rhode Island (-0.3%), New Hampshire (-1.3%), Hawaii (-6.8%), and the District of Columbia (-9.0%) reported declines in single-family permits.The ten states issuing the highest number of single-family permits combined accounted for 64.2% of the total single-family permits issued. Texas, the state with the highest number of single-family permits, issued 84,920 permits over the first half of 2024, which is an increase of 18.2% compared to the same period last year. The succeeding highest state, Florida, was up by 9.2%, while the third highest, North Carolina, posted an increase of 10.6%.

Year-to-date ending in June, the total number of multifamily permits issued nationwide reached 237,935. This is 18.9% below the June 2023 level of 293,301.

Between June 2024 YTD and June 2023 YTD, 19 states recorded growth in multifamily permits, while 31 states and the District of Columbia recorded a decline. New York (+109.8%) led the way with a sharp rise in multifamily permits from 8,943 to 18,761, while the District of Columbia had the biggest decline of 71.0% from 1,677 to 487. The ten states issuing the highest number of multifamily permits combined accounted for 64.3% of the multifamily permits issued. Over the first half of 2024, Texas, the state with the highest number of multifamily permits issued, experienced a decline of 35.2%. Following closely, the second-highest state in multifamily permits, Florida, saw a decline of 24.1%. California, the third largest multifamily issuing state, decreased by 29.8%.

At the local level, below are the top ten metro areas that issued the highest number of single-family permits.

For multifamily permits, below are the top ten local areas that issued the highest number of permits.

Discover more from Eye On Housing

Subscribe to get the latest posts sent to your email.


This article was originally published by a eyeonhousing.org . Read the Original article here. .
Pin It