Tag

SingleFamily

Browsing


Residential construction activity began 2026 on a mixed note, with single-family permitting weakening significantly while multifamily activity remained relatively stable. Higher borrowing costs and affordability constraints continue to weigh on single-family construction, while multifamily permitting shows signs of resilience despite regional variation.

Over the first month of the year, the number of single-family permits issued nationwide reached 62,034. On a year-over-year basis, this represents a 15.2 percent decline compared with the January 2025 total of 73,115. Multifamily permitting activity was essentially flat, with 38,215 permits issued nationwide, marking a 0.5 percent decline from the same period last year.

Regionally, year-to-date single-family permitting declined in all four regions in January. The Midwest declined by 9.1 percent, the Northeast fell 10.6 percent, the South declined 14.7 percent, and the West dropped 20.1 percent. Multifamily permits increased in three of the four regions, led by gains in the Northeast (up 39.4 percent), followed by the West (up 35.5 percent), and the Midwest (up 10.9 percent). The South saw a decline of 24.2 percent, driven largely by a 42.0 percent decrease in Atlanta-Sandy Springs-Roswell, GA metropolitan areas and a 39.0 percent drop in the Houston-Pasadena-The Woodlands, TX metropolitan area.

At the state level, seven states recorded year-over-year increases in single-family permits in January, with gains ranging from 25.5 percent in Montana to 0.4 percent in Washington. Connecticut reported no change. The remaining 42 states and the District of Columbia reported declines, led by the District of Columbia, which posted the steepest drop at 52.0 percent.

The ten states issuing the highest number of single-family permits accounted for 63.8 percent of all single-family permits issued nationwide. Texas led the country, with 9,580 permits issued at the start of 2026, although this represented a 21.3 percent decline compared with January 2025. Florida, the second-highest state, saw permits fall by 14.9 percent, while North Carolina, ranked third, experienced a decline of 9.8 percent.

Between January 2026 and January 2025, 26 states recorded increases in multifamily building permits, while 24 states and the District of Columbia experienced declines. Delaware posted the largest percentage increase, with multifamily permits surging 1,293.8 percent, rising from 16 to 223 units. In contrast, Wyoming recorded the steepest decline, with permits falling 100.0 percent, from 13 to zero units.

The ten states issuing the highest number of multifamily permits accounted for 63.1 percent of all multifamily permits issued nationwide. Over the first month of 2026, California, which issued the most multifamily permits, recorded a substantial increase of 119.2 percent. Texas, the second-highest state, posted a decline of 24.4 percent, while New York, ranking third, saw multifamily permits rise by 66.7 percent.

At the local level, the following are the ten metropolitan areas with the highest number of single-family permits issued.

Below are the ten metropolitan areas with the highest levels of multifamily permitting activity.


This article was originally published by a eyeonhousing.org . Read the Original article here. .
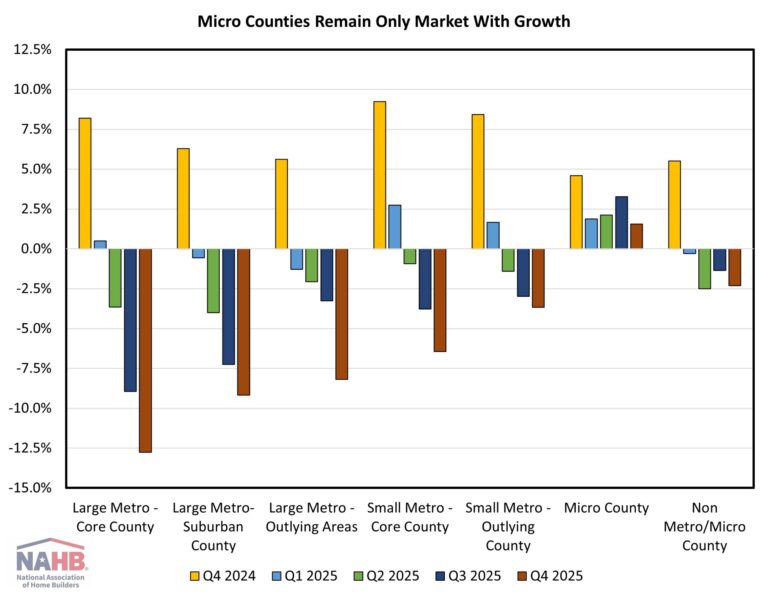

Single-family construction declined further in the fourth quarter in all but sparsely populated micro counties, according to the NAHB Home Building Geography Index (HBGI). Meanwhile, multifamily construction showed growth in all markets for the first time in over two years as it continued to strengthen given the affordability challenges facing for-sale construction. The HBGI tracks single-family and multifamily permits across seven population density delineated geographies in the United States.

Single-Family

Among the HBGI markets, growth in the fourth quarter of 2025 was only registered in micro counties, which increased 1.6% year-over-year on a four-quarter moving average basis (4QMA). This was the seventh consecutive quarter where micro counties showed growth. All other markets reported declines, with the largest occurring in large metro core counties, posting a decline of 12.8%. All markets showed growth one year ago which quickly dissipated as 2025 presented a host of challenges for builders, ranging from the ongoing affordability crisis to economic uncertainty.

In terms of market share, single-family construction’s largest geography remained small metro core county areas, representing 29.4%.. The smallest single-family construction market remained non metro/micro county areas, with a 4.5% market share. The largest decline in market share over 2025 was in large metro core counties, falling one percentage point to 15.1%. The largest gain over the year was in small metro outlying counties as the market share rose from 10.0% to 10.5%.

Multifamily

Matching single-family, the largest gains for multifamily construction occurred in micro counties, growing 14.0% (4QMA) in the fourth quarter. This was followed by small metro outlying counties which grew 11.6%. The lowest growth was in large metro outlying counties at 1.9%. This quarter marks the first time that all markets showed growth since the first quarter of 2023.

In terms of market share, large metro core counties held the largest at 35.1%. The market share for large metro core counties rose significantly over the course of 2025, as it was 33.3% in the first quarter. The area that lost the most market share over the year was large metro outlying counties, falling from 4.7% to 3.7% in the fourth quarter.

The fourth quarter of 2025 HBGI data along with an interactive HBGI map can be found at https://nahb.org/hbgi.


This article was originally published by a eyeonhousing.org . Read the Original article here. .


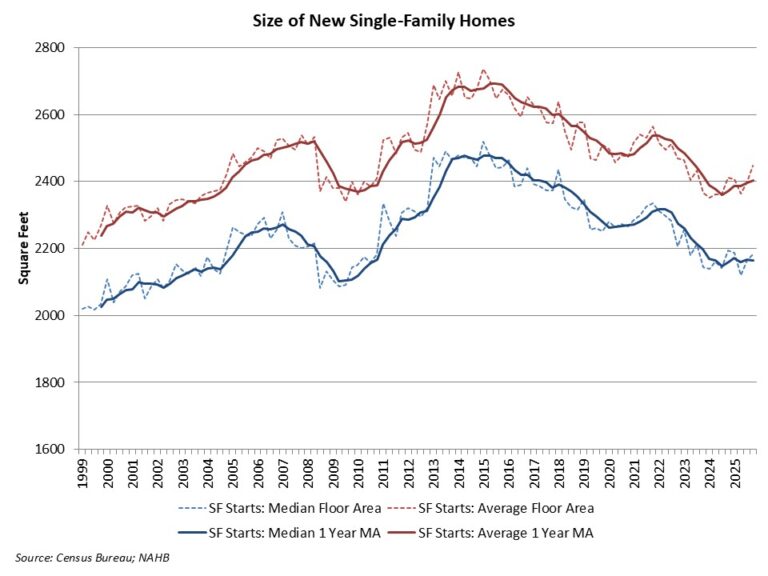
New single-family home size had been falling since 2015 in response to declining affordability conditions. An exception occurred in 2021, when new home size increased as interest rates reached historic lows. However, as mortgage interest rates increased in 2022 and 2023 and affordability worsened, demand shifted back toward smaller homes.

More recent data suggest these trends have stabilized amid modest affordability improvements. According to fourth quarter 2025 data from the Census Quarterly Starts and Completions by Purpose and Design and NAHB analysis, median single-family square floor area was 2,183 square feet, effectively unchanged from the start of the year. Average (mean) square footage for new single-family homes registered at 2,447 square feet, a small increase.

On a one-year moving average basis, the average size of a new single-family home was essentially unchanged at 2,404 square feet, while the median size remained stable at 2,163 square feet.

Home size trends in 2026 are likely to remain relatively flat, reflecting crosswinds from housing affordability constraints and elevated construction costs.


This article was originally published by a eyeonhousing.org . Read the Original article here. .


Single-family built-for-rent (or built-to-rent, BTR) construction fell back in the fourth quarter of 2025, as a higher cost of financing and increased multifamily supply crowded out development.

Housing legislation now under final consideration in Congress would also weaken the sector. The legislation, as approved by the Senate, would require institutionally financed new-construction single-family rental housing to be sold to individual home buyers within seven years. This requirement would decrease investable capital and lower housing supply. A preliminary NAHB estimate indicates the proposed rule places approximately 40,000 units per year at-risk.

According to NAHB’s analysis of data from the Census Bureau’s Quarterly Starts and Completions by Purpose and Design, there were approximately 15,000 single-family built-for-rent (SFBFR) starts during the fourth quarter of 2025. This is down slightly from the fourth quarter of 2024 (16,000 starts).

Over the course of 2025, 68,000 such homes began construction, which is a 19% decrease compared to the 84,000 estimated SFBFR starts in 2024.

The SFBFR market is a source of inventory amid challenges regarding housing affordability and down payment requirements in the for-sale market, particularly during a period when a growing number of people want more space and a single-family structure. Single-family built-for-rent construction differs in structural characteristics compared to other newly-built single-family homes, particularly with respect to home size. However, investor demand for single-family homes, both existing and new, has cooled with higher interest rates.

Given the relatively small size of this market segment, the quarter-to-quarter movements typically are not statistically significant. The current four-quarter moving average of market share (7%) is nonetheless higher than the historical average of 2.7% (1992-2012).

Importantly, as measured for this analysis, the estimates noted above include only homes built and held by the builder for rental purposes. The estimates exclude homes that are sold to another party for rental purposes, which NAHB estimates may represent another three to five percent of single-family starts based on industry surveys.

The Census data note an elevated share of single-family homes built as condos (non-fee simple), with this share averaging about 4% over recent quarters. Some, but certainly not all, of these homes will be used for rental purposes. Additionally, it is theoretically possible that some single-family built-for-rent units are being counted in multifamily starts, as a form of “horizontal multifamily,” given that these units are often built on a single plat of land. However, spot checks by NAHB with permitting offices indicate no evidence of this data issue occurring (the condo element identifies another difficulty with respect to the 7-year sale requirement of the proposed legislation in Congress).

With the onset of the Great Recession and declines in the homeownership rate, the share of built-for-rent homes increased in the years after the recession. While the market share of SFBFR homes is small, it has clearly expanded. Given affordability challenges in the for-sale market, the SFBFR market will likely retain an elevated market share. However, in the near term, SFBFR construction is likely to slow given market and policy headwinds.


This article was originally published by a eyeonhousing.org . Read the Original article here. .


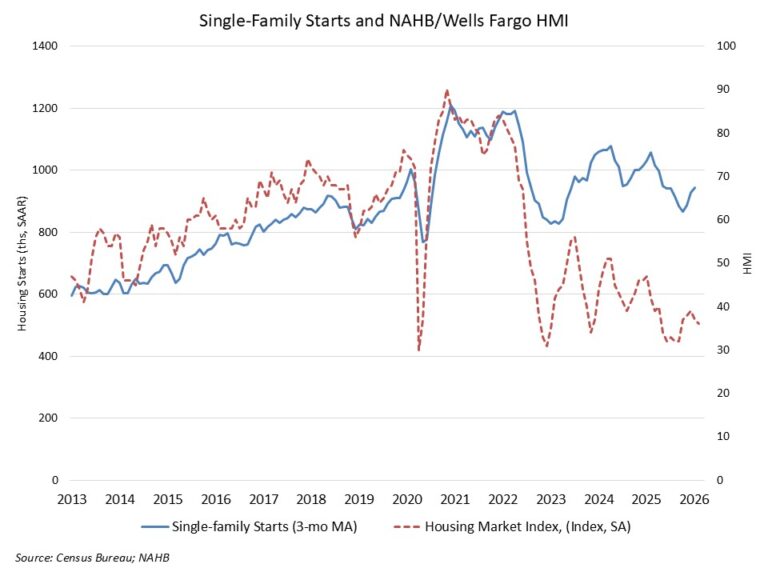
Elevated construction costs and constrained affordability conditions led to a reduction in single-family housing starts in January.

However, led by solid multifamily production, overall housing starts increased 7.2% in January to a seasonally adjusted annual rate of 1.49 million units, according to a report from the U.S. Department of Housing and Urban Development and the U.S. Census Bureau.

The January reading of 1.49 million starts is the number of housing units builders would begin if development kept this pace for the next 12 months.

Within this overall number, single-family starts decreased 2.8% to a 935,000 seasonally adjusted annual rate. Weather effects also likely depressed single-family construction in the Northeast, where single-family starts were down 33% from December 2025 and down more than 6% compared to January 2025 readings.

The multifamily sector, which includes apartment buildings and condos, increased 30% to an annualized 552,000 pace. However, this data may be revised lower in future revisions. Furthermore, prior NAHB analysis of the geography of permit data has shown recent gains for apartment construction occurring in lower density areas, such as exurbs, secondary cities and small towns.

On a regional basis compared to the previous month, combined single-family and multifamily starts were 47.4% higher in the Northeast, 10.8% lower in the Midwest, 11.4% higher in the South and 7.5% lower in the West.

Overall permits decreased 5.4% to a 1.38 million unit annualized rate in January. Single-family permits decreased 0.9% to an 873,000-unit rate, which is the weakest reading since August of last year. This is an indicator of relatively flat construction starts conditions for 2026 amid the ongoing affordability crisis. Multifamily permits decreased 12% to an annualized 503,000 pace.

Looking at regional permit data compared to the previous month, permits were 9.6% lower in the Northeast, 9% higher in the Midwest, 3.5% lower in the South and 15.7% in the West.

The number of single-family homes under construction fell back to 582,000 in January, down 8.8% year over year as the single-family home building market has slowed. Despite recent gains for apartment construction, the number of apartments under construction has fallen back to 686,000 units, a 10% decline from January 2025.

The multiyear trend of a smaller number of units under construction is consistent with builders pulling back construction given higher post-covid construction costs and affordability constraints.


This article was originally published by a eyeonhousing.org . Read the Original article here. .


Single-family permitting softened over the course of 2025 and finished the year weaker than the prior year. After showing some resilience in 2024, permitting activity gradually lost momentum as elevated mortgage rates and ongoing affordability constraints weighed on buyer demand. By year’s end, the pace of single-family permit issuance was below the level recorded in 2024, signaling a pullback in new construction. Multifamily permitting followed a more uneven path during 2025, reflecting the sector’s typical volatility, but ended the year on a stronger footing.

Over the year, the number of single-family permits issued nationwide reached 909,280. On a year-over-year basis, this represents a 7.4 percent decline compared with the December 2024 year-to-date total of 981,834. Multifamily permitting activity was stronger, with 516,886 permits issued nationwide, marking a 5.6 percent increase from the same period last year.

Regionally, year-to-date single-family permitting increased in only one of the four regions through December. The Midwest posted a slight gain of 0.3 percent, while activity declined in the Northeast (down 1.9 percent), the South (down 8.5 percent), and the West (down 10.4 percent). Multifamily permits increased in three of the four regions, led by gains in the West (up 17.6 percent), followed by the Midwest (up 9.8 percent), and then the South (up 4.9 percent). The Northeast saw a sharp decline of 12.4 percent, driven largely by a 21.0 percent drop in the New York–Newark–Jersey City metropolitan area.

At the state level, 16 states recorded year-over-year increases in single-family permits between December 2025 year-to-date and December 2024 year-to-date, with gains ranging from 24.0 percent in the District of Columbia to 0.1 percent in New York. The remaining 34 states reported declines, led by Nevada, which posted the steepest drop at 21.3 percent.

The ten states issuing the highest number of single-family permits accounted for 61.8 percent of all single-family permits issued nationwide. Texas continued to lead the country, with 140,002 permits issued over 2025, although this represented an 11.7 percent decline compared with 2024. Florida, the second-highest state, saw permits fall by 10.3 percent, while North Carolina, ranked third, experienced a decline of 6.9 percent.

Between December 2025 year-to-date and December 2024 year-to-date, 31 states recorded increases in multifamily building permits, while 19 states and the District of Columbia experienced declines. Mississippi posted the largest percentage increase, with multifamily permits surging 195.8 percent, rising from 357 to 1,056 units. In contrast, Maryland recorded the steepest decline, with permits falling 32.7 percent, from 5,797 to 3,902 units.

The ten states issuing the highest number of multifamily permits accounted for 60.5 percent of all multifamily permits issued nationwide. Over the course of 2025, Texas, which issued the most multifamily permits, recorded a modest increase of 1.7 percent. Florida, the second-highest state, posted a stronger gain of 29.6 percent, while California, ranking third, saw multifamily permits rise by 21.6 percent.

At the local level, the following are the ten metropolitan areas with the highest number of single-family permits issued.

Below are the ten metropolitan areas with the highest levels of multifamily permitting activity.


This article was originally published by a eyeonhousing.org . Read the Original article here. .

In October, single-family building permits weakened, reflecting continued caution among builders amid affordability constraints and financing challenges. In contrast, multifamily permit activity remained steady and continued to perform relatively well. Together, these trends suggest that while demand for new housing persists, builders are adjusting residential construction activity in response to evolving market conditions. Because permits typically precede construction starts, these patterns offer insight into the near-term outlook for residential building activity.

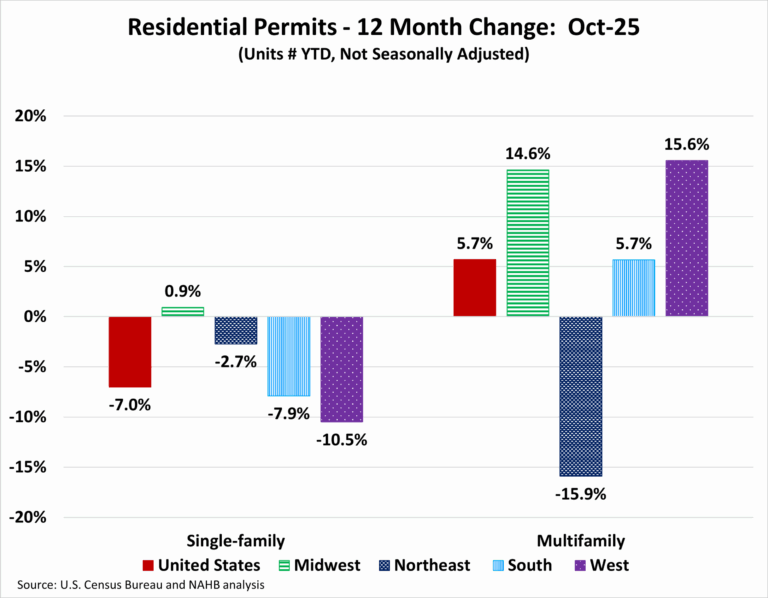
Over the first ten months of 2025, the number of single-family permits issued nationwide reached 787,122. On a year-over-year basis, this represents a 7.0 percent decline compared with the October 2024 year-to-date total of 846,446. Multifamily permitting activity was stronger, with 426,352 permits issued nationwide, marking a 5.7 percent increase from the same period last year.

Regionally, year-to-date single-family permitting increased in only one of the four regions through October. The Midwest posted a modest gain of 0.9 percent, while activity declined in the Northeast (down 2.7 percent), the South (down 7.9 percent), and the West (down 10.5 percent). Multifamily permits increased in three of the four regions, led by gains in the West (up 15.6 percent), followed by the Midwest (up 14.6 percent), and then the South (up 5.7 percent). The Northeast saw a sharp decline of 15.9 percent, driven largely by a 28.0 percent drop in the New York–Newark–Jersey City metropolitan area.

At the state level, 15 states recorded year-over-year increases in single-family permits between October 2025 year-to-date and October 2024 year-to-date, with gains ranging from 12.6 percent in New Hampshire to 0.8 percent in West Virginia. The remaining 35 states and the District of Columbia reported declines, led by Nevada, which posted the steepest drop at 22.4 percent.

The ten states issuing the highest number of single-family permits accounted for 62.0 percent of all single-family permits issued nationwide. Texas continued to lead the country, with 122,293 permits issued over the first ten months of 2025, although this represented a 10.3 percent decline compared with the same period last year. Florida, the second-highest state, saw permits fall by 9.8 percent, while North Carolina, ranked third, experienced a decline of 5.8 percent.

Between October 2025 year-to-date and October 2024 year-to-date, 29 states and the District of Columbia recorded increases in multifamily building permits, while 21 states experienced declines. Mississippi posted the largest percentage increase, with multifamily permits surging 142.6 percent, rising from 289 to 701 units. In contrast, Maryland recorded the steepest decline, with permits falling 44.5 percent, from 5,265 to 2,922 units.

The ten states issuing the highest number of multifamily permits accounted for 60.2 percent of all multifamily permits issued nationwide. Over the first ten months of 2025, Texas, which issued the most multifamily permits, recorded a modest increase of 2.9 percent. Florida, the second-highest state, posted a stronger gain of 27.8 percent, while California, ranking third, saw multifamily permits rise by 19.8 percent.

At the local level, the following are the ten metropolitan areas with the highest number of single-family permits issued.

Below are the ten local areas with the highest levels of multifamily permitting activity.


This article was originally published by a eyeonhousing.org . Read the Original article here. .
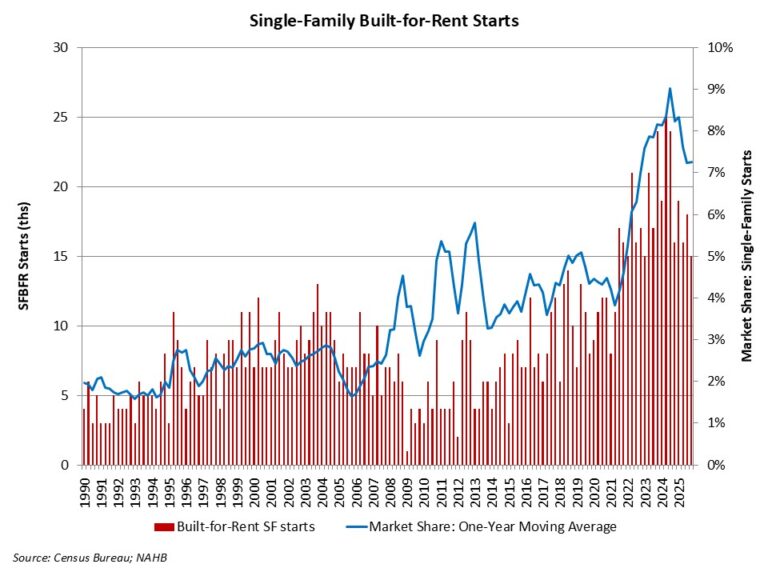

Single-family built-for-rent construction fell back in the third quarter of 2025, as a higher cost of financing and increased multifamily supply crowded out development.

According to NAHB’s analysis of data from the Census Bureau’s Quarterly Starts and Completions by Purpose and Design, there were approximately 18,000 single-family built-for-rent (SFBFR) starts during the third quarter of 2025. This is down significantly relative to the third quarter of 2024 (24,000 starts). Over the last four quarters, 69,000 such homes began construction, which is a 25% decrease compared to the 92,000 estimated SFBFR starts in the four quarters prior to that period.

The SFBFR market is a source of inventory amid challenges over housing affordability and downpayment requirements in the for-sale market, particularly during a period when a growing number of people want more space and a single-family structure. Single-family built-for-rent construction differs in terms of structural characteristics compared to other newly-built single-family homes, particularly with respect to home size. However, investor demand for single-family homes, both existing and new, has cooled with higher interest rates.

Given the relatively small size of this market segment, the quarter-to-quarter movements typically are not statistically significant. The current four-quarter moving average of market share (7%) is nonetheless higher than the historical average of 2.7% (1992-2012).

Importantly, as measured for this analysis, the estimates noted above include only homes built and held by the builder for rental purposes. The estimates exclude homes that are sold to another party for rental purposes, which NAHB estimates may represent another three to five percent of single-family starts based on industry surveys.

The Census data notes an elevated share of single-family homes built as condos (non-fee simple), with this share averaging more than 4% over recent quarters. Some, but certainly not all, of these homes will be used for rental purposes. Additionally, it is theoretically possible some single-family built-for-rent units are being counted in multifamily starts, as a form of “horizontal multifamily,” given these units are often built on a single plat of land. However, spot checks by NAHB with permitting offices indicate no evidence of this data issue occurring.

With the onset of the Great Recession and declines for the homeownership rate, the share of built-for-rent homes increased in the years after the recession. While the market share of SFBFR homes is small, it has clearly expanded. Given affordability challenges in the for-sale market, the SFBFR market will likely retain an elevated market share. However, in the near-term, SFBFR construction is likely to slow until the return on new deals improves.


This article was originally published by a eyeonhousing.org . Read the Original article here. .

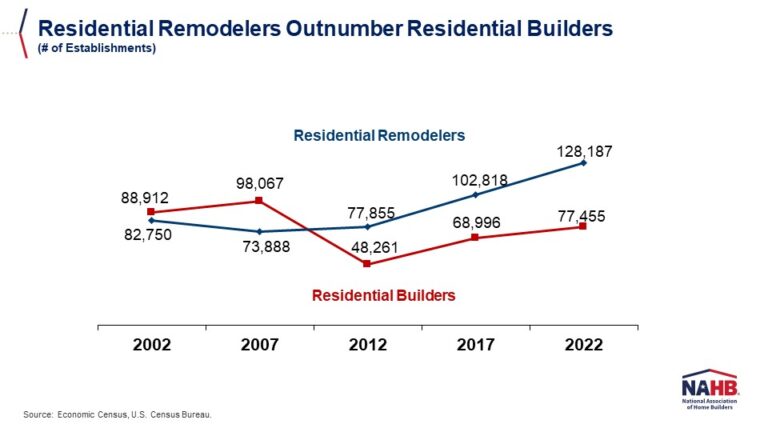
The number of residential remodelers in the U.S. has reached a record high of 128,187 establishments, 65% higher than the number of residential builders (single-family and multifamily), which stands at 77,455.  These official government counts were released by the U.S. Census Bureau as part of its 2022 Economic Census, which tallies American businesses every five years (in years ending in 2 and 7).

Growth in the number of remodelers significantly outpaced that of builders between 2017 and 2022. In that 5-year span, the remodeler count increased by 25% (102,818 to 128,187), while the number of builders grew at half that pace–by 12% (68,996 to 77,455).

A starker dichotomy emerges when comparing 2022 counts to those in 2007, prior to the financial crisis and the ensuing housing recession.  In that 15-year period, the official number of residential remodelers in the U.S. grew by 73% (73,888 to 128,187), while the official number of residential builders contracted by 21% (98,067 to 77,455).

Another way to analyze this data is by creating a combined universe of both builders and remodelers and then calculating each group’s share of the total. In 2022, for example, remodelers represented 62% of the total number of builders and remodelers in the U.S, while builders made up a minority share of 38%.  Remodelers have accounted for at least 60% of this total in the last three Economic Census (2012, 2017, and 2022). 

The last time builders comprised a majority share was in 2007, when they represented 57% of the combined total number of builders and remodelers in the country.


This article was originally published by a eyeonhousing.org . Read the Original article here. .


Single-family homes started in 2024 typically had two full bathrooms, according to the U.S. Census Bureau’s Annual Survey of Construction. Homes with three full bathrooms continued to have the second largest share of starts at around 23%. Meanwhile, both homes with four full bathrooms or more and homes with one bathroom or less made up under ten percent of homes started.

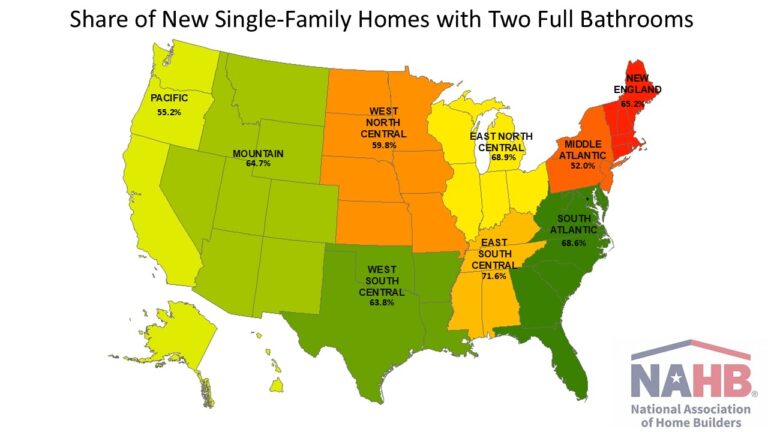
A full bathroom, as defined by the Bureau, is one that has a washbasin, a toilet and either a bathtub or shower, or a combination of a bathtub and shower. In 2024, 65.0% of new single-family homes started in 2024 had two full bathrooms, marking  the second consecutive year that this share has increased.  The share of single-family starts with three full bathrooms fell for the third straight year, down to 23.3%, while the share of single-family starts with four or more bathrooms increased to 7.2%. For starts with one full bathroom or less, the share fell to 4.5%.

Across the U.S., the East South Central division had the highest share, 71.6%, of new single-family starts having two full bathrooms. No other division had above a 70% share. The Census division with the lowest share was the Middle Atlantic, with 52.0% of new single-family starts reporting two full bathrooms. Starts in Middle Atlantic division were far more likely to have 4 full bathrooms or more, at 20.2%, more than double any other division in terms of share.

Half-Bathrooms

Most new single-family homes started in 2024 had no half-bathrooms at 53.7%. Following closely is the share of new single-family homes with one half-bathroom at 44.9%. New single-family starts with two or more half-bathrooms had a small share of 1.4% in 2024.  A half bathroom contains a toilet, bathtub, or shower, but not all facilities to be classified as a full bathroom.

Half-bathrooms are historically more prevalent in the New England Census division as compared to the other eight divisions. In 2024, 64.0% of new single-family homes started in the New England division had at least one half-bathroom. The lowest share occurred in the Pacific division, where only 38.3% of starts had at least one half-bathroom.


This article was originally published by a eyeonhousing.org . Read the Original article here. .
Pin It