Tag

single-family

Browsing


NAHB published research earlier this year on home buyer preferences called What Home Buyers Really Want. Consumers were asked to rate how 19 technology features would influence their home purchase decision, if at all, using the following four-point scale:

Do not want – not likely to buy a home with this design or feature.

Indifferent – wouldn’t influence decision.

Desirable – would be seriously influenced to purchase a home because this design or feature was included.

Essential/Must have – unlikely to purchase a home without this design or feature

Seventy-eight percent of home buyers rated a programmable thermostat as either essential/must have or desirable, followed by security cameras (76%), video doorbell (74%), and wireless home security system (70%).  Sixteen of the 19 technology features had at least 50% of home buyers rating them as essential or desirable.

The top eight features reveal that home buyers are looking for technology that helps them achieve two main goals:

Improve Energy Efficiency (programmable thermostat, multi-zone HVAC system, lighting control system, energy management system/display) AND

Increase Safety (security cameras, video doorbell, wireless & wired home security system)

Additionally, like the other areas of the home covered in the study, every question on technology features is tabulated by the buyer’s income, age, geography, race, household type, and the price they expect to pay for the home. These details can be very useful in particular cases. For example, the study discusses the five technology features that have the largest preference margins between the youngest and oldest buyers along with analyzing the prevalence of virtual tours by income and price point. 

Discover more from Eye On Housing

Subscribe to get the latest posts sent to your email.


This article was originally published by a eyeonhousing.org . Read the Original article here. .
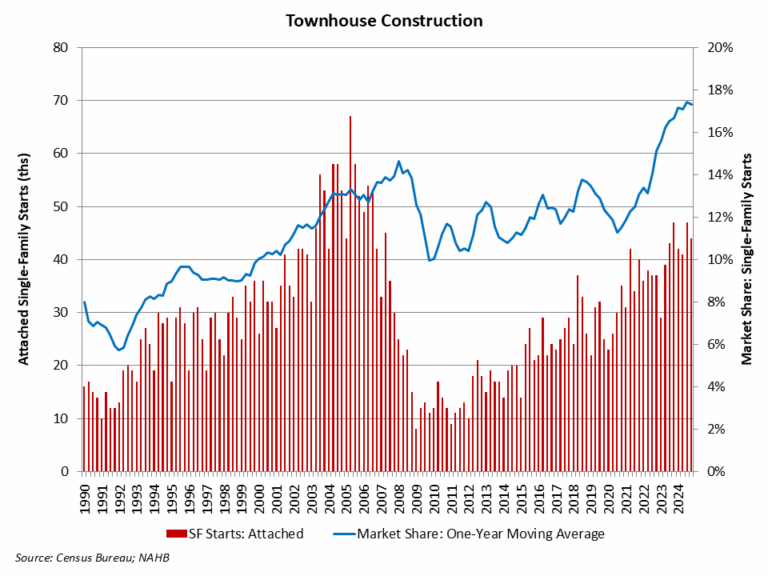

In 2023, 66% of newly completed single-family homes featured two-car garages, according to NAHB’s analysis of the Census’s Survey of Construction data. This was the most common parking option across all Census divisions.

By Census division, South Atlantic had the highest share of two-car garages at 72%. Three or more car garages were most popular in the West North Central division (38%), while one-car garages were most frequent in the Middle Atlantic division (22%).”Other” parking options, including carports and off-street parking, were most common in the East South Central division (17%).

Nationwide, the share of new homes with three or more car garages was 17% in 2023. Three or more car garages have been trending downward since the peak of 24% in 2015, decreasing 2% from 2022.  One-car garages were present in 8% of new homes, another 2% possessed a carport, and 8% did not have any garage or carport.

As home size increased, the share of homes with one-car garages or “other” parking options decreased. For homes under 1,200 square feet, “other” parking options were most common (72%). As home sizes go over 5,000 square feet, this share drops to just 2%. One-car garages were most common in homes between 1,200 and 1,599 square feet (18%), while only 1% of homes over 5,000 square feet had this feature.

Two-car garages were most prevalent in homes between 1,600 and 1,999 square feet (72%), with the largest share at 81% for homes between 2,000 and 2,399 square feet. For homes between 2,400-2,999 square feet, the two-car garage share fell to 77%. Two-car garages were also the most popular options for homes 3,000-4,999 square feet as well with a smaller share at 58%. Three-car garages were rare in smaller homes (3% for those under 1,200 square feet) but became the most common option (65%) for homes over 5,000 square feet.

Discover more from Eye On Housing

Subscribe to get the latest posts sent to your email.


This article was originally published by a eyeonhousing.org . Read the Original article here. .

The latest NAHB study on home buyer preferences – What Home Buyers Really Want Study – asked consumers about the features and amenities they would want in a home, specifically regarding windows and exterior doors.  Respondents were asked to rate eight window and four exterior door features using the following four-point scale:

Do not want – not likely to buy a home with this design or feature.

Indifferent – wouldn’t influence decision.

Desirable – would be seriously influenced to purchase a home because this design or feature was included.

Essential/Must have – unlikely to purchase a home without this design or feature.

Windows

ENERGY STAR rated windows were rated essential or desirable by 83% of home buyers, followed by triple-pane insulating glass (77%) and low e-insulating glass (67%).  Since its introduction to the survey in 2007, ENERGY STAR rated windows have been wanted by at least 83% of home buyers (Figure 1).  Additionally, ENERGY STAR windows were ranked the third most wanted feature out of the 200+ options asked within the survey.

Doors

All four exterior door features were rated essential or desirable by a majority of home buyers (>50%) with very little separating the highest (sliding patio doors at 64%) to the lowest (double main entry door at 58%) rated options.  Furthermore, all four exterior door features have increased in popularity compared to 2020, with double main entry door rising the most (10 percentage points) (Figure 2). 

Additionally, like the other areas of the home covered in the study, every question on windows and doors is tabulated by the buyer’s income, age, geography, race, household type, and the price they expect to pay for the home.  These details can be very useful in particular cases.  For example, the study discusses the three window features that appeal to older buyers, as well as how preferences for hinged/French patio doors change by income level and home price. 

Discover more from Eye On Housing

Subscribe to get the latest posts sent to your email.


This article was originally published by a eyeonhousing.org . Read the Original article here. .

Porches continue to rank as the most common outdoor feature on new homes, according to NAHB tabulation of the latest data from the Survey of Construction (SOC, conducted by the U.S. Census Bureau with partial funding from HUD). Of the roughly 950,000 single-family homes started in 2023, the SOC data show that 67.7% were built with porches. This is four full percentage points higher than the 63.7% reported for patios, and marks the first time the share of new homes with porches has surpassed two-thirds since the re-design of the SOC in 2005.

Traditionally, porches on new homes have been most common in the four states that make up the East South Central Census division. That was true again in 2023, although by the narrowest of margins. While 81% of new homes in the East South Central had porches in 2023, that was only a single percentage point higher than the 80% recorded in the Pacific Division. The share was also over 70% in four other divisions: the Mountain (77%), South Atlantic (74%), East North Central (73%) and New England (72%). Once again, the division with the smallest share of poches on new homes was the West South Central (42%). After some significant changes between 2021 and 2022, the 2023 divisional percentages were not drastically different from the ones reported for 2022 in last year’s post.

Detail about the characteristics of porches on new homes is available from the Builder Practices Survey (BPS), conducted annually by Home Innovation Research Labs. Among other things, the 2024 BPS report (based on homes built in 2023) shows that porches continue to be most common on the front of new single-family homes, rather than on the side or rear. When on the front, porches average approximately 100 square feet of floor area, compared to 140 square feet for a side or rear porch, and 200 square feet for a screened-in porch.

On a square foot basis, builders continue to use concrete more than any other material in new-home porches—except in New England, where composite (a blend of usually recycled wood fibers and plastic) is most common, and treated wood, PVC or other plastics, cedar, and natural stone are each used more than concrete.

Discover more from Eye On Housing

Subscribe to get the latest posts sent to your email.


This article was originally published by a eyeonhousing.org . Read the Original article here. .

Expectations of the Federal Reserve beginning the first in a series of rate reductions kept potential home buyers in a holding pattern in August.

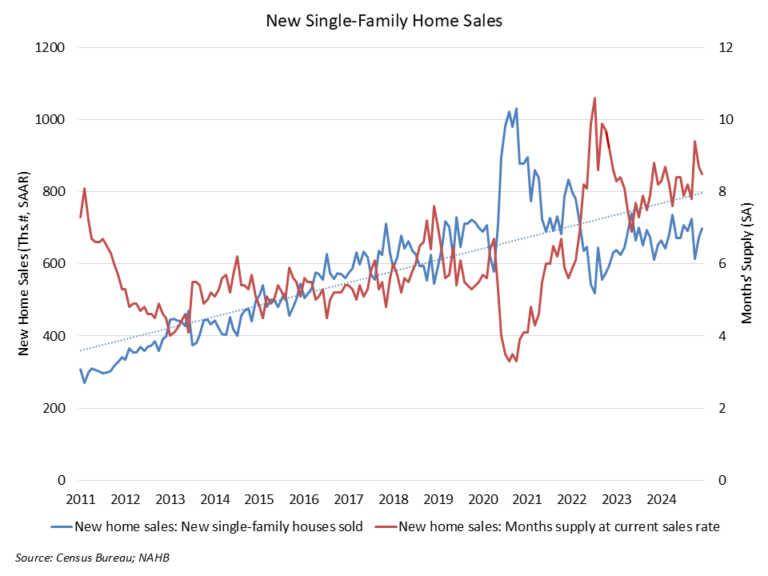
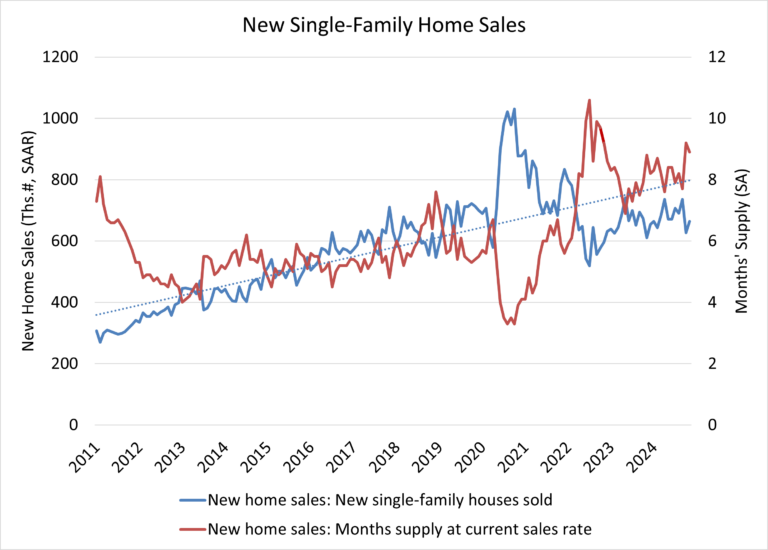
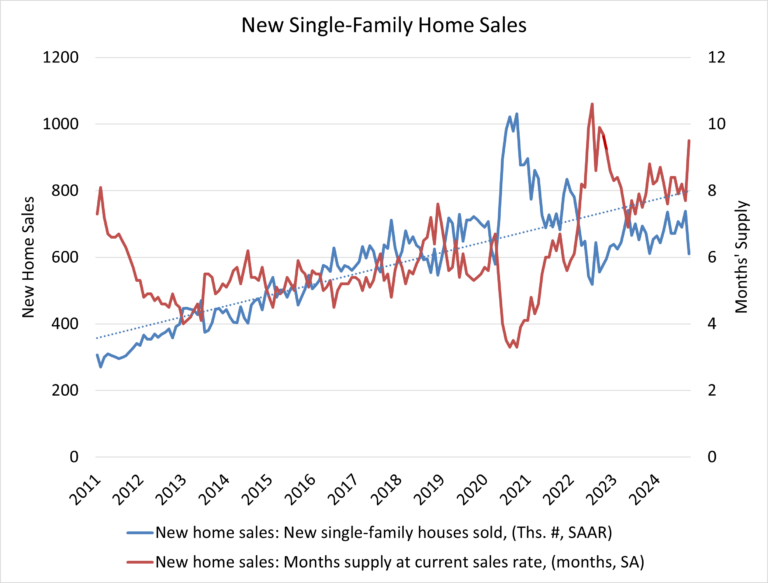
Sales of newly built, single-family homes in August fell 4.7% after an unusually strong July, according to newly released data from the U.S. Department of Housing and Urban Development and the U.S. Census Bureau.  August new home sales registered a 716,000 seasonally adjusted annual rate, after an upwardly revised estimate of 751,000 for July.

Despite the slip in August, the three-month moving average for new home sales is at its highest level since March of 2022. New home sales are up 4% on a year-to-date basis through August.

Builder sentiment and future sales expectations are improving as the Federal Reserve begins a credit easing cycle. However, due to the mortgage interest lock-in effect, declining interest rates will mean rising existing home inventories and some additional new competition for home builders.

While a 7.8 months’ supply may be considered elevated in normal market conditions, there is currently only a 4.1 months’ supply of existing single-family homes on the market. Combined, new and existing total months’ supply remains below historic norms at approximately 4.7, although this measure is expected to increase as more home sellers test the market in the months ahead.

A new home sale occurs when a sales contract is signed, or a deposit is accepted. The home can be in any stage of construction: not yet started, under construction or completed. In addition to adjusting for seasonal effects, the August reading of 716,000 units is the number of homes that would sell if this pace continued for the next 12 months.

New single-family home inventory increased 1.7% to 467,000 in August, a 7.8 months’ supply at the current sales pace.  Completed, ready to occupy inventory increased to 105,000 homes, which is the highest level since 2009. However, this share makes up only 22% of new home inventory.

Median new home price fell back to $420,600, down 4.6% from a year ago due to builder price incentives amid multidecade highs for housing affordability challenges. The Census data reveals a gain for new home sales priced below $300,000, which made up 18% of new home sales in August compared to 12% a year ago.

Regionally, on a year-to-date basis, new home sales are up in all four regions, rising 2.1% in the Northeast, 21.9% in the Midwest, 0.8% in the South and 4.7% in the West.

Discover more from Eye On Housing

Subscribe to get the latest posts sent to your email.


This article was originally published by a eyeonhousing.org . Read the Original article here. .

In 2023, the most common number of bedrooms in newly-built single-family homes continued to be three at a 45.7% share.  This share is up almost three percentage points from 42.8% in 2022. The second highest share was single-family homes with four bedrooms at 33.1%, followed by homes with two bedrooms or less at 11.5% and then homes with five or more bedrooms at 9.7%.

As shown above, the share of single-family homes started with three bedrooms rose to its highest level since 2019. While this share rose, the second most frequently built number of bedrooms (four) fell to 33.1%, the lowest share for such homes since 2012. At the same time, the share of new single-family homes with 2 bedrooms or less reached its highest level since 2012. The share of homes with five bedrooms or more has remained fairly stagnant at around 10% over the past ten years.

Regions

Across U.S. Census divisions, the share of new single-family homes with four or more bedrooms features distinct variations. The share ranged from a low of 22.0% in the New England division to the highest share of 47.9% in the West South Central division. Coinciding with the fall in the share of new single-family homes with 4 bedrooms or more nationally, there are no divisions that have a share above 50%. In 2022, the data featured the South Atlantic (51.7%), Pacific (51.4%) and West South Central (50.6%) all with above 50% shares.

Purpose of Construction

The number of bedrooms in the home greatly varied in 2023 depending on a new single-family home’s purpose of construction (built-for-sale, contractor-built, owner-built, built-for-rent). Most of this variation comes from the two-bedroom or less homes and four-bedrooms homes. For example, the share of new single-family homes with two bedrooms or less ranges from 5.7% of homes built-for-sale to 38.4% of homes built-for-rent. Meanwhile, three-bedroom homes and five or more bedroom homes display relatively little change across purpose of construction, as shown in the chart below.   

Discover more from Eye On Housing

Subscribe to get the latest posts sent to your email.


This article was originally published by a eyeonhousing.org . Read the Original article here. .

Owners’ equity share of household real estate assets remained above 70% for the tenth straight quarter, continuing to mark the highest levels of this share since the late 1950s. The share in the second quarter of 2024 was 72.7%, up from a year ago when it stood at 71.4%. Notably, this is the highest reading of owners’ equity share since the fourth quarter of 1958, when it was 73.3%.

Household real estate assets represent all types of owner-occupied housing including farm houses and mobile homes, as well as second homes that are not rented, vacant homes for sale, and vacant land at current market value. Household real estate liabilities represent all outstanding residential mortgages as well as loans made under home equity lines of credit and home equity loans secured by junior liens. Owners’ equity is the difference between the current market value of the household’s property and the existing debt secured by the property (assets – liabilities).

The market value of household real estate assets rose from $46.4 trillion to $48.2 trillion in the second quarter of 2024 according to the most recent release of U.S. Federal Reserve Z.1 Financial Accounts. Over the year, household real estate assets were 7.7% higher in the second quarter following a 9.2% increase in the first quarter.

Household real estate secured liabilities, i.e. mortgages, home equity loans, and HELOCs, increased 0.8% over the second quarter to $13.1 trillion. This level is 2.6% higher than the second quarter of 2023, the same as the increase in the first quarter of 2.6%.

Discover more from Eye On Housing

Subscribe to get the latest posts sent to your email.


This article was originally published by a eyeonhousing.org . Read the Original article here. .

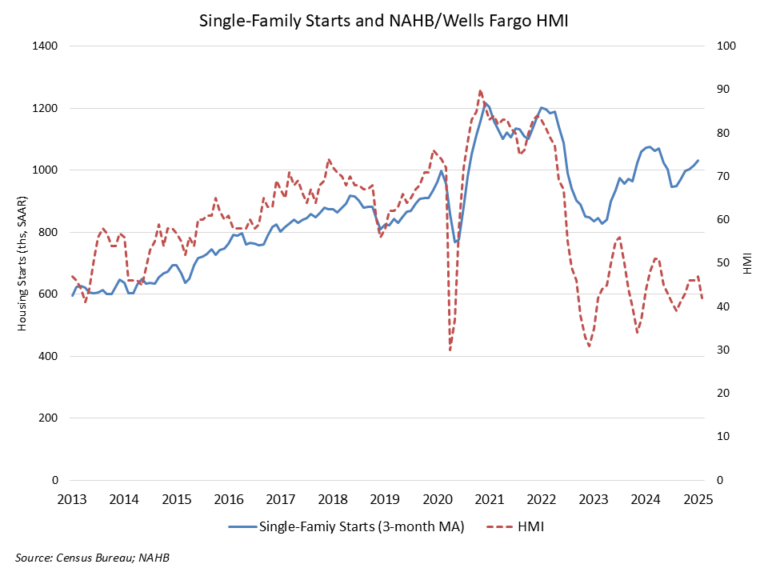
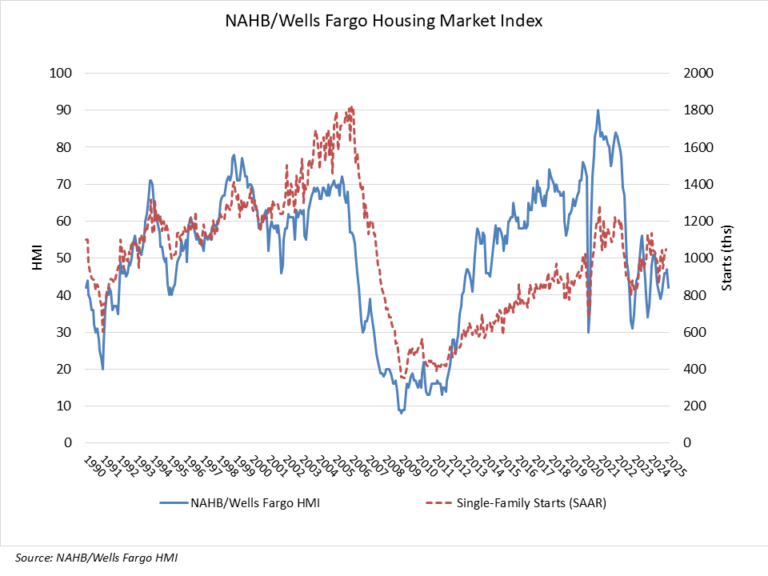
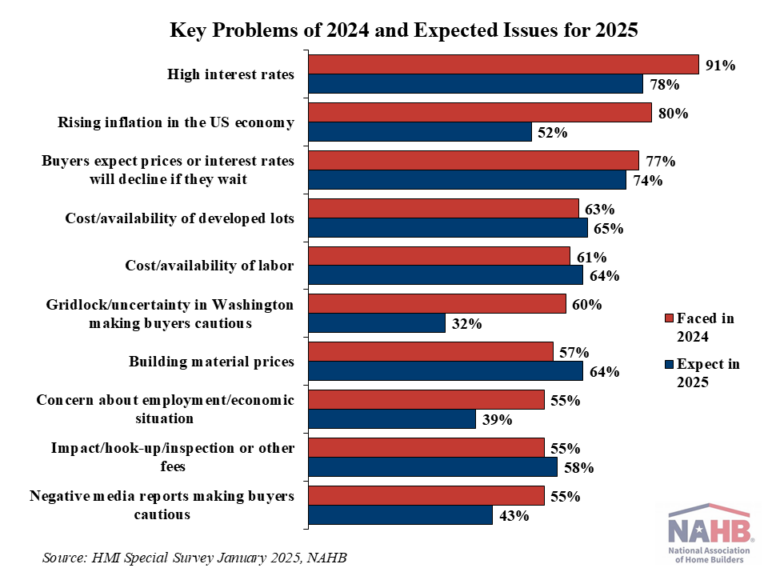
Single-family starts posted a solid gain in August on robust demand and moderating mortgage rates even as builders continue to grapple with challenges related to lot and labor shortages and elevated prices for many building materials.

Overall housing starts increased 9.6% in August to a seasonally adjusted annual rate of 1.36 million units, according to a report from the U.S. Department of Housing and Urban Development and the U.S. Census Bureau.

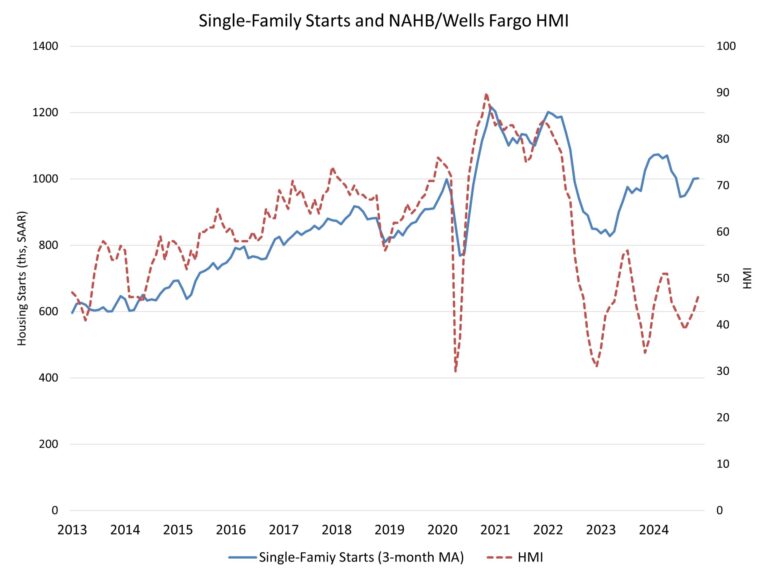
The August reading of 1.36 million starts is the number of housing units builders would begin if development kept this pace for the next 12 months. Within this overall number, single-family starts increased 15.8% to a 992,000 seasonally adjusted annual rate. On a year-over-year basis, single-family starts are up 5.2% compared to August 2023. On a year-to-date basis, single-family starts are up 10.4%. The three-month moving average (a useful gauge given recent volatility) is down to 944,000 units, as charted below.

The multifamily sector, which includes apartment buildings and condos, decreased 4.2% to an annualized 364,000 pace. The three-month moving average for multifamily construction has trended upward to a 363,000-unit annual rate. On a year-over-year basis, multifamily construction is up 0.6%.

On a regional and year-to-date basis, combined single-family and multifamily starts are 1.9% lower in the Midwest, 2.1% lower in the Northeast, 4.4% lower in the West and 4.6% lower in the South.

The total number of single-family homes and apartments under construction was 1.5 million in August. This is the lowest total since November 2021. Total housing units now under construction are 11.1% lower than a year ago. Single-family units under construction fell to a count of 642,000—down 5.2% compared to a year ago. The number of multifamily units under construction has fallen to 867,000 units. This is down 15.0% compared to a year ago.

On a 3-month moving average basis, there are currently 1.8 apartments completing construction for every one that is beginning construction. While apartment construction starts are down, the number of completed units entering the market is rising due to prior elevated construction levels. Year-to-date, the pace of completions for apartments in buildings with five or more units is up 36.7% in 2024 compared to 2023. A higher pace of completions in 2024 for multifamily construction will place some downward pressure on rent growth.

Overall permits increased 4.9% to a 1.48-million-unit annualized rate in August. Single-family permits increased 2.8% to a 967,000 unit rate. Multifamily permits increased 9.2% to an annualized 508,000 pace.

Looking at regional data on a year-to-date basis, permits are 2.1% higher in the Midwest, 0.7% higher in the Northeast, 1.1% lower in the South and 6.2% lower in the West.

Discover more from Eye On Housing

Subscribe to get the latest posts sent to your email.


This article was originally published by a eyeonhousing.org . Read the Original article here. .

The total market share of non-site built single-family homes (modular and panelized) was just 3% of single-family homes in 2023, according to completion data from the Census Bureau Survey of Construction data and NAHB analysis. This is a slight increase from the 2% share in 2022. This share has been steadily declining since the early-2000s despite the high-level of interest for non-site built construction. This low market share in fact runs counter to some media commentary on off-site construction suggesting recent gains. Nonetheless, there exists potential for market share gains in the years ahead due to the need to increase productivity in the residential construction sector.

In 2023, there were 27,000 total single-family units built using modular (12,000) and panelized/pre-cut (15,000) construction methods, out of a total of 999,000 single-family homes completed. It is worth noting that the Census definitions of off-site construction are relatively narrow. In a separate survey, the Home Innovation Research Labs Survey of U.S. Home Builders has a higher share for panelized construction (5-12%) due to a wider definition of “panelized” construction.

While the Census-measured market share is small, there exists potential for expansion. This 3% market share for 2023 represents a decline from years prior to the Great Recession. In 1998, 7% of single-family completions were modular (4%) or panelized (3%). This marked the largest share for the 1992-2023 period.

One notable regional concentration is found in the Northeast and Midwest. These two regions tie for the highest market share of homes built using non-site build construction methods. In the Northeast, 5% (4,000 homes) of the region’s 61,000 housing units were completed using non-site built construction methods. At the same time, in the Midwest, 5% market share (6,000 homes) of the region’s 126,000 housing units were completed using non-site build construction methods.

With respect to multifamily construction, approximately 7% of multifamily buildings (properties, not units) were built using modular and panelized methods, marking the highest level in the last two decades. This is significantly higher than the 2% share in 2022 and 1% share in 2018-2021. It is notable that modular construction methods accounted for 5% of this share, whereas in previous years it was only panelized construction methods that made up the small share of non-site build methods in multifamily construction.  Prior to last year, the highest levels of modular and panelized methods share in multifamily construction was in 2000 and 2011, where 5% of multifamily buildings were constructed with modular (1%) or panelized construction methods (4%).

Discover more from Eye On Housing

Subscribe to get the latest posts sent to your email.


This article was originally published by a eyeonhousing.org . Read the Original article here. .

In the most recent NAHB research on home buyer preferences, What Home Buyers Really Want Study, consumers were asked to rate how 28 kitchen and 18 bathroom features would influence their home purchase decision, if at all,  using the following four-point scale:

Do not want – not likely to buy a home with this design or feature.

Indifferent – wouldn’t influence decision.

Desirable – would be seriously influenced to purchase a home because this design or feature was included.

Essential/Must-have – unlikely to purchase a home without this design or feature.

Kitchen

Eighty percent of respondents rated a walk-in pantry and table space for eating as either essential/must-have or desirable, followed by a double sink (78%), drinking water filtration (75%), pull-out shelves and a central island (both at 74%), and a granite or natural stone countertop (73%).  Overall, home buyers want to have kitchens with lots of amenities: of the 28 kitchen features, 21 were essential or desirable to at least 50% of buyers.  A walk-in pantry has been at least tied for the top-rated kitchen feature in every iteration of the survey (Figure 1).

Bathroom

Similar to kitchens, home buyers are looking for bathrooms with lots of amenities, with 14 of the 18 features rated as either essential/must-have or desirable by 50% or more respondents.  The results show an  emphasis on the primary bath, with the top three highest rated bathroom features being listed for this area: both a shower & tub (78%), a linen closet (76%), and a private toilet compartment (70%).  Both a shower stall & tub, as well as a linen closet, have been the top two rated bathroom features by home buyers in every iteration of the survey (Figure 2). 

Like the other areas of the home covered in this study, every question on kitchens and bathrooms is tabulated by the buyer’s income, age, geography, race, household type, and the price they expect to pay for the home.  These details can be very useful in particular cases.  For example, the report discusses the three kitchen features that appeal differentially to buyers in the Millennial generation, as well as three bathroom features that are especially important to include in more expensive homes. 

Discover more from Eye On Housing

Subscribe to get the latest posts sent to your email.


This article was originally published by a eyeonhousing.org . Read the Original article here. .
Pin It