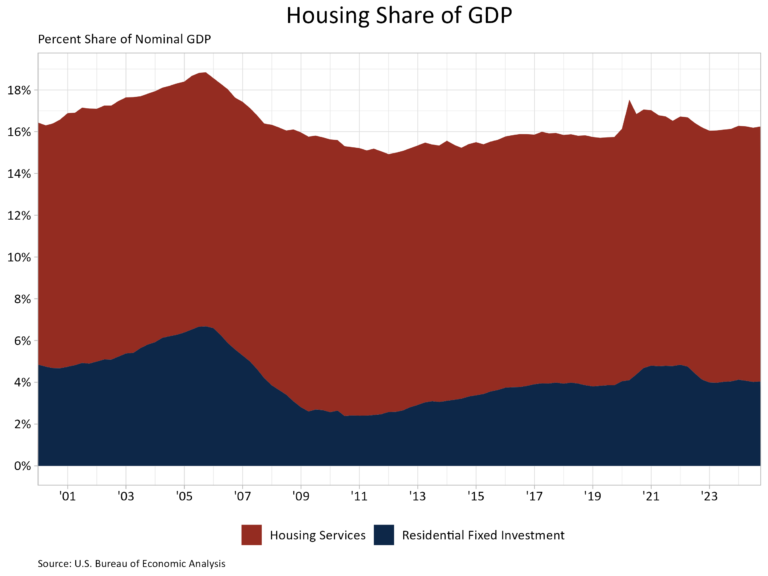
Housing’s share of the economy remained unchanged at 16.2% in the fourth quarter of 2024, according to the advance estimate of GDP produced by the Bureau of Economic Analysis. For the year, housing’s share of the economy was 16.2%, up from 16.0% in 2023 and down from 16.5% in 2022.
The more cyclical home building and remodeling component – residential fixed investment (RFI) – was 4.0% of GDP, level with the previous quarter. The second component – housing services – was 12.2% of GDP, also level with the previous quarter. The graph below stacks the nominal shares for housing services and RFI, resulting in housing’s total share of the economy.
Housing service growth is much less volatile when compared to RFI due to the cyclical nature of RFI. Historically, RFI has averaged roughly 5% of GDP while housing services have averaged between 12% and 13%, for a combined 17% to 18% of GDP. These shares tend to vary over the business cycle. However, the housing share of GDP lagged during the post-Great Recession period due to underbuilding, particularly for the single-family sector.
In the fourth quarter, RFI added 21 basis points from the headline GDP growth rate in the fourth quarter of 2024, a welcomed result as RFI previously had two consecutive quarters of negative contributions to GDP. The Federal Reserve, while keeping unchanged this month, lowered the federal funds rate by 100 basis points in September and December of 2024. This likely improved financing conditions for many builders, leading to RFI’s growth in the fourth quarter. A notable observation from the fourth quarter release was nonresidential fixed investment (similar to RFI, but for nonresidential structures) negatively contributed 31 basis points to GDP growth, the first negative effect on the economy for nonresidential fixed investment in over three years.
Housing services added 17 basis points (bps) to GDP growth. Among household expenditures for services, housing services contributions were the fourth-highest contributor to headline GDP growth behind health care (46 bps), other services (31 bps) and financial services and insurance (18 bps).
Overall GDP increased at a 2.3% annual rate, down from a 3.1% increase in the third quarter of 2024, and down from a 3.0% increase in the second quarter of 2024. Headline GDP growth in 2024 was 2.8%, down slightly from 2.9% in 2023 but up from 2.5% in 2022.
Housing-related activities contribute to GDP in two basic ways:
The first is through residential fixed investment (RFI). RFI is effectively the measure of home building, multifamily development, and remodeling contributions to GDP. RFI consists of two specific types of investment, the first is residential structures. This investment includes construction of new single-family and multifamily structures, residential remodeling, production of manufactured homes, brokers’ fees and some types of equipment that are built into the structure. RFI’s second component, residential equipment, includes investment such as furniture or household appliances that are purchased by landlords for rental to tenants.
For the fourth quarter, RFI was 4.0% of the economy, recording a $1.200 trillion seasonally adjusted annual pace. RFI grew 5.3% at an annual rate in the fourth quarter after falling 4.4% in the third. Among the two types of RFI, real investment in residential structures rose 5.3% while for residential equipment it rose 4.9%. Investment in residential structures stood at a seasonally adjusted annual pace of $1.178 trillion, making its share of residential investment far greater than that of residential equipment, which was at seasonally adjusted annual pace of $21.5 billion.
The second impact of housing on GDP is the measure of housing services. Similar to the RFI, housing services consumption can be broken out into two components. The first component, housing, includes gross rents paid by renters, owners’ imputed rent (an estimate of how much it would cost to rent owner-occupied units), rental value of farm dwellings, and group housing. The inclusion of owners’ imputed rent is necessary from a national income accounting approach, because without this measure, increases in homeownership would result in declines in GDP. The second component, household utilities, is composed of consumption expenditures on water supply, sanitation, electricity, and gas.
For the fourth quarter, housing services represented 12.2% of the economy or $3.625 trillion on a seasonally adjusted annual basis. Housing services grew 1.4% at an annual rate in the fourth quarter. Real person consumption expenditures for housing also grew 1.4%, while household utilities expenditures grew 1.6%. At the seasonally adjusted annual pace, housing expenditures was $3.166 trillion and household utility expenditures stood at $458.9 billion in seasonally adjusted annual rates.
Discover more from Eye On Housing
Subscribe to get the latest posts sent to your email.
This article was originally published by a eyeonhousing.org . Read the Original article here. .


