Tag

September

Browsing


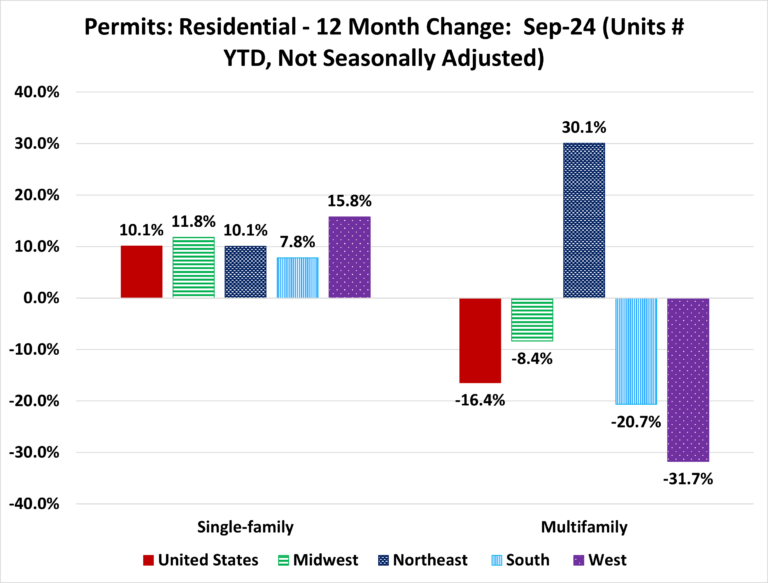
Over the first nine months of 2024, the total number of single-family permits issued year-to-date (YTD) nationwide reached 763,990. On a year-over-year (YoY) basis, this is an increase of 10.1% over the September 2023 level of 693,908.

Year-to-date ending in September, single-family permits were up in all four regions. The range of permit increases spanned 15.8% in the West to 7.8% in the South. The Midwest was up by 11.8% and the Northeast was up by 10.1% in single-family permits during this time. For multifamily permits, three out of the four regions posted declines. The Northeast, driven by New York, was the only region to post an increase and was up by 30.1%. Meanwhile, the West posted a decline of 31.7%, the South declined by 20.7%, and the Midwest declined by 8.4%.

Between September 2024 YTD and September 2023 YTD, 46 states and the District of Columbia posted an increase in single-family permits. The range of increases spanned 43.6% in New Mexico to 0.4% in Oregon. Maryland (-1.5%), New Hampshire (-1.6%), Alaska (-4.3%), and Hawaii (-7.7%) reported declines in single-family permits. The ten states issuing the highest number of single-family permits combined accounted for 63.1% of the total single-family permits issued. Texas, the state with the highest number of single-family permits, issued 122,976 permits over the first nine months of 2024, which is an increase of 10.5% compared to the same period last year. The succeeding highest state, Florida, was up by 1.7%, while the third highest, North Carolina, posted an increase of 8.5%.

Year-to-date ending in September, the total number of multifamily permits issued nationwide reached 362,543. This is 16.4% below the September 2023 level of 433,862.

Between September 2024 YTD and September 2023 YTD, 17 states recorded growth in multifamily permits, while 32 states and the District of Columbia recorded a decline. Georgia reported no change. Rhode Island (+134.6%) led the way with a sharp rise in multifamily permits from 309 to 725, while the District of Columbia had the biggest decline of 70.5% from 2,600 to 766. The ten states issuing the highest number of multifamily permits combined accounted for 63.2% of the multifamily permits issued. Over the first nine months of 2024, Texas, the state with the highest number of multifamily permits issued, experienced a decline of 27.5%. Following closely, the second-highest state in multifamily permits, Florida, saw a decline of 27.0%. California, the third largest multifamily issuing state, decreased by 33.4%.

At the local level, below are the top ten metro areas that issued the highest number of single-family permits.

For multifamily permits, below are the top ten local areas that issued the highest number of permits.

Discover more from Eye On Housing

Subscribe to get the latest posts sent to your email.


This article was originally published by a eyeonhousing.org . Read the Original article here. .

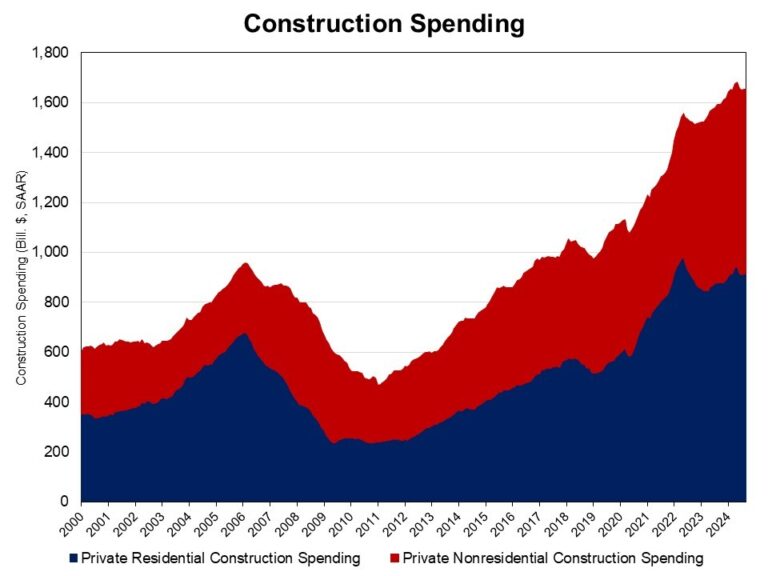
Private residential construction spending inched up 0.2% in September, according to the Census Construction Spending data. The September report shows a 4.1% rise compared to a year ago.  

The monthly increase in total private construction spending for September was largely due to more spending on single-family construction. Spending on single-family construction rose by 0.4% in September. This broke a five-month streak of declines, aligning with the modest gains in single-family starts during September. Compared to a year ago, spending on single-family construction was 0.9% higher.  

In contrast, multifamily construction spending continued to decline, edging down 0.1% in September after a dip of 0.3% in August. Year-over-year, spending on multifamily construction was down 8.1%, as there is an elevated level of apartments under construction being completed. Meanwhile, private residential improvement spending stayed flat for the month and was 13.5% higher than a year ago.  

The NAHB construction spending index is shown in the graph below. The index illustrates how spending on single-family construction has slowed since early 2024 under the pressure of elevated interest rates. Multifamily construction spending growth has also slowed down after the peak in July 2023. Meanwhile, improvement spending has increased its pace since late 2023. 

Spending on private nonresidential construction was up 3.5% over a year ago. The annual private nonresidential spending increase was mainly due to higher spending for the class of manufacturing ($39.4 billion), followed by the power category ($6.9 billion). 

Discover more from Eye On Housing

Subscribe to get the latest posts sent to your email.


This article was originally published by a eyeonhousing.org . Read the Original article here. .

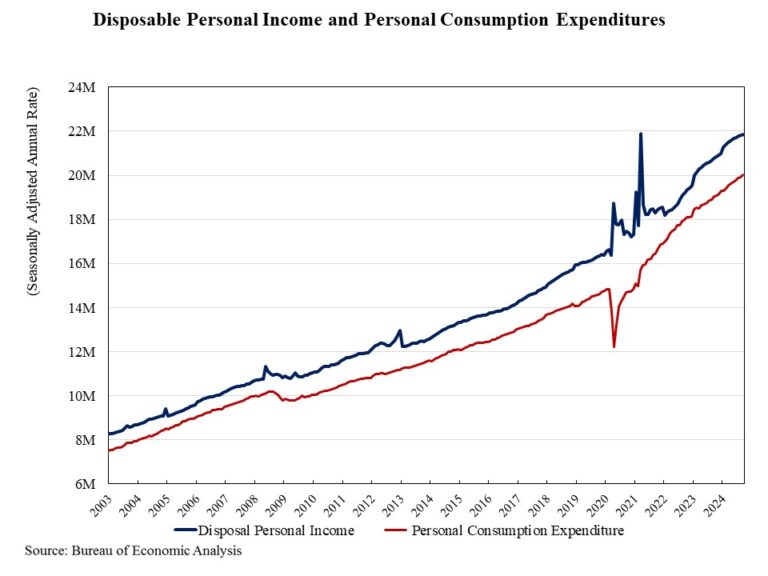
Personal income increased by 0.3% in September, following a 0.2% up in August and a 0.3% increase in July, according to the most recent data release from the Bureau of Economic Analysis. The gains in personal income were largely driven by increases in wages, salaries, and personal current transfer receipts. However, the pace of personal income growth slowed from a peak monthly gain of 1.4% seen in January 2024.

Real disposable income, income remaining after adjusted for taxes and inflation, inched up 0.1% in September. On a year-over-year basis, real (inflation adjusted) disposable income rose 3.1%. The pace of real personal income growth softened from a 6.5% year-over-year peak in June 2023.

Personal consumption expenditures  rose 0.5% in September after a 0.3% increase in August. Real spending, adjusted to remove inflation, increased 0.4% in September, with spending on goods and services each climbing 0.5%.

While spending increased more than personal income, the personal savings rate dipped to 4.6% in September, down from 4.8% in August and 4.9% in July. As inflation has almost eliminated compensation gains, people are dipping into savings to support spending. This will ultimately lead to a slowing of consumer spending.

Discover more from Eye On Housing

Subscribe to get the latest posts sent to your email.


This article was originally published by a eyeonhousing.org . Read the Original article here. .

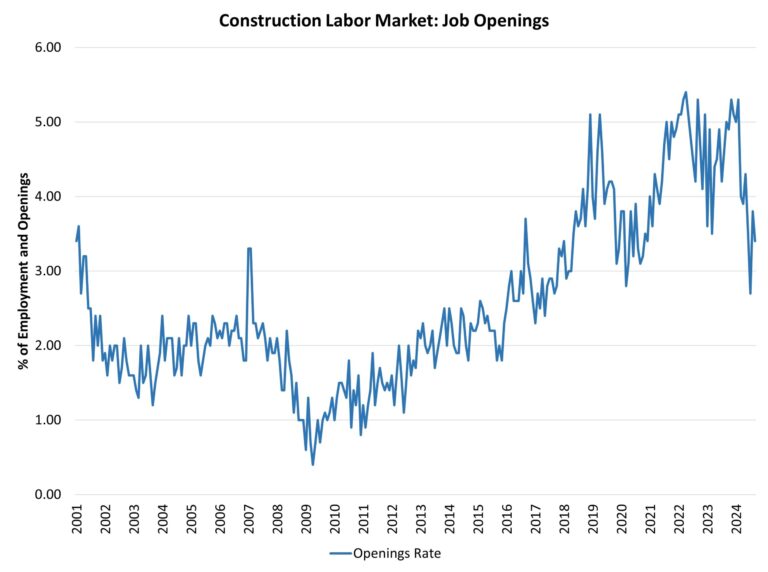
After a period of slowing associated with declines for some elements of residential construction, the count of open construction sector jobs trended lower in the September data, per the Bureau of Labor Statistics’ Job Openings and Labor Turnover Survey (JOLTS). The data indicates the demand for construction labor market remains weaker than a year ago.

In September, after revisions, the number of open jobs for the overall economy declined from 7.86 million to 7.44 million. This is notably smaller than the 9.31 million estimate reported a year ago and a clear sign of a softening aggregate labor market. Previous NAHB analysis indicated that this number had to fall below 8 million on a sustained basis for the Federal Reserve to feel more comfortable about labor market conditions and their potential impacts on inflation. With estimates now remaining near 8 million for national job openings, the Fed has begun a credit easing cycle should continue lowering rates.

The number of open construction sector jobs fell from a revised 328,000 in August to a softer 288,000 in September. Elements of the construction sector slowed in prior months as tight Fed policy persisted. The September reading of opening, unfilled construction jobs is lower than that registered a year ago: 422,000.

The construction job openings rate fell back to 3.4% in September and continues to trend lower.

The layoff rate in construction edged higher to 2.1% in September after a 2% rate in August. The quits rate in construction decreased to just 1.4% in September as job churn slowed.

Discover more from Eye On Housing

Subscribe to get the latest posts sent to your email.


This article was originally published by a eyeonhousing.org . Read the Original article here. .

Home buyers moved off the sidelines in September following the Federal Reserve’s recent move to cut interest rates for the first time in four years. 

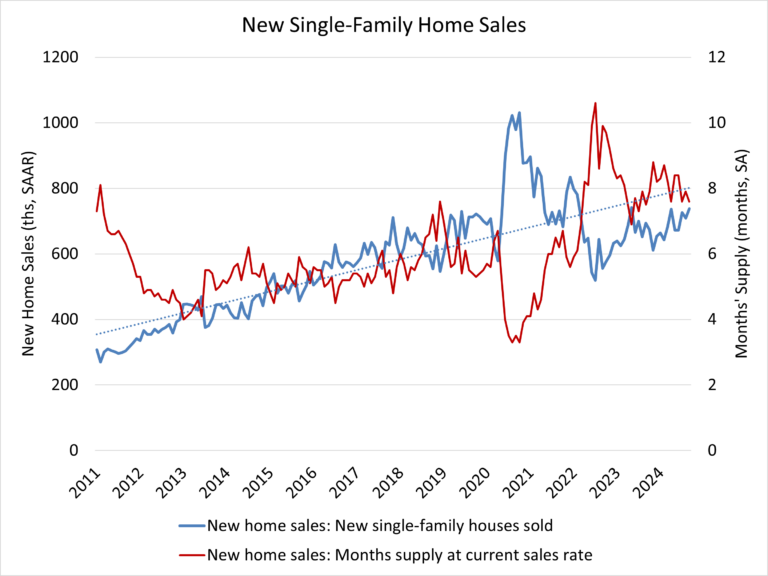
Sales of newly built, single-family homes in September increased 4.1% to a 738,000 seasonally adjusted annual rate from a downwardly revised August number, according to newly released data from the U.S. Department of Housing and Urban Development and the U.S. Census Bureau. The pace of new home sales in September is up 6.3% compared to a year earlier.

Despite challenging affordability conditions, home builder confidence edged higher in October as they anticipate that mortgage rates will gradually, in an uneven manner, moderate in the coming months. There is a significant need for additional housing supply, as many prospective home buyers are entering the market.

Following the Fed’s actions in September, mortgage rates fell to 6.18%, from 6.5% in August. However, new home sales will likely weaken in October due to a recent rise in long-term rates.

A new home sale occurs when a sales contract is signed, or a deposit is accepted. The home can be in any stage of construction: not yet started, under construction or completed. In addition to adjusting for seasonal effects, the September reading of 738,000 units is the number of homes that would sell if this pace continued for the next 12 months.

New single-family home inventory in September remained elevated at a level of 470,000, up 8.0% compared to a year earlier. This represents a 7.6 months’ supply at the current building pace. Completed for-sale new homes rose to 108,000, the highest level since 2009.

The median new home sale price in September was $426,300, essentially unchanged from a year ago. The Census data reveals a gain for new home sales priced below $300,000, which made up 17% of new home sales in September, compared to 14% a year ago.

Regionally, on a year-to-date basis, new home sales are up 19.2% in the Midwest, 1.1% in the South and 3.4% in the West. New home sales are down 1.1% in the Northeast.

Discover more from Eye On Housing

Subscribe to get the latest posts sent to your email.


This article was originally published by a eyeonhousing.org . Read the Original article here. .

Despite recent easing mortgage rates and improved inventory, existing home sales fell to a 14-year low in September as elevated home prices are causing potential buyers to hold out for lower rates, according to the National Association of Realtors (NAR). Sales remained sluggish as the lock-in effect kept home prices elevated. However, we expect increased activity in the coming months as mortgage rates moderate with additional Fed easing. Improving inventory should help slow home price growth and enhance affordability.

Homeowners with lower mortgage rates have opted to stay put, avoiding trading existing mortgages for new ones with higher rates. This trend is driving home prices higher and holding back inventory. With the Federal Reserve beginning its easing cycle at the September meeting, mortgage rates are expected to gradually decrease, leading to increased demand and unlocking lock-in inventory in the coming quarters.

Total existing home sales, including single-family homes, townhomes, condominiums, and co-ops, fell 1.0% to a seasonally adjusted annual rate of 3.84 million in September, the lowest level since October 2010. On a year-over-year basis, sales were 3.5% lower than a year ago.

The first-time buyer share remained at 26% in September, matching the lowest level since November 2021 and August 2024, but down from 27% in September 2023.

The existing home inventory level rose from 1.37 million in August to 1.39 million units in September and is up 23.0% from a year ago. At the current sales rate, September unsold inventory sits at a 4.3-months supply, up from 4.2-months last month and 3.4-months a year ago. This inventory level remains low compared to balanced market conditions (4.5 to 6 months’ supply) and illustrates the long-run need for more home construction. However, the count of single-family resale homes available for sale is up almost 22.2% on a year-over-year basis.

Homes stayed on the market for an average of 28 days in September, up from 26 days in August and 21 days in September 2023.

The September all-cash sales share was 30% of transactions, up from 26% in August and 29% a year ago. All-cash buyers are less affected by changes in interest rates.

The September median sales price of all existing homes was $404,500, up 3.0% from last year. This marked the 15th consecutive month of year-over-year increases and the highest level for the month of September. The median condominium/co-op price in September was up 2.2% from a year ago at $361,600. This rate of price growth will slow as inventory increases.

Existing home sales in September were mixed across the four major regions. In the Northeast, Midwest, and South, sales fell by 4.2%, 2.2%, and 1.7%, respectively, while sales in the Midwest rose by 4.1%. On a year-over-year basis, sales decreased in the Northeast (-6.1%), Midwest (-5.3%) and South (-5.5%). Sales in the West increased 5.6% from a year ago.

The Pending Home Sales Index (PHSI) is a forward-looking indicator based on signed contracts. The PHSI rose from 70.2 to 70.6 in August due to lower mortgage rates. On a year-over-year basis, pending sales were 3.0% lower than a year ago per National Association of Realtors data.

Discover more from Eye On Housing

Subscribe to get the latest posts sent to your email.


This article was originally published by a eyeonhousing.org . Read the Original article here. .


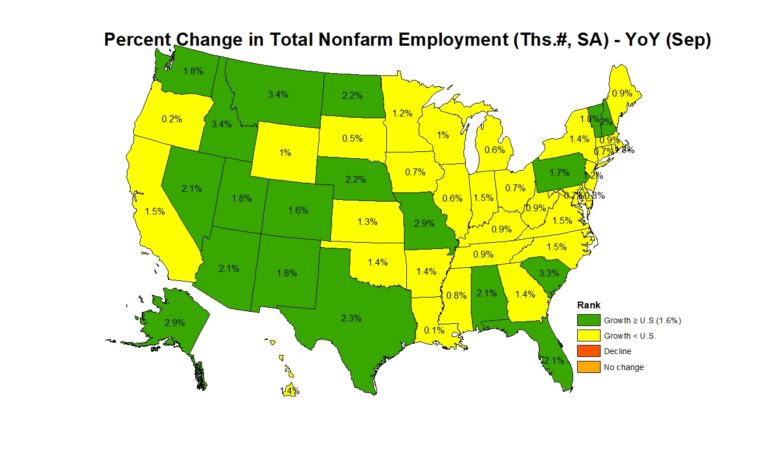
Nonfarm payroll employment increased in 41 states and the District of Columbia in September compared to the previous month, while eight states saw a decrease. Nevada reported no change. According to the Bureau of Labor Statistics, nationwide total nonfarm payroll employment increased by 254,000 in September, following a gain of 159,000 jobs in August.

On a month-over-month basis, employment data was most favorable in Texas, which added 29,200 jobs. New Jersey came in second (+19,200), followed by Florida (+17,000). A total of 17,400 jobs were lost across eight states, with Iowa reporting the steepest job losses at 4,800. In percentage terms, employment increased the highest in Idaho at 0.7%, while Iowa saw the biggest decline at 0.3% between August and September.

Year-over-year ending in September, 2.4 million jobs have been added to the labor market across all 50 states and the District of Columbia. The range of job gains spanned from 2,000 jobs in Louisiana to 327,400 jobs in Texas. In percentage terms, the range of job growth spanned 3.4% in Idaho to 0.1% in Louisiana.

Across the nation, construction sector jobs data   —which includes both residential and non-residential construction—showed that 24 states and the District of Columbia reported an increase in September compared to August, while 23 states lost construction sector jobs. The three remaining states reported no change on a month-over-month basis. Texas, with the highest increase, added 8,100 construction jobs, while Tennessee, on the other end of the spectrum, lost 1,600 jobs. Overall, the construction industry added a net 25,000 jobs in September compared to the previous month. In percentage terms, Ohio reported the highest increase at 2.7% and North Dakota reported the largest decline at 2.1%.

Year-over-year, construction sector jobs in the U.S. increased by 238,000, which is a 3.0% increase compared to the September 2023 level. Texas added 42,300 jobs, which was the largest gain of any state, while New York lost 6,900 construction sector jobs. In percentage terms, Alaska had the highest annual growth rate in the construction sector at 21.1%. Over this period, Oregon reported the largest decline of 4.1%.

Discover more from Eye On Housing

Subscribe to get the latest posts sent to your email.


This article was originally published by a eyeonhousing.org . Read the Original article here. .

With the Federal Reserve beginning an easing of monetary policy and builder sentiment improving, single-family starts posted a modest gain in September while multifamily construction continued to weaken because of tight financing and an ongoing rise in completed apartments.

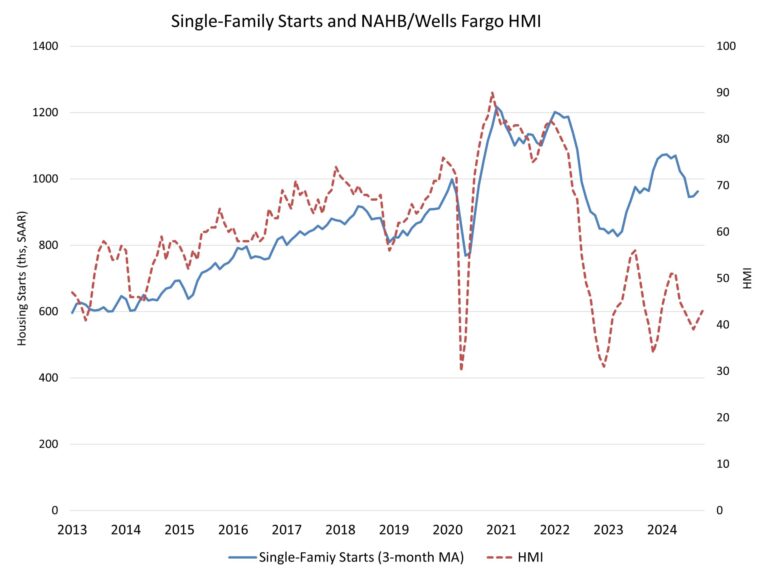
Overall housing starts decreased 0.5% in September to a seasonally adjusted annual rate of 1.35 million units, according to a report from the U.S. Department of Housing and Urban Development and the U.S. Census Bureau.

The September reading of 1.35 million starts is the number of housing units builders would begin if development kept this pace for the next 12 months. Within this overall number, single-family starts increased 2.7% to a 1.03 million seasonally adjusted annual rate. On a year-to-date basis, single-family construction is up 10.1%. The September gain for single-family home building mirrored an increase for the NAHB/Wells Fargo HMI.

While single-family home building increased in September, higher mortgage interest rates in October are likely to place a damper on growth in next month’s data. Nonetheless, NAHB is forecasting a gradual, if uneven, decline for mortgage rates in the coming quarters, with corresponding increases for single-family construction.

The multifamily sector, which includes apartment buildings and condos, decreased 9.4% to an annualized 327,000 pace. This marks the weakest pace since May. Multifamily construction will remain weak as completions of apartments are elevated.

On a regional and year-to-date basis, combined single-family and multifamily starts are 9.0% higher in the Northeast, 2.0% lower in the Midwest, 4.6% lower in the South and 5.4% lower in the West.

Overall permits decreased 2.9% to a 1.43 million unit annualized rate in September. Single-family permits increased 0.3% to a 970,000 unit rate. Multifamily permits decreased 8.9% to an annualized 458,000 pace. This is the weakest reading since May.

Looking at regional data on a year-to-date basis, permits are 0.8% higher in the Northeast, 2.6% higher in the Midwest, 2.2% lower in the South and 5.1% lower in the West.

The number of single-family homes under active construction totaled 642,000 in September. After stabilizing recently, this is down just 4.5% from a year ago. The number of multifamily units under construction declined 3.4% in September to an 842,000 total. This is 16.5% lower than a year ago and is the smallest count since February 2022.

As a sign of the reversal for multifamily construction, the seasonally adjusted annual rate of multifamily construction was 680,000 in September. This was roughly twice the pace of multifamily starts, meaning for every two apartments finishing construction, only one new unit began construction. The pace of multifamily completions was up 41% compared to a year ago.

Discover more from Eye On Housing

Subscribe to get the latest posts sent to your email.


This article was originally published by a eyeonhousing.org . Read the Original article here. .

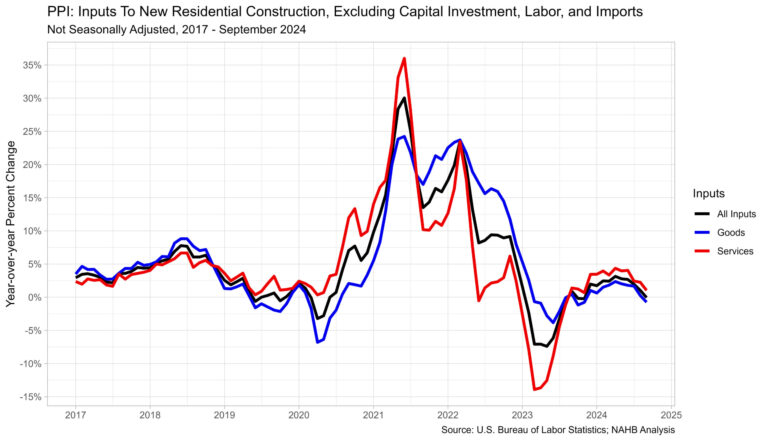
Prices for inputs to new residential construction—excluding capital investment, labor, and imports—decreased 0.6% in September according to the most recent Producer Price Index (PPI) report published by the U.S. Bureau of Labor Statistics. Compared to a year ago, this index was down 0.1% in September after an increase of 1.0% in August.

The inputs to new residential construction price index can be broken into two components­—one for goods and another for services. The goods component decreased 0.7% over the year, while services increased 1.0%. For comparison, the total final demand index increased 1.8% over the year in September, with final demand goods down 1.1% and final demand services up 3.1% over the year.

Input Goods

The goods component has a larger importance to the total residential construction inputs price index, around 60%. The price of input goods to residential construction was down 0.7% in September from August. The input goods to residential construction index can be further broken down into two separate components, one measuring energy inputs with the other measuring goods less energy inputs. The latter of these two components simply represents building materials used in residential construction, which makes up around 93% of the goods index.

Prices for inputs to residential construction, goods less energy, were up 1.5% in September compared to a year ago. This year-over-year growth has continued to slow since April when it was at 2.5% and remains well below growth in September of 2022 when it was at 14.3%. The year-over-year growth in September 2023 was 1.0%, making this year’s growth slightly higher. The index for inputs to residential construction for energy fell 23.5% in September, the largest yearly decrease since 26.1% in July 2023.

The graph below focuses on the data since the start of 2023 for residential goods inputs. Energy prices have retreated over the past year, with only two periods of growth in 2024.

Input Services

Prices of inputs to residential construction, services, fell 0.5% in September from August. The price index for service inputs to residential construction can be broken out into three separate components: the trade services component, the transportation and warehousing services component, and the services less trade, transportation and warehousing component. The most vital component is trade services (around 60%), followed by services less trade, transportation and warehousing (around 29%), and finally transportation and warehousing services (around 11%). The largest component, trade services, compared to last year was up 0.4% in September after increasing 2.1% in August.

Discover more from Eye On Housing

Subscribe to get the latest posts sent to your email.


This article was originally published by a eyeonhousing.org . Read the Original article here. .

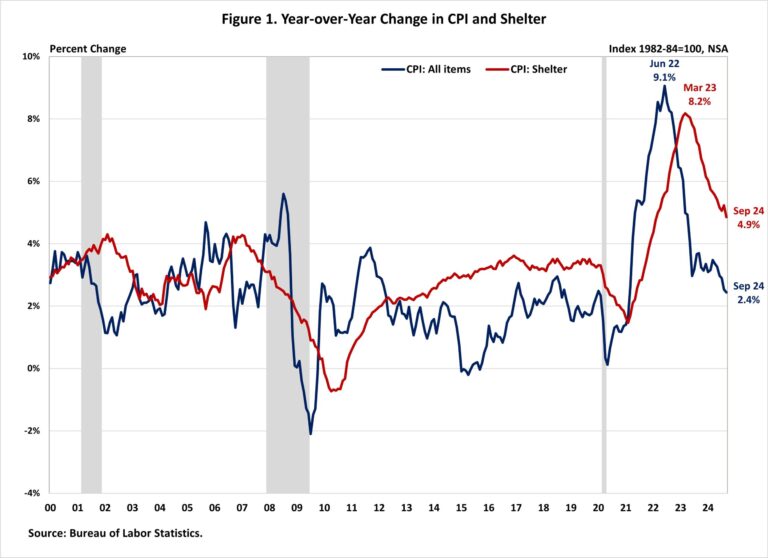
Inflation continued to ease in September and remained at a 3-year low as shelter costs continued to moderate. Shelter costs, the main driver of inflation since early 2023, saw their annual growth rate fall below 5% for the first time since February 2022. With the Fed beginning its easing cycle with a half-point cut last month, lower interest rates could help ease some pressure on the housing market.

Though shelter remains the primary driver of inflation, the Fed has limited ability to address rising housing costs, as these increases are driven by a lack of affordable supply and increasing development costs. Additional housing supply is the primary solution to tame housing inflation. However, the Fed’s tools for promoting housing supply are constrained.

In fact, tight monetary policy hurts housing supply because it increases the cost of AD&C financing. This can be seen on the graph below, as shelter costs continue to rise at an elevated pace despite Fed policy tightening. Nonetheless, with the Fed shifting to a more dovish stance, along with additional apartment supply supported by real-time private data, NAHB expects to see shelter costs to continue decline in the coming months.

The Bureau of Labor Statistics reported that the Consumer Price Index (CPI) rose by 0.2% in September on a seasonally adjusted basis, the same increase as in July and August. Excluding the volatile food and energy components, the “core” CPI increased by 0.3% in September, the same increase as in August.

The price index for a broad set of energy sources fell by 1.9% in September, with declines in gasoline (-4.1%) and fuel oil (-6.0%) offset by increases in electricity (+0.7%) and natural gas (+0.7%). Meanwhile, the food index rose 0.4%, after a 0.1% increase in August. The index for food away from home increased by 0.3% and the index for food at home rose by 0.4%.

The index for shelter (+0.2%) and food (+0.4%) were the largest contributors to the monthly increase in all items index, accounting for over 75% of the total increase. Other top contributors that rose in September include indexes for motor vehicle insurance (+1.2%), medical care (+0.4%), apparel (+1.1%) and airline fares (+3.2%). Meanwhile, the top contributors that experienced a decline include indexes for recreation (-0.4%) and communication (-0.6%).

The index for shelter makes up more than 40% of the “core” CPI. The index saw a 0.2% rise in September, following an increase of 0.5% in August. Both the indexes for owners’ equivalent rent (OER) and rent of primary residence (RPR) increased by 0.3% over the month. These gains have been the largest contributors to headline inflation in recent months. 

During the past twelve months, on a non-seasonally adjusted basis, the CPI rose by 2.4% in September, following a 2.5% increase in August. This was the slowest annual gain since February 2021. The “core” CPI increased by 3.3% over the past twelve months, following a 3.2% increase in August. The food index rose by 2.3%, while the energy index fell by 6.8%.

NAHB constructs a “real” rent index to indicate whether inflation in rents is faster or slower than overall inflation. It provides insight into the supply and demand conditions for rental housing. When inflation in rents is rising faster than overall inflation, the real rent index rises and vice versa. The real rent index is calculated by dividing the price index for rent by the core CPI (to exclude the volatile food and energy components).

In September, the Real Rent Index remained unchanged after a 0.1% increase in August. Over the first nine months of 2024, the monthly growth rate of the Real Rent Index averaged 0.1%, slower than the average of 0.2% in 2023.

Discover more from Eye On Housing

Subscribe to get the latest posts sent to your email.


This article was originally published by a eyeonhousing.org . Read the Original article here. .
Pin It