Tag

Sentiment

Browsing


Confidence in the market for new multifamily housing showed mixed results year-over-year in the third quarter of 2024, according to results from the Multifamily Market Survey (MMS) released today by the National Association of Home Builders (NAHB).  The MMS produces two separate indices: the Multifamily Production Index (MPI) had a reading of 40, an increase of two points year-over-year, while the Multifamily Occupancy Index (MOI) had a reading of 75, down seven points year-over-year.

While demand for rental apartments remains strong enough to support relatively high occupancy rates in existing projects, multifamily builders and developers continue to face many significant obstacles on new projects such as higher construction costs, the cost and access to financing, and the availability of land and regulations.  NAHB forecasts multifamily construction to remain weak for another year as the market works through a substantial number of units under construction, before beginning to move back to long-term trends toward the end of 2025.

Multifamily Production Index (MPI)

The MPI is a weighted average of four key market segments: three in the built-for-rent market (garden/low-rise, mid/high-rise, and subsidized) and the built-for-sale (or condominium) market.  The survey asks multifamily builders to rate the current conditions as “good”, “fair”, or “poor” for multifamily starts in markets where they are active.  The index and all its components are scaled so that a number above 50 indicates that more respondents report conditions as good rather than poor.

Two of the four components experienced year-over-year increases: the component measuring subsidized units rose seven points to 46 and garden/low-rise units increased three points to 48. As for the other two, mid/high-rise units remained at 28 while built-for-sale units posted a three-point decline to 29.  However, all four MPI components were below the break-even point of 50 (Figure 1).

Multifamily Occupancy Index (MOI)

The MOI is a weighted average of the three built-for-rent market segments (garden/low-rise, mid/high-rise and subsidized).  The survey asks multifamily builders to rate the current conditions for occupancy of existing rental apartments, in markets where they are active, as “good”, “fair”, or “poor”.  Similar in nature to the MPI, the index and all its components are scaled so that a number above 50 indicates more respondents report that occupancy is good than report it as poor. 

All three components for the MOI experienced year-over-year declines.  The component measuring mid/high-rise units dropped eight points to 66, garden/low-rise units fell seven points to 77, and subsidized units decreased three points to 86.  Nevertheless, all three MOI components were above the break-even point of 50 (Figure 2).

The MMS was re-designed last year to produce results that are easier to interpret and consistent with the proven format of other NAHB industry sentiment surveys.  Until there is enough data to seasonally adjust the series, changes in the MMS indices should only be evaluated on a year-over-year basis.

Please visit NAHB’s MMS web page for the full report.

Discover more from Eye On Housing

Subscribe to get the latest posts sent to your email.


This article was originally published by a eyeonhousing.org . Read the Original article here. .
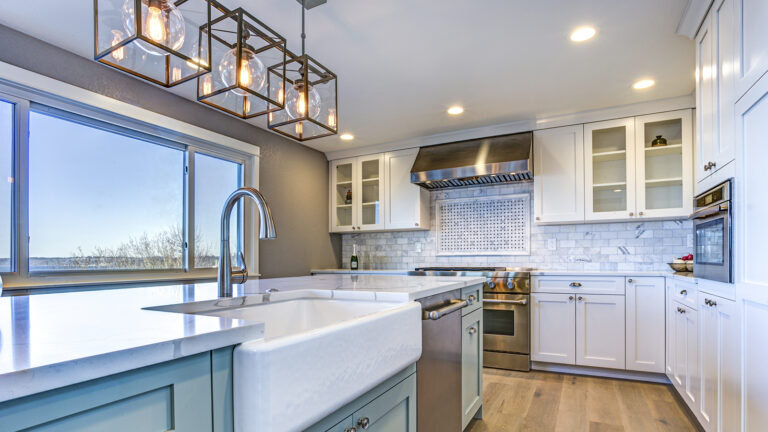

The NAHB/Westlake Royal Remodeling Market Index (RMI) for the third quarter of 2024 posted a reading of 63, down two points compared to the previous quarter.

Remodelers remain optimistic about the market even though the overall RMI edged down for the third consecutive quarter. Some have potential customers citing the upcoming election as a reason for putting large projects on hold. Remodelers also continue to face various headwinds such as difficulty finding skilled construction labor and higher interest rates. Nevertheless, the overall RMI reading of 63 is consistent with NAHB’s forecast for steady 2% growth in remodeling spending over the next two years.

The RMI is based on a survey that asks remodelers to rate various aspects of the residential remodeling market “good”, “fair” or “poor.”  Responses from each question are converted to an index that lies on a scale from 0 to 100. An index number above 50 indicates a higher proportion of respondents view conditions as good rather than poor.

Current Conditions

The Remodeling Market Index (RMI) is an average of two major component indices: the Current Conditions Index and the Future Indicators Index. 

The Current Conditions Index is an average of three subcomponents: the current market for large remodeling projects ($50,000 or more), moderately sized projects ($20,000 to $49,999), and small projects (under $20,000). In the third quarter of 2024, the Current Conditions Index averaged 72, declining one point from the previous quarter.  All three components remained well above 50 in positive territory: the component measuring small-sized remodeling projects (under $20,000) rose two points to 77, while both the component measuring moderate remodeling projects (at least $20,000 but less than $50,000) and the component measuring large remodeling projects ($50,000 or more) fell three points to 71 and 67, respectively.

Future Indicators

The Future Indicators Index is an average of two subcomponents: the current rate at which leads and inquiries are coming in and the current backlog of remodeling projects. 

In the third quarter of 2024, the Future Indicators Index was 55, down three points from the previous quarter.  Quarter-over-quarter, the component measuring the backlog of remodeling jobs fell three points to 57 and the component measuring the current rate at which leads and inquiries are coming in dropped two points to 53.

For the full set of RMI tables, including regional indices and a complete history for each RMI component, please visit NAHB’s RMI web page.

Discover more from Eye On Housing

Subscribe to get the latest posts sent to your email.


This article was originally published by a eyeonhousing.org . Read the Original article here. .


With mortgage rates declining by more than one-half of a percentage point from early August through mid-September, per Freddie Mac, builder sentiment edged higher this month even as builders continue to grapple with rising costs.

Builder confidence in the market for newly built single-family homes was 41 in September, up two points from a reading of 39 in August, according to the National Association of Home Builders (NAHB)/Wells Fargo Housing Market Index (HMI). This breaks a string of four consecutive monthly declines.

Due to lower interest rates, builders now have a positive view for future new home sales for the first time since May 2024. However, builders will face competition from rising existing home inventory in many markets as the mortgage rate lock-in effect softens with lower rates.

With inflation moderating, the Federal Reserve is expected to begin a cycle of monetary policy easing this week, which will produce downward pressure on mortgage interest rates and also lower the interest rates on land development and home construction business loans. Lowering the cost of construction is critical to confront persistent challenges for housing affordability.

The latest HMI survey also revealed that the share of builders cutting prices dropped in September for the first time since April, down one point to 32%. Moreover, the average price reduction was 5%, the first time it has been below 6% since July 2022. Meanwhile, the use of sales incentives fell to 61% in September, down from 64% in August.

Derived from a monthly survey that NAHB has been conducting for more than 35 years, the NAHB/Wells Fargo HMI gauges builder perceptions of current single-family home sales and sales expectations for the next six months as “good,” “fair” or “poor.” The survey also asks builders to rate traffic of prospective buyers as “high to very high,” “average” or “low to very low.” Scores for each component are then used to calculate a seasonally adjusted index where any number over 50 indicates that more builders view conditions as good than poor.

All three HMI indices were up in September. The index charting current sales conditions rose one point to 45, the component measuring sales expectations in the next six months increased four points to 53 and the gauge charting traffic of prospective buyers posted a two-point gain to 27.

Looking at the three-month moving averages for regional HMI scores, the Northeast fell three points to 49, the Midwest edged one-point higher to 40, the South decreased one point to 41 and the West increased two points to 39.

The HMI tables can be found at nahb.org/hmi.

Discover more from Eye On Housing

Subscribe to get the latest posts sent to your email.


This article was originally published by a eyeonhousing.org . Read the Original article here. .
Pin It