Tag

Sales

Browsing


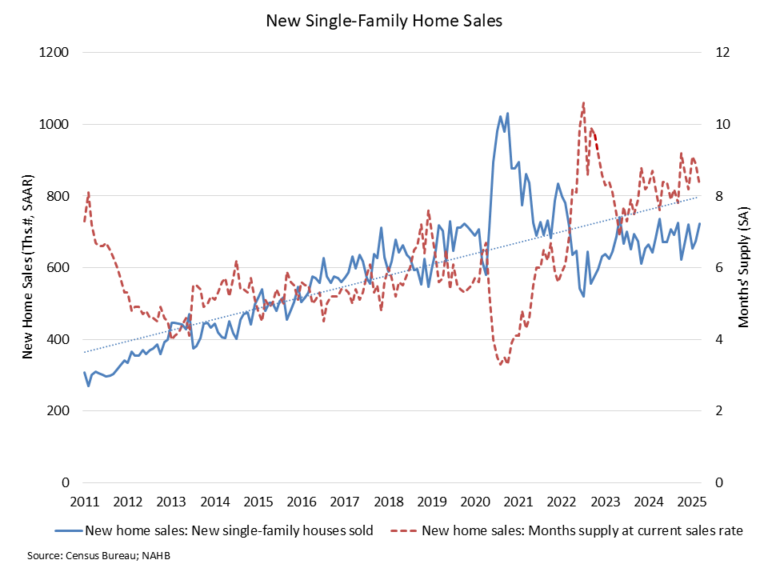
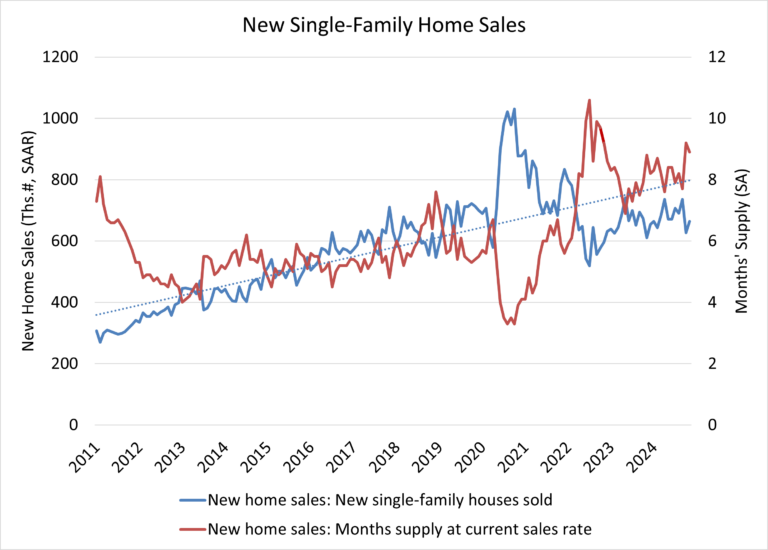
In November 2024, the U.S. housing market experienced a significant boost, with sales of new single-family homes reaching a seasonally adjusted annual rate of 664,000, according to newly released data from the U.S. Department of Housing and Urban Development and the U.S. Census Bureau. This marks a 5.9% increase from October’s revised figures and an 8.7% rise compared to November 2023. November new home sales are up 2.4% on a year-to-date basis.

A new home sale occurs when a sales contract is signed, or a deposit is accepted. The home can be in any stage of construction: not yet started, under construction or completed. In addition to adjusting for seasonal effects, the November reading of 664,000 units is the number of homes that would sell if this pace continued for the next 12 months.

New single-family home inventory in November remained elevated at a level of 490,000, up 8.9% compared to a year earlier. This represents an 8.9 months’ supply at the current building pace. A measure near a six months’ supply is considered balanced.

While an 8.9 months’ supply may be considered elevated in normal market conditions, there is currently only a 3.8 months’ supply of existing single-family homes on the market. Combined, new and existing total months’ supply remains below historic norms at approximately 4.5 months, although this measure is expected to increase as more home sellers test the market in the months ahead.

A year ago, there were 79,000 completed, ready-to-occupy homes available for sale (not seasonally adjusted). By the end of November 2024, that number increased 57% to 124,000. However, completed, ready-to-occupy inventory remains just 25% of total inventory, while homes under construction account for 54% of the inventory. The remaining 21% of new homes sold in November were homes that had not started construction when the sales contract was signed.

The median new home sale price in November edged down 5.4% to $402,600 and is down 6.3% from a year ago. In terms of affordability, the share of entry-level homes priced below $300,000 has been steadily falling in recent years. Only 25% of the homes were priced in this entry-level affordable range, while 31% of the homes were priced above $500,000. Most of the homes were priced between $300,000-$500,000.

Regionally, on a year-over-year basis, new home sales are up 13.6% in the South and 10.0% in the Midwest. New home sales are down 1.4% in the West and 11.5% in the Northeast.

Discover more from Eye On Housing

Subscribe to get the latest posts sent to your email.


This article was originally published by a eyeonhousing.org . Read the Original article here. .
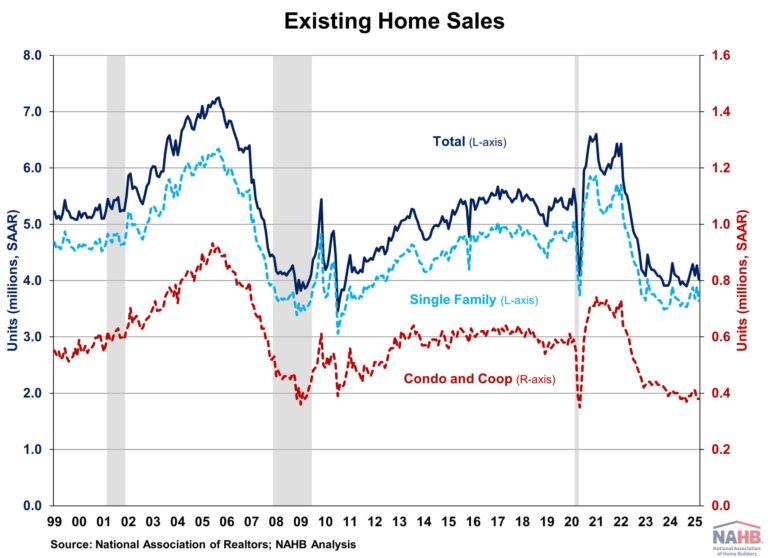

Despite higher mortgage rates and elevated home prices, existing home sales jumped to an 8-month high in November, marking the second month of annual increase in more than three years, according to the National Association of Realtors (NAR).

While inventory improves and the Fed continues lowering rates, the market faces headwinds as mortgage rates are expected to stay above 6% for longer due to an anticipated slower easing pace in 2025. The prolonged rates may continue to discourage homeowners from trading existing mortgages for new ones with higher rates, keeping supply tight and prices elevated. However, as mortgage rates continue trending lower, the gradual improvement in inventory should help slow home price growth and enhance affordability. As such, the recent gains for existing home sales may give way in the coming months of data.

Total existing home sales, including single-family homes, townhomes, condominiums, and co-ops, rose 4.8% to a seasonally adjusted annual rate of 4.15 million in November, the highest level since March 2024. On a year-over-year basis, sales were 6.1% higher than a year ago, the largest annual gain since June 2021.

The first-time buyer share rose to 30% in November, up from 27% in October but down from 31% in November 2023.

The existing home inventory level fell from 1.37 million in October to 1.33 million units in November but is up 17.7% from a year ago. At the current sales rate, November unsold inventory sits at a 3.8-months supply, down from 4.2-months last month but up 3.5-months a year ago. This inventory level remains low compared to balanced market conditions (4.5 to 6 months’ supply) and illustrates the long-run need for more home construction.

Homes stayed on the market for an average of 32 days in November, up from 29 days in October and 25 days in November 2023.

The November all-cash sales share was 25% of transactions, down from 27% experienced in both October 2024 and November 2023. All-cash buyers are less affected by changes in interest rates.

The November median sales price of all existing homes was $406,100, up 4.7% from last year. This marked the 17th consecutive month of year-over-year increases. The median condominium/co-op price in November was up 2.8% from a year ago at $359,800. This rate of price growth will slow as inventory increases.

Geographically, three of four regions saw an increase in existing home sales in November, ranging from 5.3% in the Midwest to 8.5% in the Northeast. Sales in the West stayed unchanged in November. On a year-over-year basis, sales grew in all four regions, ranging from 3.3% in the South to 14.9% in the West.

The Pending Home Sales Index (PHSI) is a forward-looking indicator based on signed contracts. The PHSI rose from 75.9 to 77.4 in October due to improved inventory. On a year-over-year basis, pending sales were 5.4% higher than a year ago per National Association of Realtors data.

Discover more from Eye On Housing

Subscribe to get the latest posts sent to your email.


This article was originally published by a eyeonhousing.org . Read the Original article here. .

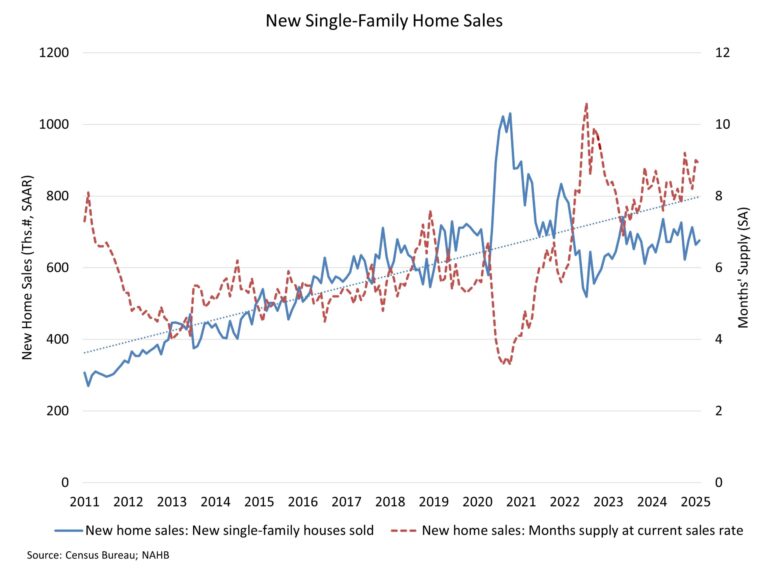
Steadily rising mortgage rates coupled with ongoing affordability challenges kept many potential home buyers on the sidelines in October. Sales of newly built, single-family homes in October declined 17.3% to a 610,000 seasonally adjusted annual rate, according to newly released data from the U.S. Department of Housing and Urban Development and the U.S. Census Bureau. The pace of new home sales in October is down 9.4% compared to a year earlier. October new home sales are up 2.1% on a year-to-date basis.

A new home sale occurs when a sales contract is signed, or a deposit is accepted. The home can be in any stage of construction: not yet started, under construction or completed. In addition to adjusting for seasonal effects, the October reading of 610,000 units is the number of homes that would sell if this pace continued for the next 12 months.

New single-family home inventory in October remained elevated at a level of 481,000, up 8.8% compared to a year earlier. This represents a 9.5 months’ supply at the current sales pace. A measure near a six months’ supply is considered balanced.

While a 9.5 months’ supply may be considered elevated in normal market conditions, there is currently only a 4.2 months’ supply of existing single-family homes on the market. Combined, new and existing total months’ supply remains below historic norms at approximately 4.9 months, although this measure is expected to increase as more home sellers test the market in the months ahead.

A year ago, there were 76,000 completed, ready-to-occupy homes available for sale (not seasonally adjusted). By the end of October 2024, that number increased 52.6% to 116,000. However, completed, ready-to-occupy inventory remains just 24% of total inventory, while homes under construction account for 55% of the inventory. The remaining 22% of new homes sold in October were homes that had not started construction when the sales contract was signed.

The median new home sale price in October edged up 2.5% to $437,300 and is up 4.7% from a year ago. In terms of affordability, the share of entry-level homes priced below $300,000 has been steadily falling in recent years. Only 13% of the homes were priced in this entry-level affordable range, while 37% of the homes were priced above $500,000. Most of the homes were priced between $300,000-$500,000.

Regionally, on a year-over-year basis, new home sales are up 35.3% in the Northeast and 15.9% in the Midwest. New home sales are down 19.7% in the South and 1.3% in the West.

Discover more from Eye On Housing

Subscribe to get the latest posts sent to your email.


This article was originally published by a eyeonhousing.org . Read the Original article here. .

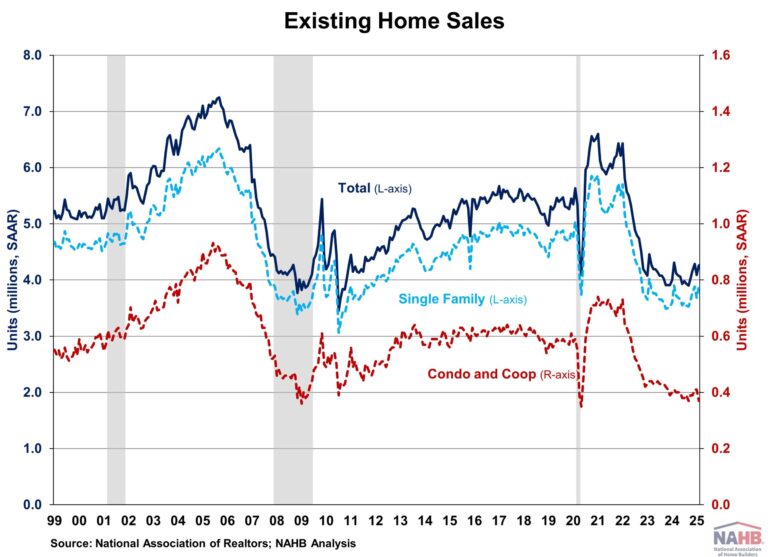
Existing home sales in October rebounded from a 14-year low and posted the first annual increase in more than three years, as buyers took advantage when mortgage rates briefly reached a 2-year low in late September, according to the National Association of Realtors (NAR). While elevated home prices persist due to the lock-in effect, we expect sales activity to increase as mortgage rates moderate with additional Fed easing. Improving inventory should help slow home price growth and enhance affordability.

Homeowners with lower mortgage rates have opted to stay put, avoiding trading existing mortgages for new ones with higher rates. This trend is driving home prices higher and holding back inventory. With the Federal Reserve beginning its easing cycle at the September meeting, mortgage rates are expected to gradually decrease, leading to increased demand and unlocking lock-in inventory in the coming quarters. Total existing home sales, including single-family homes, townhomes, condominiums, and co-ops, rose 3.4% to a seasonally adjusted annual rate of 3.96 million in October. On a year-over-year basis, sales were 2.9% higher than a year ago, ending a 38-month streak of year-over-year declines since July 2021.

The first-time buyer share rose to 27% in October, up from 26% in September but down from 28% in October 2023.

The existing home inventory level rose from 1.36 million in September to 1.37 million units in October and is up 19.1% from a year ago. At the current sales rate, September unsold inventory sits at a 4.2-months supply, down from 4.3-months last month but up 3.6-months a year ago. This inventory level remains low compared to balanced market conditions (4.5 to 6 months’ supply) and illustrates the long-run need for more home construction.

Homes stayed on the market for an average of 29 days in October, up from 28 days in September and 23 days in October 2023.

The October all-cash sales share was 27% of transactions, down from 30% in September and 29% a year ago. All-cash buyers are less affected by changes in interest rates.

The October median sales price of all existing homes was $407,200, up 4.0% from last year. This marked the 16th consecutive month of year-over-year increases. The median condominium/co-op price in October was up 1.6% from a year ago at $360,300. This rate of price growth will slow as inventory increases.

Geographically, all four regions saw an increase in existing home sales in October, ranging from 1.3% in the West to 6.7% in the Midwest. On a year-over-year basis, sales rose 1.1%, 2.3%, and 8.5% in the Midwest, South and West. Sales in the Northeast stayed unchanged.

The Pending Home Sales Index (PHSI) is a forward-looking indicator based on signed contracts. The PHSI rose from 70.6 to 75.8 in September due to improved inventory and lower mortgage rates in late summer. On a year-over-year basis, pending sales were 2.6% higher than a year ago per National Association of Realtors data.

Discover more from Eye On Housing

Subscribe to get the latest posts sent to your email.


This article was originally published by a eyeonhousing.org . Read the Original article here. .

 All-cash purchases accounted for 7.9% of new home sales in the third quarter of 2024, marking the highest level this year but lowest level for the third quarter since 2022, according to NAHB analysis of the latest Census Quarterly Sales by Price and Financing report. Among mortgaged home sales, FHA-backed and VA-backed sales fell while conventional sales increased. This is in line with the overall trend observed in mortgage activity, as mortgage demand grew with moderating rates during this period. Despite the decline in total sales, the median purchase price of new homes (across all financing types) continued to increase in the third quarter.

Since the Federal Reserve began raising interest rates in early 2022, the share of all-cash new home sales has increased significantly, with an average of 8.7% amid this tightening cycle. The interest rate hikes have caused the average mortgage rate to more than double, surging from 3.1% in the fourth quarter of 2021 to 7.0% by the end of second quarter of 2024. The chart below illustrates how much more sensitive the all-cash share has become to changes in the federal funds rate since 2017. However, after peaking at 10.7% in the fourth quarter of 2022, the all-cash share has recently trended lower.

Although cash sales make up a relatively small portion of new home sales, they constitute a larger share of existing home sales. This share also increased significantly since the Fed began raising interest rates in early 2022. According to estimates from the National Association of Realtors, 30% of existing home transactions were all-cash sales in September 2024, up from 26% in August and 29% a year ago.

The share of FHA-backed sales fell from 13.0% to 11.9% in the third quarter of 2024, reaching the lowest level since the fourth quarter of 2022. This share remains below the post-Great Recession average of 17.0%. Meanwhile, the share of VA-backed sales also decreased, falling from 5.4% to 5.1%. Among declines in other types of new home financing, the share of conventional loans financed sales saw an increase in the third quarter of 2024, climbing from 73.9% to 75.1%, the highest level since the fourth quarter of 2022.

Price by Type of Financing

Different sources of financing also serve distinct market segments, which is revealed in part by the median new home price associated with each. In the third quarter, the national median sales price of a new home was $420,400. Split by types of financing, the median prices of new homes financed with conventional loans, FHA loans, VA loans, and cash were $466,100, $352,100, $404,000, and $401,600, respectively.

The purchase price of new homes financed with conventional and cash declined over the past year, while the price of homes financed with FHA loans and VA loans increased. The largest decline occurred in cash sales prices, which fell 21.1% over the year. This is in stark contrast to year-over-year price changes in the third quarter of 2022 and 2023, when median sales price rose 16.9% and 18.2% (see below).

Discover more from Eye On Housing

Subscribe to get the latest posts sent to your email.


This article was originally published by a eyeonhousing.org . Read the Original article here. .


Home buyers moved off the sidelines in September following the Federal Reserve’s recent move to cut interest rates for the first time in four years. 

Sales of newly built, single-family homes in September increased 4.1% to a 738,000 seasonally adjusted annual rate from a downwardly revised August number, according to newly released data from the U.S. Department of Housing and Urban Development and the U.S. Census Bureau. The pace of new home sales in September is up 6.3% compared to a year earlier.

Despite challenging affordability conditions, home builder confidence edged higher in October as they anticipate that mortgage rates will gradually, in an uneven manner, moderate in the coming months. There is a significant need for additional housing supply, as many prospective home buyers are entering the market.

Following the Fed’s actions in September, mortgage rates fell to 6.18%, from 6.5% in August. However, new home sales will likely weaken in October due to a recent rise in long-term rates.

A new home sale occurs when a sales contract is signed, or a deposit is accepted. The home can be in any stage of construction: not yet started, under construction or completed. In addition to adjusting for seasonal effects, the September reading of 738,000 units is the number of homes that would sell if this pace continued for the next 12 months.

New single-family home inventory in September remained elevated at a level of 470,000, up 8.0% compared to a year earlier. This represents a 7.6 months’ supply at the current building pace. Completed for-sale new homes rose to 108,000, the highest level since 2009.

The median new home sale price in September was $426,300, essentially unchanged from a year ago. The Census data reveals a gain for new home sales priced below $300,000, which made up 17% of new home sales in September, compared to 14% a year ago.

Regionally, on a year-to-date basis, new home sales are up 19.2% in the Midwest, 1.1% in the South and 3.4% in the West. New home sales are down 1.1% in the Northeast.

Discover more from Eye On Housing

Subscribe to get the latest posts sent to your email.


This article was originally published by a eyeonhousing.org . Read the Original article here. .
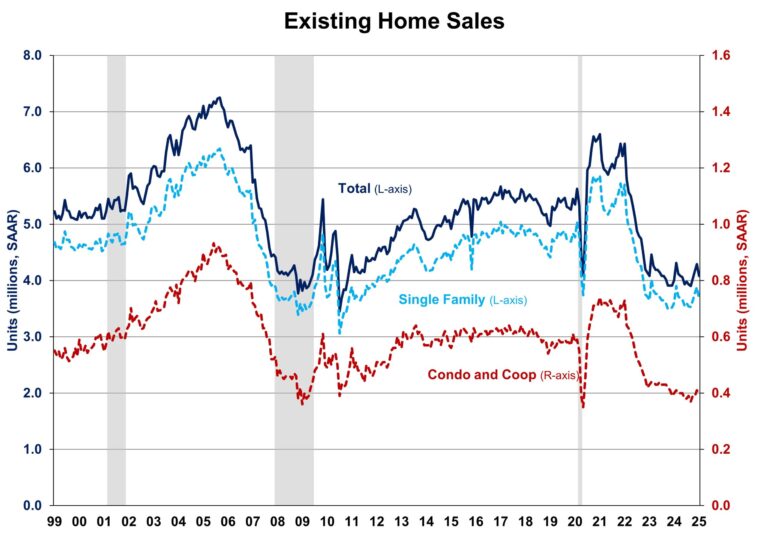

Despite recent easing mortgage rates and improved inventory, existing home sales fell to a 14-year low in September as elevated home prices are causing potential buyers to hold out for lower rates, according to the National Association of Realtors (NAR). Sales remained sluggish as the lock-in effect kept home prices elevated. However, we expect increased activity in the coming months as mortgage rates moderate with additional Fed easing. Improving inventory should help slow home price growth and enhance affordability.

Homeowners with lower mortgage rates have opted to stay put, avoiding trading existing mortgages for new ones with higher rates. This trend is driving home prices higher and holding back inventory. With the Federal Reserve beginning its easing cycle at the September meeting, mortgage rates are expected to gradually decrease, leading to increased demand and unlocking lock-in inventory in the coming quarters.

Total existing home sales, including single-family homes, townhomes, condominiums, and co-ops, fell 1.0% to a seasonally adjusted annual rate of 3.84 million in September, the lowest level since October 2010. On a year-over-year basis, sales were 3.5% lower than a year ago.

The first-time buyer share remained at 26% in September, matching the lowest level since November 2021 and August 2024, but down from 27% in September 2023.

The existing home inventory level rose from 1.37 million in August to 1.39 million units in September and is up 23.0% from a year ago. At the current sales rate, September unsold inventory sits at a 4.3-months supply, up from 4.2-months last month and 3.4-months a year ago. This inventory level remains low compared to balanced market conditions (4.5 to 6 months’ supply) and illustrates the long-run need for more home construction. However, the count of single-family resale homes available for sale is up almost 22.2% on a year-over-year basis.

Homes stayed on the market for an average of 28 days in September, up from 26 days in August and 21 days in September 2023.

The September all-cash sales share was 30% of transactions, up from 26% in August and 29% a year ago. All-cash buyers are less affected by changes in interest rates.

The September median sales price of all existing homes was $404,500, up 3.0% from last year. This marked the 15th consecutive month of year-over-year increases and the highest level for the month of September. The median condominium/co-op price in September was up 2.2% from a year ago at $361,600. This rate of price growth will slow as inventory increases.

Existing home sales in September were mixed across the four major regions. In the Northeast, Midwest, and South, sales fell by 4.2%, 2.2%, and 1.7%, respectively, while sales in the Midwest rose by 4.1%. On a year-over-year basis, sales decreased in the Northeast (-6.1%), Midwest (-5.3%) and South (-5.5%). Sales in the West increased 5.6% from a year ago.

The Pending Home Sales Index (PHSI) is a forward-looking indicator based on signed contracts. The PHSI rose from 70.2 to 70.6 in August due to lower mortgage rates. On a year-over-year basis, pending sales were 3.0% lower than a year ago per National Association of Realtors data.

Discover more from Eye On Housing

Subscribe to get the latest posts sent to your email.


This article was originally published by a eyeonhousing.org . Read the Original article here. .
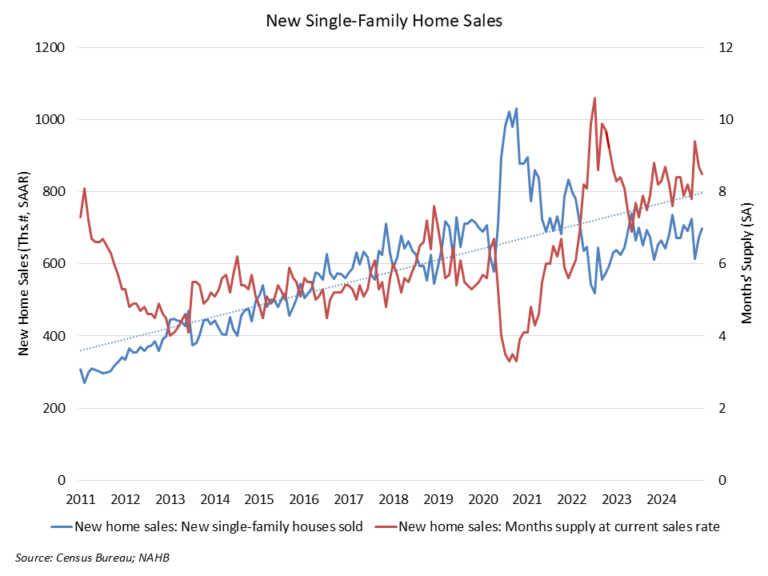

Expectations of the Federal Reserve beginning the first in a series of rate reductions kept potential home buyers in a holding pattern in August.

Sales of newly built, single-family homes in August fell 4.7% after an unusually strong July, according to newly released data from the U.S. Department of Housing and Urban Development and the U.S. Census Bureau.  August new home sales registered a 716,000 seasonally adjusted annual rate, after an upwardly revised estimate of 751,000 for July.

Despite the slip in August, the three-month moving average for new home sales is at its highest level since March of 2022. New home sales are up 4% on a year-to-date basis through August.

Builder sentiment and future sales expectations are improving as the Federal Reserve begins a credit easing cycle. However, due to the mortgage interest lock-in effect, declining interest rates will mean rising existing home inventories and some additional new competition for home builders.

While a 7.8 months’ supply may be considered elevated in normal market conditions, there is currently only a 4.1 months’ supply of existing single-family homes on the market. Combined, new and existing total months’ supply remains below historic norms at approximately 4.7, although this measure is expected to increase as more home sellers test the market in the months ahead.

A new home sale occurs when a sales contract is signed, or a deposit is accepted. The home can be in any stage of construction: not yet started, under construction or completed. In addition to adjusting for seasonal effects, the August reading of 716,000 units is the number of homes that would sell if this pace continued for the next 12 months.

New single-family home inventory increased 1.7% to 467,000 in August, a 7.8 months’ supply at the current sales pace.  Completed, ready to occupy inventory increased to 105,000 homes, which is the highest level since 2009. However, this share makes up only 22% of new home inventory.

Median new home price fell back to $420,600, down 4.6% from a year ago due to builder price incentives amid multidecade highs for housing affordability challenges. The Census data reveals a gain for new home sales priced below $300,000, which made up 18% of new home sales in August compared to 12% a year ago.

Regionally, on a year-to-date basis, new home sales are up in all four regions, rising 2.1% in the Northeast, 21.9% in the Midwest, 0.8% in the South and 4.7% in the West.

Discover more from Eye On Housing

Subscribe to get the latest posts sent to your email.


This article was originally published by a eyeonhousing.org . Read the Original article here. .


Existing home sales fell to a 10-month low in August despite easing mortgage rates and improved inventory, according to the National Association of Realtors (NAR). Home sales remained sluggish as the lock-in effect kept home prices elevated. Meanwhile, the share of first-time buyer in August dropped to a record low. However, we expect increased activity in the coming months as mortgage rates continue to moderate. Improving inventory is likely to ease home price growth and enhance affordability.

Homeowners with lower mortgage rates have opted to stay put, avoiding trading existing mortgages for new ones with higher rates. This trend is driving home prices higher and holding back inventory. With the Federal Reserve beginning its easing cycle at the September meeting, mortgage rates are expected to gradually decrease, leading to increased demand and unlocking lock-in inventory in the coming quarters.

Total existing home sales, including single-family homes, townhomes, condominiums, and co-ops, fell 2.5% to a seasonally adjusted annual rate of 3.86 million in August, the lowest level since October 2023. On a year-over-year basis, sales were 4.2% lower than a year ago.

The first-time buyer share dropped to 26% in August, the lowest level since November 2021, down from 29% in both July and August 2023.

The existing home inventory level rose from 1.34 million in July to 1.35 million units in August and is up 22.7% from a year ago. At the current sales rate, August unsold inventory sits at a 4.2-months supply, up from 4.1-months last month and 3.3-months a year ago. This inventory level remains low compared to balanced market conditions (4.5 to 6 months’ supply) and illustrates the long-run need for more home construction. However, the count of single-family resale homes available for sale is up almost 21.4% on a year-over-year basis.

Homes stayed on the market for an average of 26 days in August, up from 24 days in July and 20 days in August 2023.

The August all-cash sales share was 26% of transactions, down from 27% in both July and a year ago. All-cash buyers are less affected by changes in interest rates.

The August median sales price of all existing homes was $416,700, up 3.1% from last year. This marked the 14th consecutive month of year-over-year increases. The median condominium/co-op price in August was up 3.5% from a year ago at $366,500. This rate of price growth will slow as inventory increases. Existing home sales in August were mixed across the four major regions. In the Northeast, South, and West, sales fell by 2.0%, 3.9%, and 2.7%, respectively, while sales in the Midwest remained unchanged. On a year-over-year basis, sales decreased in the Midwest (-5.2%), South (-6.0%) and West (-1.4%). Sales in the Northeast were unchanged from a year ago.

The Pending Home Sales Index (PHSI) is a forward-looking indicator based on signed contracts. The PHSI fell from 74.3 to 70.2 in July due to persistent affordability challenges. On a year-over-year basis, pending sales were 8.5% lower than a year ago per National Association of Realtors data.

Discover more from Eye On Housing

Subscribe to get the latest posts sent to your email.


This article was originally published by a eyeonhousing.org . Read the Original article here. .

NORTHVILLE, Mich. (FOX 2) – In Michigan alone there are an estimated 66,000 licensed real estate agents, making it an extremely competitive industry.

But there are ways to set yourself apart from the crowd – one agent from Metro Detroit who has really taken his profession to new heights.

Dylan Tent calls himself the heli-realtor – a helicopter pilot who also sells houses. Tent uses his passion to literally and figuratively elevate his sales game.

While his situation is unique, his story provides lessons for anyone looking to set themselves apart.

His videos are outrageous combining daring stunts with unique stories – all to get eyeballs on the properties he represents.

“I did jump a motorcycle pretty far over someone’s house and that’s when people saw, (and said) ‘Wow this video got 30,000 views. I want to hire that guy.'”

And so far, so good.

“An average real estate video might get 500 to 1,000 views, and we have stuff that goes into the hundreds of thousands and millions,” Tent said.

But his path to get there, wasn’t exactly a straight line.

“I quit college after watching a snowboarding movie called ‘The Art of Flight.’ I wanted to be a heli-ski pilot.”

That career choice was short-lived after he says it was more dangerous and less profitable than he thought.

“I started taking pictures of people’s houses from the air and selling them door to door,” he said. “One of the customers said if I got my real estate licenseI could sell his house.

“It was a beautiful lake house. I started adding up in my head, it was a little more profitable to sell real estate and then I could actually purchase and own a helicopter myself.”

Dylan turned 2,000 pictures from above into three real estate sales – and was off from there.

Having a helicopter offers certain advantages including travel for one, which broadens your sales area.

“Lapeer, Metamora, Detroit, Howell,” he said. “I have gone to all of those locations in two hours rather than six or seven hours of driving.”

And it potentially separates you from the competition.

“It really is a resource for video content,” he said. “If I post a video of a house we might get so many thousands of views. If I take off, or land in their front yard or back yard, or lake lot, we’ll get it to go viral almost every time.”

He wouldn’t do it if it didn’t work. but that’s not to say this sales tactic is for everyone.

FOX 2: “You have taken a lot of risks that have seemingly paid off?”

“For example, I had a property that had a gun range and we did some exploding targets that were blowing up stuffed animals on the gun range,” he said. “We were in an area where everyone has guns in that area. Other real estate agents were like, ‘I don’t think we should do that, that is unprofessional.’ I said I’m going to sell that property to a gun owner, I’m probably not going to sell it to someone who doesn’t have that.

“I don’t care if that makes someone angry.”

Tent says the real reason behind his success incorporates passion into his craft, something anyone can do.

“If I was a scratch golfer, I would probably focus on selling houses on golf courses,” he said. “If I was a yoga instructor, I would offer free yoga classes in the park. I have built more relationships through my hobbies than I have, anything else.”

In addition to selling houses, Dylan also offers helicopter tours of the Detroit areas. You can find him and contact him with social media by searching for Dylan Tent, Heli Realitor.

You can find Dylan Tent on social media below:


This article was originally published by a www.fox2detroit.com . Read the Original article here. .

Pin It