Tag

Residential

Browsing


Private residential construction spending increased by 1.3% in February, rebounding from a 1.2% dip in January. The growth was largely driven by higher spending on single-family construction and residential improvements. On a year-over-year basis, the February report showed a 1.6% gain, indicating a modest growth in private residential construction spending during market uncertainties. 

The monthly increase in total private construction spending was primarily driven by gains in spending on single-family construction and residential improvements. Single-family construction spending was up 1% for the month, continuing to grow after a five-month decline from April to August 2024. This growth is consistent with strong single-family housing starts in February. However, single-family construction spending remained 0.1% lower than a year ago. Meanwhile, improvement spending rose by 2% in February and was 8.9% higher compared to the same period last year. In contrast, multifamily construction spending stayed flat in February, extending the downward trend that began in December 2023. Compared to a year ago, multifamily construction spending was down 11.6%. 

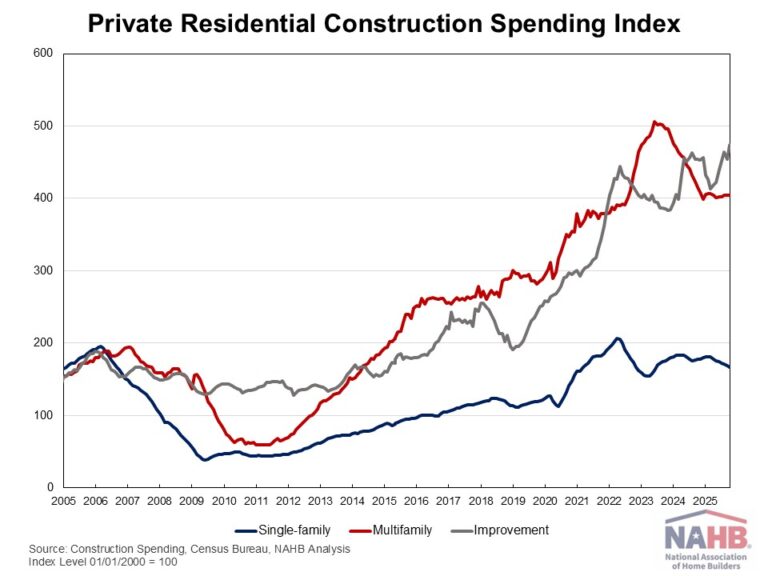
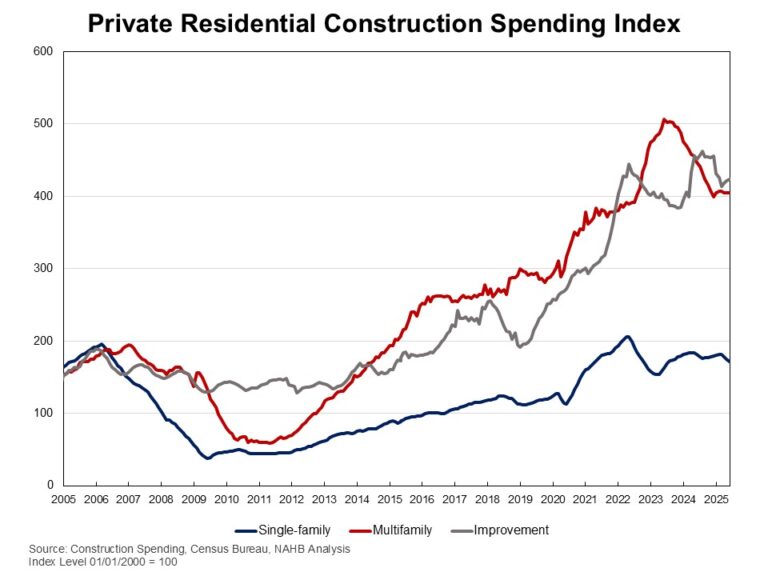
The NAHB construction spending index is shown in the graph below. The index illustrates how   spending on single-family construction has slowed since early 2024 under the pressure of elevated interest rates and concerns over building material tariffs. Multifamily construction spending growth has also slowed down after the peak in July 2023. Meanwhile, improvement spending has increased its pace since late 2023.  

Spending on private nonresidential construction was up 2.5% over a year ago. The annual private nonresidential spending increase was mainly due to higher spending for the class of manufacturing ($10.5 billion), followed by the power category ($6.4 billion). 

Discover more from Eye On Housing

Subscribe to get the latest posts sent to your email.


This article was originally published by a eyeonhousing.org . Read the Original article here. .


Higher interest rates and tight financial lending conditions have led to a decline in loans for new home construction. The total volume of acquisition, development, and construction (AD&C) loans outstanding from FDIC-insured institutions fell 1.02% to $490.7 billion, the third straight quarterly decline. The level of 1-4 residential construction loans, which include loans for the construction of single-family homes and townhomes, has fallen for seven consecutive quarters. Coincidingly, the volume of 1-4 family residential construction has moved to its lowest level since 2021.

The volume of 1-4 family residential construction and land development loans totaled $89.5 billion in the fourth quarter, down 7.6% from one year ago. This is also down after reaching a recent high of $105.0 billion in the first quarter of 2023.

To end the year, a plurality of outstanding loans was held by smaller banking institutions, those with $1 billion-$10 billion in total assets, totaling $30.2 billion (33.7%). Banks with $10 billion- $250 billion in assets held the second largest share at $29.8 billion (33.3%), followed by the smallest banks with under $1 billion in assets, holding $20.7 billion (23.1%). The largest banks with over $250 billion in assets held the smallest amount at $8.8 billion (9.8%).

Notably, 56.9% of 1-4 family residential construction and development loans were held by banks with under $10 billion in assets to end 2024. Small community banks play a vital role ensuring financial and lending opportunities for builders across the United States. The data below shows the year-ending level of outstanding 1-4 family residential construction loans broken out by bank asset sizes.

All Other Real Estate Development Loans

Excluding 1-4 family residential construction loans, the level of all other outstanding real estate construction loans totaled $394.6 billion and was down 2.2% from the previous year This is also down from a peak in the second quarter of 2024 of $404.2 billion.

The banks that held the most loans were those with total assets between $10-$250 billion totaling $163.2 billion (41.4%) to end 2024. Banks with $1-$10 billion in assets held $107.1 billion (27.3%), banks with more than $250 billion in assets held $86.6 billion (21.9%) and the smallest banks, those with less than $1 billion in assets, held $37.7 billion (9.6%).

For the end of 2024, larger banks ($10 billion or more in assets) had more activity in the other construction and land development loan arena compared to 1-4 family residential construction holding 63.3% of the outstanding volume.

It is worth noting, the FDIC data represent only the stock of loans, not changes in the underlying flows, so it is an imperfect data source. Nonetheless, lending remains much reduced from years past. The current amount of existing 1-4 family residential AD&C loans now stands 56% lower than the peak level of residential construction lending of $204 billion reached during the first quarter of 2008. Alternative sources of financing, including equity partners, have supplemented this capital market in recent years.

Discover more from Eye On Housing

Subscribe to get the latest posts sent to your email.


This article was originally published by a eyeonhousing.org . Read the Original article here. .


Private residential construction spending declined by 0.4% in January, largely driven by a decrease in multifamily construction and home improvement spending. This decline followed three consecutive months of growth, indicating a downward shift in the monthly data.  Despite the monthly drop, spending remains 3.1% higher than a year ago, showing the resilience of the housing market.

  According to the latest U.S Census Construction Spending data, multifamily construction spending fell by 0.7% for the month, extending the downward trends that began in December 2023. This decline aligns with the weakness in the Multifamily Production Index (MPI) and a lower number of multifamily homes under construction. Improvement spending declined by 1.5% in January but was 14.3% higher compared to the same period last year. Meanwhile, spending on single-family construction rose by 0.6% in January, continuing its growth after a  five-month decline from April to August. This growth also aligns with steady builder confidence seen in the Housing Market Index. However, single-family construction remained 0.9% lower than a year ago.

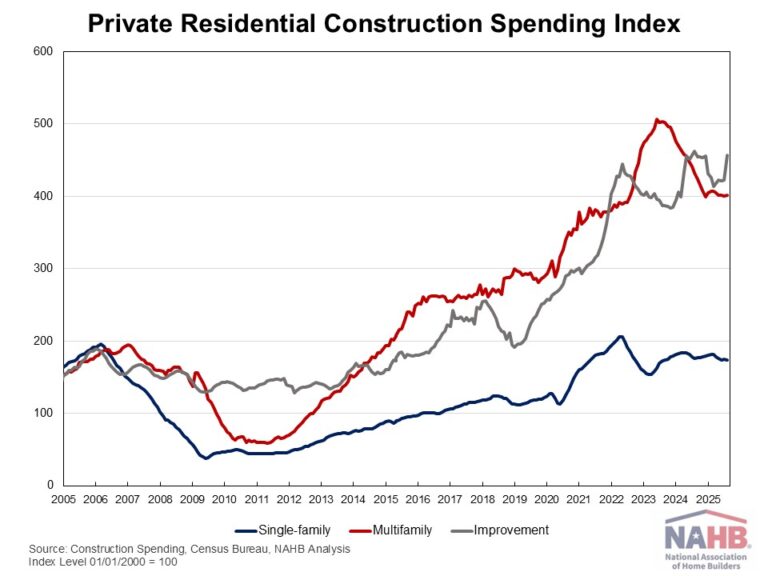
The NAHB construction spending index is shown in the graph below. The index illustrates how   spending on single-family construction has slowed since early 2024 under the pressure of elevated interest rates and concerns over building material tariffs. Multifamily construction spending growth has also slowed down after the peak in July 2023. Meanwhile, improvement spending has increased its pace since late 2023.

Spending on private nonresidential construction was up 1.8% over a year ago. The annual private nonresidential spending increase was mainly due to higher spending for the class of manufacturing ($12.4 billion), followed by the power category ($5.5 billion).

Discover more from Eye On Housing

Subscribe to get the latest posts sent to your email.


This article was originally published by a eyeonhousing.org . Read the Original article here. .


Prices for inputs to new residential construction—excluding capital investment, labor, and imports—were up 1.2% in January according to the most recent Producer Price Index (PPI) report published by the U.S. Bureau of Labor Statistics. The Producer Price Index measures prices that domestic producers receive for their goods and services, this differs from the Consumer Price Index which measures what consumers pay and includes both domestic products as well as imports.

The inputs to the New Residential Construction Price Index grew 1.1% from January of last year. The index can be broken into two components—the goods component increased 2.1% over the year, while services decreased 0.3%. For comparison, the total final demand index, which measures all goods and services across the economy, increased 3.5% over the year, with final demand with respect to goods up 2.3% and final demand for services up 4.1% over the year.

Input Goods

The goods component has a larger importance to the total residential construction inputs price index, representing around 60%. For the month, the price of input goods to new residential construction was up 1.6% in January. Monthly growth of the index was relatively low in the past two years, as this monthly increase was the largest since March of 2022 (3.3%).

The input goods to residential construction index can be further broken down into two separate components, one measuring energy inputs with the other measuring goods less energy inputs. The latter of these two components simply represents building materials used in residential construction, which makes up around 93% of the goods index.

The 2.1% yearly growth in the goods component can be attributed to the rise in the prices of building materials, which grew 2.3% over the year. Meanwhile, the price of energy inputs was 1.6% lower than last year. Between December and January, building materials increased 1.4%, while energy inputs increased 4.3%.

At the individual commodity level, the five commodities with the highest importance for building materials to the New Residential Construction Index were as follows: ready-mix concrete, general millwork, paving mixtures/blocks, sheet metal products, and wood office furniture/store fixtures. Compared to last year, ready-mix concrete was up 4.1%, wood office furniture/store fixtures up 4.7%, general millwork up 2.4%, paving mixtures/blocks up 8.6% while sheet metal products were up 0.4%.

For January, the commodity used in new residential construction that featured the highest price growth was an energy input, home heating oil and distillates, increasing 16.0%. The non-energy input that had the highest monthly price growth was paving mixtures and blocks, up 14.8%. This is likely a pass-through of increases in asphalt prices, which were up 6.9% in January.

Input Services

While prices of inputs to residential construction for services were down 0.3% over the year, they were up 0.5% in January from December. The price index for service inputs to residential construction can be broken out into three separate components: a trade services component, a transportation and warehousing services component, and a services excluding trade, transportation and warehousing component. The most significant component is trade services (around 60%), followed by services less trade, transportation and warehousing (around 29%), and finally transportation and warehousing services (around 11%). The largest component, trade services, was down 1.9% from a year ago. The services less trade, transportation and warehousing component was up 1.6% over the year.   Lastly, prices for transportation and warehousing services advanced 3.1% compared to January last year, the largest year-over-year increase since January of 2023.

Discover more from Eye On Housing

Subscribe to get the latest posts sent to your email.


This article was originally published by a eyeonhousing.org . Read the Original article here. .


Lending standards for residential mortgages were essentially unchanged across most categories, while overall demand for most residential mortgages was weaker according to the Federal Reserve Board’s January 2025 Senior Loan Officer Opinion Survey (SLOOS).  Examining lending conditions for commercial real estate (CRE) loans, construction & development loans were modestly tighter, while demand was modestly weaker.  However, for multifamily properties loans within the CRE category, lending conditions and demand were essentially unchanged for the quarter. 

With recent commentary from the Federal Reserve citing current policy as “meaningfully restrictive”, inflation remaining sticky, and uncertainty caused by current trade policy, NAHB is forecasting any potential cuts (if any) to the federal funds rate to occur in the latter half of 2025.

Residential Mortgages

The Federal Reserve classifies any loan category achieving a value between -5 and +5 as “essentially unchanged.”  Five of seven residential mortgage loan categories saw a slight easing in lending conditions, as evidenced by their positive easing index values, ranging from +1.8 to +4.0, in the fourth quarter of 2024.  That marks the highest number of residential mortgage loan categories showing easing since the Federal Reserve started raising interest rates back in first quarter of 2022.  Subprime and Non-QM jumbo loans were the only categories that were negative for the fourth quarter of 2024, representing tightening conditions.  

All residential mortgage loan categories reported at least modestly weaker demand in the fourth quarter of 2024, except for Non-QM jumbo which was essentially unchanged.  Subprime loans have had weaker demand for the past 18 consecutive quarters, which is the longest weak streak among all residential mortgage loan categories and recorded the lowest net percentage (-45.5%) in the quarter.

Commercial Real Estate (CRE) Loans

Across CRE loan categories, construction & development loans recorded a net easing index value of -9.5 for the fourth quarter of 2024.  As for the multifamily loan category, its net easing index value was -3.2, or essentially unchanged.  For overall CRE loans, results show at least 11 consecutive quarters of tightening lending conditions.  However, the tightening was less pronounced than in recent quarters; the net easing index values for both categories were the closest they have been to neutral (i.e., 0) since the first quarter 2022.

The net percentage of banks reporting stronger demand for construction & development loans was -6.3% and –4.8% for multifamily.  Although weaker demand has continued for the past 10 consecutive quarters for both CRE loan categories, the net percentages are approaching neutral. For the fourth quarter of 2024, the net indices reached their highest levels in over two years.

Discover more from Eye On Housing

Subscribe to get the latest posts sent to your email.


This article was originally published by a eyeonhousing.org . Read the Original article here. .


Private residential construction spending increased by 1.5% in December 2024, according to the latest U.S. Census Construction Spending data. It was the third consecutive monthly increase since September 2024.  On a year-over-year basis, the December report showed a 6% increase.

The monthly increase in total private construction spending was primarily driven by higher spending on single-family construction and residential improvements. Single-family construction spending was up 1% for the month. This marks a continuation of growth after a five-month decline from April to August, aligning with steady builder confidence seen in the Housing Market Index. However, single-family construction remained 0.8% lower than a year ago. Improvement spending rose by 2.6% in December and was 21.9% higher compared to the same period last year. In contrast, multifamily construction spending edged down 0.3% in December, following an 8.4% increase in October and a 0.8% up in November. Compared to a year ago, multifamily construction spending was still 10.5% lower.

The NAHB construction spending index is shown in the graph below. The index illustrates how   spending on single-family construction has slowed since early 2024 under the pressure of elevated interest rates. Multifamily construction spending growth has also slowed down after the peak in July 2023. Meanwhile, improvement spending has increased its pace since late 2023.

Spending on private nonresidential construction was up 2.3% over a year ago. The annual private nonresidential spending increase was mainly due to higher spending for the class of manufacturing ($23.6 billion), followed by the power category ($4.5 billion).

Discover more from Eye On Housing

Subscribe to get the latest posts sent to your email.


This article was originally published by a eyeonhousing.org . Read the Original article here. .


Housing’s share of the economy remained unchanged at 16.2% in the fourth quarter of 2024, according to the advance estimate of GDP produced by the Bureau of Economic Analysis. For the year, housing’s share of the economy was 16.2%, up from 16.0% in 2023 and down from 16.5% in 2022.

The more cyclical home building and remodeling component – residential fixed investment (RFI) – was 4.0% of GDP, level with the previous quarter. The second component – housing services – was 12.2% of GDP, also level with the previous quarter. The graph below stacks the nominal shares for housing services and RFI, resulting in housing’s total share of the economy.

Housing service growth is much less volatile when compared to RFI due to the cyclical nature of RFI. Historically, RFI has averaged roughly 5% of GDP while housing services have averaged between 12% and 13%, for a combined 17% to 18% of GDP. These shares tend to vary over the business cycle. However, the housing share of GDP lagged during the post-Great Recession period due to underbuilding, particularly for the single-family sector.

In the fourth quarter, RFI added 21 basis points from the headline GDP growth rate in the fourth quarter of 2024, a welcomed result as RFI previously had two consecutive quarters of negative contributions to GDP. The Federal Reserve, while keeping unchanged this month, lowered the federal funds rate by 100 basis points in September and December of 2024. This likely improved financing conditions for many builders, leading to RFI’s growth in the fourth quarter. A notable observation from the fourth quarter release was nonresidential fixed investment (similar to RFI, but for nonresidential structures) negatively contributed 31 basis points to GDP growth, the first negative effect on the economy for nonresidential fixed investment in over three years.

Housing services added 17 basis points (bps) to GDP growth.  Among household expenditures for services, housing services contributions were the fourth-highest contributor to headline GDP growth behind health care (46 bps), other services (31 bps) and financial services and insurance (18 bps).

Overall GDP increased at a 2.3% annual rate, down from a 3.1% increase in the third quarter of 2024, and down from a 3.0% increase in the second quarter of 2024. Headline GDP growth in 2024 was 2.8%, down slightly from 2.9% in 2023 but up from 2.5% in 2022.

Housing-related activities contribute to GDP in two basic ways:

The first is through residential fixed investment (RFI). RFI is effectively the measure of home building, multifamily development, and remodeling contributions to GDP. RFI consists of two specific types of investment, the first is residential structures. This investment includes construction of new single-family and multifamily structures, residential remodeling, production of manufactured homes, brokers’ fees and some types of equipment that are built into the structure. RFI’s second component, residential equipment, includes investment such as furniture or household appliances that are purchased by landlords for rental to tenants.

For the fourth quarter, RFI was 4.0% of the economy, recording a $1.200 trillion seasonally adjusted annual pace. RFI grew 5.3% at an annual rate in the fourth quarter after falling 4.4% in the third. Among the two types of RFI, real investment in residential structures rose 5.3% while for residential equipment it rose 4.9%. Investment in residential structures stood at a seasonally adjusted annual pace of $1.178 trillion, making its share of residential investment far greater than that of residential equipment, which was at seasonally adjusted annual pace of $21.5 billion.

The second impact of housing on GDP is the measure of housing services. Similar to the RFI, housing services consumption can be broken out into two components. The first component, housing, includes gross rents paid by renters, owners’ imputed rent (an estimate of how much it would cost to rent owner-occupied units), rental value of farm dwellings, and group housing. The inclusion of owners’ imputed rent is necessary from a national income accounting approach, because without this measure, increases in homeownership would result in declines in GDP. The second component, household utilities, is composed of consumption expenditures on water supply, sanitation, electricity, and gas.

For the fourth quarter, housing services represented 12.2% of the economy or $3.625 trillion on a seasonally adjusted annual basis. Housing services grew 1.4% at an annual rate in the fourth quarter. Real person consumption expenditures for housing also grew 1.4%, while household utilities expenditures grew 1.6%. At the seasonally adjusted annual pace, housing expenditures was $3.166 trillion and household utility expenditures stood at $458.9 billion in seasonally adjusted annual rates.

Discover more from Eye On Housing

Subscribe to get the latest posts sent to your email.


This article was originally published by a eyeonhousing.org . Read the Original article here. .


Prices for inputs to new residential construction—excluding capital investment, labor, and imports—were unchanged in December according to the most recent Producer Price Index (PPI) report published by the U.S. Bureau of Labor Statistics. This index grew 0.8% over 2024, the lowest yearly increase in the index since its inception in 2014.

The inputs to the new residential construction price index can be broken into two components—one for goods and another for services. The goods component increased 1.7% over the year, while services decreased 0.4%. For comparison, the total final demand index increased 3.3% in 2024, with final demand with respect to goods up 1.8% and final demand for services up 4.0% over the year.

Input Goods

The goods component has a larger importance to the total residential construction inputs price index, representing around 60%. The price of input goods to new residential construction was down 0.1% in December from November. The input goods to residential construction index can be further broken down into two separate components, one measuring energy inputs with the other measuring goods less energy inputs. The latter of these two components simply represents building materials used in residential construction, which makes up around 93% of the goods index.

The price of goods used in residential construction grew 1.7% in 2024, slightly higher than the growth in 2023 of 1.0%. This growth can be attributed to the rise in the prices of building materials, which grew 2.2% in 2024. The price of energy inputs fell for the second straight year, down 5.3% in 2024.

At the individual commodity level, the five commodities with the highest importance for building materials to the new residential construction index were as follows: ready-mix concrete, general millwork, paving mixtures/blocks, sheet metal products, and wood office furniture/store fixtures. Across these commodities, there was price growth for most commodities in 2024 except for sheet metal products. Ready-mix concrete was up 5.1%, wood office furniture/store fixtures up 4.3%, general millwork up 2.5%, paving mixtures/blocks up 2.3% while sheet metal products were down 0.2%. The commodity used in new residential construction the featured the highest price growth in 2024 was softwood lumber, not edge worked, which increased 14.7% in 2024. The commodity where prices declined the most was No. 2 diesel fuel, down 13.9%.

Input Services

Prices of inputs to residential construction for services were up 0.5% in December from November. The price index for service inputs to residential construction can be broken out into three separate components: a trade services component, a transportation and warehousing services component, and a services excluding trade, transportation and warehousing component. The most significant component is trade services (around 60%), followed by services less trade, transportation and warehousing (around 29%), and finally transportation and warehousing services (around 11%). The largest component, trade services, was down 1.8% in 2024 after growing 5.8% in 2023.  Across individual services, credit deposit services advanced the most in 2024, up 21.2% over the year while the prices for metal, mineral and ore wholesaling services fell the most, down 19.2%.

Discover more from Eye On Housing

Subscribe to get the latest posts sent to your email.


This article was originally published by a eyeonhousing.org . Read the Original article here. .


The total volume of outstanding acquisition, development, and construction (AD&C) loans made by FDIC-insured institutions fell for the third consecutive quarter during the third quarter of 2024 to a volume of $490.7 billion, down from $495.8 billion in the second quarter. Interest rates remained higher over the third quarter, as the Fed issued its first rate cut at the end of the quarter in September. Future AD&C lending conditions are poised to improve as the Fed continues its easing cycle over the next year despite potential headwinds of higher Government deficits and economic uncertainty.

The volume of 1-4 family residential construction and land development loans totaled $90.8 billion in the third quarter, down 8.4% from one year ago. This year-over-year decline marked the fifth straight quarter where the total volume of outstanding loans declined compared to a year prior. All other real estate development loans totaled $399.9 billion in the third quarter, down $4.3 billion from the previous quarter.

It is worth noting, the FDIC data represent only the stock of loans, not changes in the underlying flows, so it is an imperfect data source. Lending remains much reduced from years past. The current amount of existing 1-4 family residential AD&C loans now stands 55% lower than the peak level of residential construction lending of $204 billion reached during the first quarter of 2008. Alternative sources of financing, including equity partners, have supplemented this capital market in recent years.

While the volume of 1-4 family residential AD&C loans fell during the third quarter, the volume of past due and nonaccrual residential AD&C loans rose above $1 billion for the first time since 2014. A majority of this outstanding total was made up of loans in nonaccrual status (typically a loan where the lender does not expect to receive payment) which totaled $505.9 million. The outstanding loan balance for those 30-89 days past due was $491.5 million and loans 90 days or more past due totaled $65.4 million. As a share of the total outstanding stock of 1-4 family residential AD&C loans ($90.8 billion), past due and nonaccrual loans ($1.0 billion) made up 1.2% of the outstanding stock of loans.

Discover more from Eye On Housing

Subscribe to get the latest posts sent to your email.


This article was originally published by a eyeonhousing.org . Read the Original article here. .


Private residential construction spending edged up by 0.1% in November 2024, according to the latest U.S. Census Construction Spending data. Year-over-year, the November report showed a 3.1% increase.

The monthly increase in total private construction spending was primarily driven by higher spending on single-family construction and residential improvements. Single-family construction spending inched up by 0.3% for the month. This marks a continuation of growth after a five-month decline from April to August, aligning with steady builder confidence seen in the Housing Market Index. However, single-family construction remained 0.7% lower than a year ago. Improvement spending rose by 0.4% in November and was 13.4% higher compared to the same period last year. In contrast, multifamily construction spending declined by 1.3% in November, following a 0.3% increase in October. Compared to a year ago, multifamily construction spending was still 9.5% lower.

The NAHB construction spending index is shown in the graph below. The index illustrates how   spending on single-family construction has slowed since early 2024 under the pressure of elevated interest rates. Multifamily construction spending growth has also slowed down after the peak in July 2023. Meanwhile, improvement spending has increased its pace since late 2023.

Spending on private nonresidential construction was up 1.7% over a year ago. The annual private nonresidential spending increase was mainly due to higher spending for the class of manufacturing ($23.4 billion), followed by the power category ($6.1 billion).

Discover more from Eye On Housing

Subscribe to get the latest posts sent to your email.


This article was originally published by a eyeonhousing.org . Read the Original article here. .

Pin It