Tag

Rates

Browsing


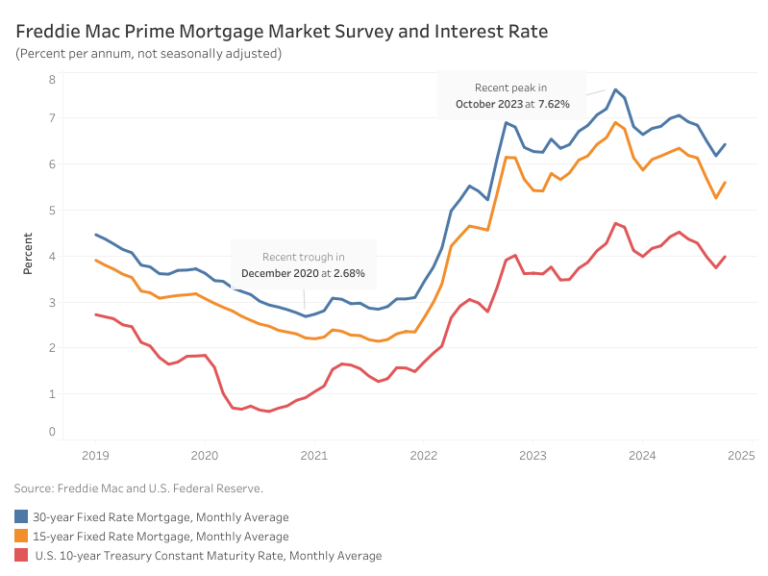
In September, mortgage rates maintained their downward trajectory, returning to levels last seen two years ago. According to Freddie Mac, the average rate for a 30-year fixed-rate mortgage fell to 6.18%, a decline of 32 basis points (bps) from August. The 15-year fixed-rate mortgage saw an even steeper decline, decreasing by 42 bps from August to 5.26%. Additionally, the 10-year Treasury rate declined by 23 bps, falling from 3.98% in August to 3.75%.

According to the NAHB forecast, the 30-year mortgage rate is expected to near 6% on a sustained basis by the end of 2024, with a further decline to just below 6% during 2025. NAHB also predicts furthering easing by the Federal Reserve before the end of 2024.

Discover more from Eye On Housing

Subscribe to get the latest posts sent to your email.


This article was originally published by a eyeonhousing.org . Read the Original article here. .


The homeownership rate for multigenerational households increased by 4.9 percentage points (pp) over the last decade, but there’s another household type that experienced an even larger increase in the homeownership rate over the same period—single parent households.

In further analysis of the Census’s American Community Survey (ACS) data, NAHB dives deeper into the homeownership rate for other family household types: married couples with no children, married couples with children and single parent households. In 2022, most family households were married with no children (44%), followed by married with children (26%), single parents (12%), others (12%), and multigenerational families (6%). This composition has not changed much, with the exception of a gradual decrease in the share of married with children and single parent households, which is offset by an increase in the share of married with no children households.

The homeownership rate for single parent households saw the largest gains in homeownership rate with an increase of 5.7 percentage points over the decade. However, the overall level of homeownership rate for single parent households remains the lowest among all other family household types at just 41%.    Another group that saw a large increase was the married couple with children households, with a 4.5% increase over the decade from 73% to 78%. Like multigenerational households, these increases were spurred on by historically low mortgage rates in 2021.

The only household type to have plateaued was married without children. As a matter of fact, these households saw decreasing homeownership rates for a few years before creeping back up to be at roughly the same rate as they were ten years ago at 84%. Nonetheless, married without children households remain as the group with the highest homeownership rate with an average rate of 84% over the decade.

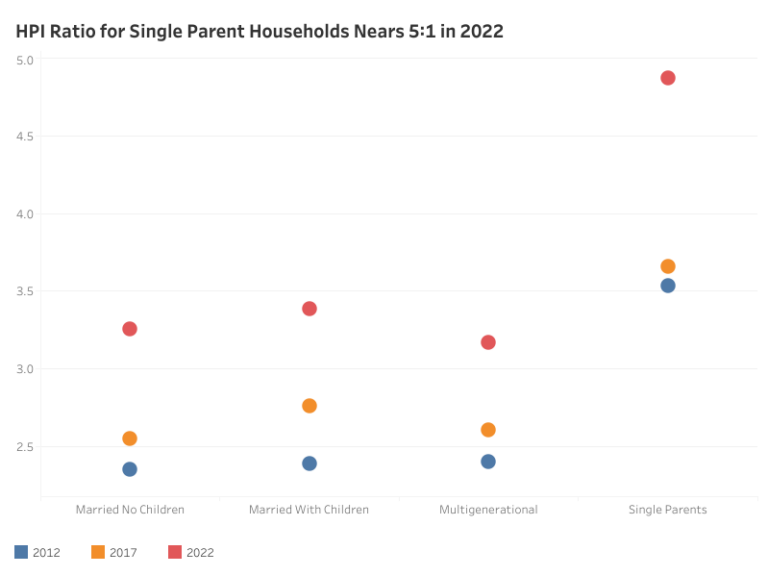
We also examined the estimated home price-to-income ratio (HPI) for various household types. To calculate the home prices for recent homebuyers we used the median property value for owners who moved into their property within the past year. Here is where we see the effect of how multigenerational households were able to lower their HPI with pooled income and budgets. In contrast are single parent households with their estimated home prices approaching five times their income, indicating that these households are significantly burdened by housing costs.   

Given that homeownership rates jumped in recent years for most household types despite increases in home prices suggests that the low mortgage rates in 2021 made steep home prices more palatable for homebuyers to enter the market. However, it is unlikely that we’ll see a continued increase in homeownership while mortgage rates remain elevated. 

Discover more from Eye On Housing

Subscribe to get the latest posts sent to your email.


This article was originally published by a eyeonhousing.org . Read the Original article here. .


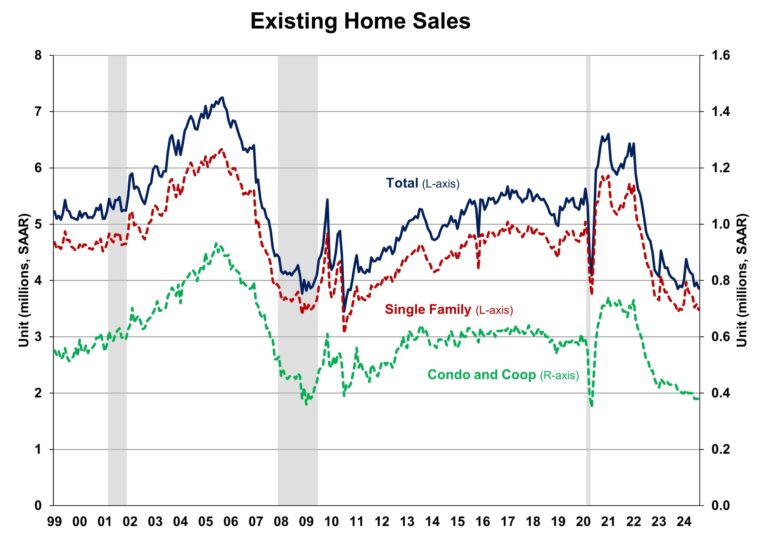
Existing home sales fell to a 10-month low in August despite easing mortgage rates and improved inventory, according to the National Association of Realtors (NAR). Home sales remained sluggish as the lock-in effect kept home prices elevated. Meanwhile, the share of first-time buyer in August dropped to a record low. However, we expect increased activity in the coming months as mortgage rates continue to moderate. Improving inventory is likely to ease home price growth and enhance affordability.

Homeowners with lower mortgage rates have opted to stay put, avoiding trading existing mortgages for new ones with higher rates. This trend is driving home prices higher and holding back inventory. With the Federal Reserve beginning its easing cycle at the September meeting, mortgage rates are expected to gradually decrease, leading to increased demand and unlocking lock-in inventory in the coming quarters.

Total existing home sales, including single-family homes, townhomes, condominiums, and co-ops, fell 2.5% to a seasonally adjusted annual rate of 3.86 million in August, the lowest level since October 2023. On a year-over-year basis, sales were 4.2% lower than a year ago.

The first-time buyer share dropped to 26% in August, the lowest level since November 2021, down from 29% in both July and August 2023.

The existing home inventory level rose from 1.34 million in July to 1.35 million units in August and is up 22.7% from a year ago. At the current sales rate, August unsold inventory sits at a 4.2-months supply, up from 4.1-months last month and 3.3-months a year ago. This inventory level remains low compared to balanced market conditions (4.5 to 6 months’ supply) and illustrates the long-run need for more home construction. However, the count of single-family resale homes available for sale is up almost 21.4% on a year-over-year basis.

Homes stayed on the market for an average of 26 days in August, up from 24 days in July and 20 days in August 2023.

The August all-cash sales share was 26% of transactions, down from 27% in both July and a year ago. All-cash buyers are less affected by changes in interest rates.

The August median sales price of all existing homes was $416,700, up 3.1% from last year. This marked the 14th consecutive month of year-over-year increases. The median condominium/co-op price in August was up 3.5% from a year ago at $366,500. This rate of price growth will slow as inventory increases. Existing home sales in August were mixed across the four major regions. In the Northeast, South, and West, sales fell by 2.0%, 3.9%, and 2.7%, respectively, while sales in the Midwest remained unchanged. On a year-over-year basis, sales decreased in the Midwest (-5.2%), South (-6.0%) and West (-1.4%). Sales in the Northeast were unchanged from a year ago.

The Pending Home Sales Index (PHSI) is a forward-looking indicator based on signed contracts. The PHSI fell from 74.3 to 70.2 in July due to persistent affordability challenges. On a year-over-year basis, pending sales were 8.5% lower than a year ago per National Association of Realtors data.

Discover more from Eye On Housing

Subscribe to get the latest posts sent to your email.


This article was originally published by a eyeonhousing.org . Read the Original article here. .


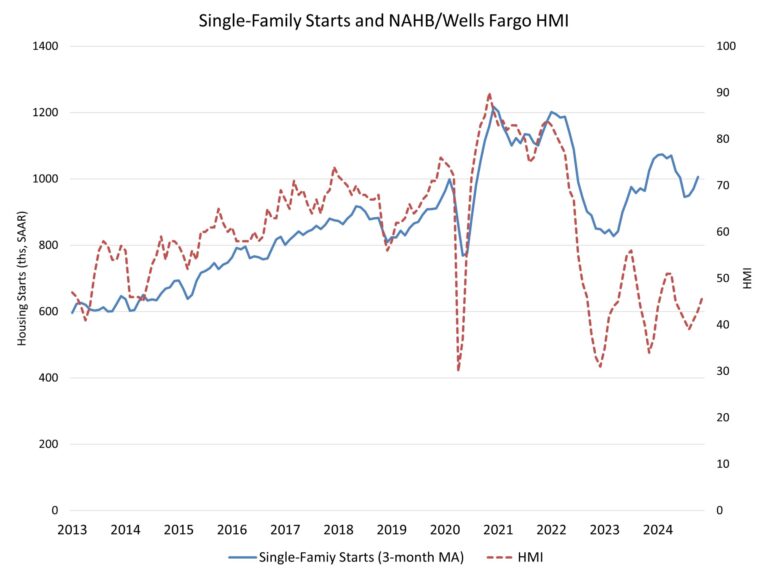
With mortgage rates declining by more than one-half of a percentage point from early August through mid-September, per Freddie Mac, builder sentiment edged higher this month even as builders continue to grapple with rising costs.

Builder confidence in the market for newly built single-family homes was 41 in September, up two points from a reading of 39 in August, according to the National Association of Home Builders (NAHB)/Wells Fargo Housing Market Index (HMI). This breaks a string of four consecutive monthly declines.

Due to lower interest rates, builders now have a positive view for future new home sales for the first time since May 2024. However, builders will face competition from rising existing home inventory in many markets as the mortgage rate lock-in effect softens with lower rates.

With inflation moderating, the Federal Reserve is expected to begin a cycle of monetary policy easing this week, which will produce downward pressure on mortgage interest rates and also lower the interest rates on land development and home construction business loans. Lowering the cost of construction is critical to confront persistent challenges for housing affordability.

The latest HMI survey also revealed that the share of builders cutting prices dropped in September for the first time since April, down one point to 32%. Moreover, the average price reduction was 5%, the first time it has been below 6% since July 2022. Meanwhile, the use of sales incentives fell to 61% in September, down from 64% in August.

Derived from a monthly survey that NAHB has been conducting for more than 35 years, the NAHB/Wells Fargo HMI gauges builder perceptions of current single-family home sales and sales expectations for the next six months as “good,” “fair” or “poor.” The survey also asks builders to rate traffic of prospective buyers as “high to very high,” “average” or “low to very low.” Scores for each component are then used to calculate a seasonally adjusted index where any number over 50 indicates that more builders view conditions as good than poor.

All three HMI indices were up in September. The index charting current sales conditions rose one point to 45, the component measuring sales expectations in the next six months increased four points to 53 and the gauge charting traffic of prospective buyers posted a two-point gain to 27.

Looking at the three-month moving averages for regional HMI scores, the Northeast fell three points to 49, the Midwest edged one-point higher to 40, the South decreased one point to 41 and the West increased two points to 39.

The HMI tables can be found at nahb.org/hmi.

Discover more from Eye On Housing

Subscribe to get the latest posts sent to your email.


This article was originally published by a eyeonhousing.org . Read the Original article here. .


Mortgage rates continued to decrease in August, landing at an average rate of 6.50%. According to Freddie Mac, the average monthly rate fell by 35 basis points (bps) from July’s rate of 6.85%. The August rate is down 57 bps from one year ago, which stood at 7.07%.

The 15-year fixed-rate mortgage also saw a decrease, dropping by 45 bps from July to 5.68%, and is now lower compared to last August by 75 bps. Additionally, the 10-year Treasury rate declined 30 bps from 4.28% in July to 3.98%.

Per the NAHB forecast, we expect 30-year mortgage rates to decline slightly to around 6.66% at the end of 2024 and eventually to decline to just under 6% by the end of 2025. The NAHB outlook anticipates the federal funds rate to be cut by 25 bps no later than the December Federal Reserve meeting, although it is possible for the Fed to cut rates in the upcoming FOMC meeting in September.

Discover more from Eye On Housing

Subscribe to get the latest posts sent to your email.


This article was originally published by a eyeonhousing.org . Read the Original article here. .


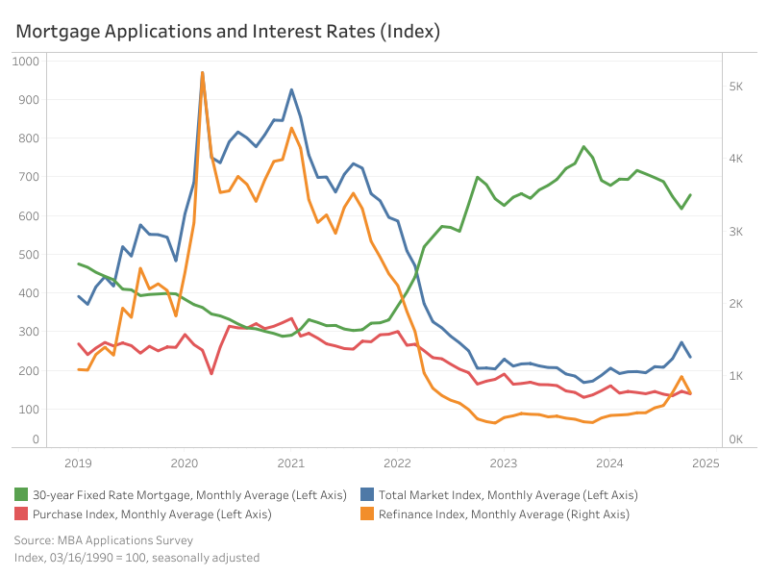
The Market Composite Index, a measure of mortgage loan application volume by the Mortgage Bankers Association’s (MBA) weekly survey, saw a month-over-month increase of 10.7% on a seasonally adjusted (SA) basis. Compared to last August, the index increased by 20.8%. While the Purchase Index declined by 2.9%, month-over-month, the Refinance Index jumped 30.8% as borrowers took advantage of the declining mortgage rates to refinance higher-rate loans. On a yearly basis, the Purchase Index is down by 8.6%, while the Refinance Index increased by 87.2%.

The average monthly 30-year fixed mortgage rate has fallen for four straight months with August seeing the largest decrease of 40 basis points (bps), bringing the rate to 6.49%. The current rate is 73 bps lower than last August.

The average loan size for the total market (including purchases and refinances) is up 3.6% from July to $380,800 on a non-seasonally adjusted (NSA) basis. Similarly, the month-over-month change for purchase loans increased 0.6% to an average size of $426,600, while refinance loans rose by 18.5% to an average of $325,800. The average loan size for an adjustable-rate mortgage (ARM) also saw a steep increase of 9.5% for the same period, from $1.01 million to $1.1 million.

Discover more from Eye On Housing

Subscribe to get the latest posts sent to your email.


This article was originally published by a eyeonhousing.org . Read the Original article here. .


Total outstanding US consumer debt stood at $5.08 trillion for the first quarter of 2024, increasing at an annualized rate of 2.46% (seasonally adjusted), according to the Federal Reserve’s G.19 Consumer Credit Report. From the second quarter of 2023 to the second quarter of 2024, the total increased by 1.84%. This year-over-year (YoY) growth rate is the lowest observed since the first quarter of 2021.

Nonrevolving and Revolving Debt

Of the total outstanding US debt in the first quarter of 2024, the nonrevolving share is 74%, with revolving at 26%. Nonrevolving debt (primarily student and auto loans) stands at $3.73 trillion (SA) for the second quarter of 2024. Revolving debt (mainly credit card debt) stands at $1.34 trillion.

The pace of growth has slowed for both nonrevolving and revolving debt as households’ pandemic-era savings have dwindled. In terms of YoY growth, both nonrevolving and revolving debt peaked in the fourth quarter of 2022 at 15.10% and 5.34% respectively. In the second quarter of 2024, the YoY growth rate for nonrevolving debt decreased to 6.12%, from 7.99% in the first quarter, while the growth rate for revolving debt increased from 0.14% to 0.39%. This was the sixth consecutive quarterly decline in YoY growth for nonrevolving debt while revolving debt saw its first uptick in the YoY rate in five quarters.

Student and Auto Loans

Breaking down the components of nonrevolving debt, student loans account for 47%, and auto loans make up 42% (the G.19 report excludes real estate loans). Collectively, the other loans make up the remaining 11% of nonrevolving debt.

Student loans in the second quarter of 2024 totaled $1.74 trillion (non-seasonally adjusted), marking the fourth consecutive decrease in the YoY rate at -0.96%, following an annual decrease of -1.22% in the previous quarter. The third quarter of 2023 marked the first YoY decrease for student loan debt since the data was first reported.

Auto loan debt for the second quarter of 2024 was $1.57 trillion (NSA). Auto loan YoY growth has steadily decelerated over the past six quarters. The fourth quarter of 2021 saw a high of 13.74% YoY growth compared to the second quarter of 2024 YoY growth rate of 1.95%. This slowdown partially reflects the relatively high interest rate on auto loans, which have increased from 4.52% in Q1 2022 to 8.20% in Q2 2024 (60-month new car loans). However, this car loan rate experienced its first (albeit slight) decline in over two years, falling from 8.22% in the previous quarter.

Credit Cards

The interest rate on credit cards saw its first decrease since the fourth quarter of 2021.  The interest rate for the second quarter of 2024 was 21.51%, falling from 21.59% in the previous quarter. Before this quarter, the rate experienced nine consecutive quarterly increases, with a dramatic increase of 2.8 percentage points from Q3 2022 to Q4 2022. This aligns closely with the Federal Funds Effective Rate increasing 1.47 percentage points during the same period, the highest increase since the 1980s.

Discover more from Eye On Housing

Subscribe to get the latest posts sent to your email.


This article was originally published by a eyeonhousing.org . Read the Original article here. .


During the second quarter of 2024, credit for residential Land Acquisition, Development & Construction (AD&C) continued to tighten and became even more expensive for most types of loans, according to NAHB’s survey on AD&C Financing. The survey was conducted in July and asked specifically about financing conditions in the second quarter, predating the release of some relatively weak economic data that has raised prospects for monetary policy easing.

The net easing index derived from the survey posted a reading of -33.7 in the second quarter (the negative number indicating that credit was tighter than in the previous quarter). The comparable net easing index based on the Federal Reserve’s survey of senior loan officers posted a similar result, with a reading of -23.8—marking the tenth consecutive quarter of borrowers and lenders both reporting tightening credit conditions.

According to the NAHB survey, the most common ways in which lenders tightened in the second quarter were by reducing the amount they are willing to lend, and by lowering the loan-to-value (or loan-to-cost) ratio, each reported by 85% of builders and developers. After those two ways of tightening, three others tied for third place: increasing documentation, increasing the interest rate, and requiring personal guarantees or other collateral unrelated to the project, each reported by exactly half of the borrowers.

As is often the case, as credit becomes less available it also tends to become more expensive. In the second quarter, the contract interest rate increased on all four categories of AD&C loans tracked in the NAHB survey: from 8.40% in 2024 Q1 to 9.28% on loans for land acquisition, from 8.07% to 9.05% on loans for land development, from 8.24% to 8.98% on loans for speculative single-family construction, and from 8.38% to 8.55% on loans for pre-sold single-family construction.

In addition to the contract rate, initial points charged on the loans can be an important component of the overall cost of credit, especially for loans paid off as quickly as typical single-family construction loans. Trends on average initial points were mixed in the second quarter. The average charge on loans for land acquisition was unchanged at 0.88%. The average declined from 0.85% to 0.70% on loans for land development, and from 0.57% to 0.47% on loans for pre-sold single-family construction. On the other hand, on loans for speculative single-family construction, average initial points increased from 0.76% to 0.89%.

Irrespective of changes in points, increases in the underlying contract rate were sufficient to drive up the average effective interest rate (calculated taking both contract rate and initial points into account), on three of the four categories of AD&C loans in the second quarter. The average effective rate increased from 11.09% to 12.22% on loans for land acquisition, from 13.35% to 14.32% on loans for speculative single-family construction, and from 12.95% to 13.08% on loans for pre-sold single-family construction. Meanwhile, the average effective rate declined on loans for land development—from 13.10% in 2024 Q1 to 12.93%.

The average effective rates on loans for land acquisition and speculative single-family construction in the second quarter of 2024 were the highest they’ve been since NAHB began collecting the information in 2018. However, there’s a reasonable chance the situation will improve in the third and fourth quarters, as the Federal Reserve has begun signaling its intent to cut rates later this year.

More detail on credit conditions for builders and developers is available on NAHB’s AD&C Financing Survey web page.

Discover more from Eye On Housing

Subscribe to get the latest posts sent to your email.


This article was originally published by a eyeonhousing.org . Read the Original article here. .


Mortgage rates continued to decrease in July, landing at an average rate of 6.85%. According to Freddie Mac, the average monthly rate fell by 7 basis points (bps) from June’s rate of 6.92%. This current rate is nearly identical to the rate from one year ago, which stood at 6.84%.

The 15-year fixed-rate mortgage also saw a decrease, dropping by 5 bps from June to 6.14%, and is now lower compared to last July by 4 bps. Additionally, the 10-year Treasury rate declined 9 bps from 4.37% in June to 4.28%.

Per the NAHB forecast, we expect 30-year mortgage rates to decline slightly to around 6.66% at the end of 2024 and eventually to decline to just under 6% by the end of 2025. The NAHB outlook anticipates the federal funds rate to be cut by 25 bps no later than the December Federal Reserve meeting and six more rate cuts in 2025 as inflation approaches the Fed’s policy target.

Discover more from Eye On Housing

Subscribe to get the latest posts sent to your email.


This article was originally published by a eyeonhousing.org . Read the Original article here. .

Pin It