Tag

Rate

Browsing


Total outstanding U.S. consumer credit stood at $5.15 trillion for the fourth quarter of 2024, increasing at an annualized rate of 4.22% (seasonally adjusted), according to the Federal Reserve’s G.19 Consumer Credit Report. This is an uptick from the third quarter of 2024’s rate of 2.47%. 

The G.19 report excludes mortgage loans, so the data primarily reflects consumer credit in the form of student loans, auto loans, and credit card plans. As consumer spending has outpaced personal income, savings rates have been declining, and consumer credit has increased. Previously, consumer credit growth had slowed, as high inflation and rising interest rates led people to reduce their borrowing. However, in the last two quarters, growth rates have increased, reflecting the rate cuts that took place at the end of the third quarter.  

Nonrevolving Credit  

Nonrevolving credit, largely driven by student and auto loans, reached $3.76 trillion (SA) in the fourth quarter of 2024, marking a 3.11% increase at a seasonally adjusted annual rate (SAAR). This is an uptick from last quarter’s rate of 2.28%, and the highest in two years.  

Student loan debt balances stood at $1.78 trillion (NSA) for the fourth quarter of 2024. Year-over-year, student loan debt rose 2.77%, the largest yearly increase since the second quarter of 2021. This shift partially reflects the expiration of the COVID-19 Emergency Relief for student loans’ 0-interest payment pause that ended September 1, 2023. 

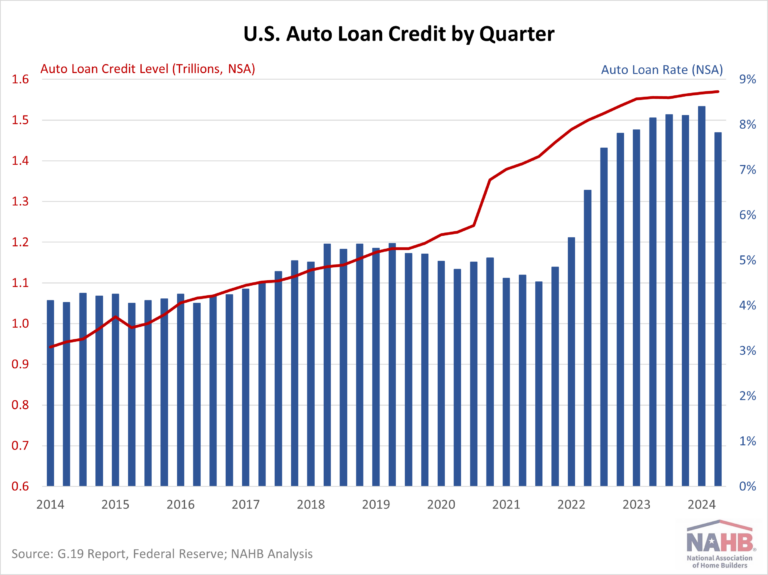
Auto loans reached a total of $1.57 trillion, showing a year-over-year increase of only 0.93%. This marks the second slowest growth rate since 2010, slightly above last quarter’s rate of 0.91%. The deceleration in growth can be attributed to several factors, including stricter lending standards, elevated interest rates, and overall inflation. Although interest rates for 5-year new car loans fell to 7.82% in the fourth quarter from a high of 8.40% in the third quarter, they remain at their highest levels in over a decade. 

Revolving Credit 

Revolving credit, primarily credit card debt, reached $1.38 trillion (SA) in the fourth quarter, rising at an annualized rate of 7.34%. This marked a significant increase from the third quarter’s 3.01% rate but was notably down from the peak growth rate of 17.58% seen in the first quarter of 2022. The surge in credit card balances in early 2022 was accompanied by an increase in the credit card rate which climbed by 4.51 percentage points over 2022. This was an exceptionally steep increase, as no other year in the past two decades had seen a rate jump of more than two percentage points.  

Comparatively, so far in 2024 the credit card rate decreased 0.12 percentage points. For the fourth quarter of 2024, the average credit card rate held by commercial banks (NSA) was 21.47%. 

Discover more from Eye On Housing

Subscribe to get the latest posts sent to your email.


This article was originally published by a eyeonhousing.org . Read the Original article here. .

The homeownership rate for those under the age of 35 dropped to 36.3% in the last quarter of 2024, reaching the lowest level since the third quarter of 2019, according to the Census’s Housing Vacancy Survey (HVS). Amidst elevated mortgage interest rates and tight housing supply, housing affordability is at a multidecade low. The youngest age group, who are particularly sensitive to mortgage rates, home prices, and the inventory of entry-level homes, saw the largest decline among all age categories.

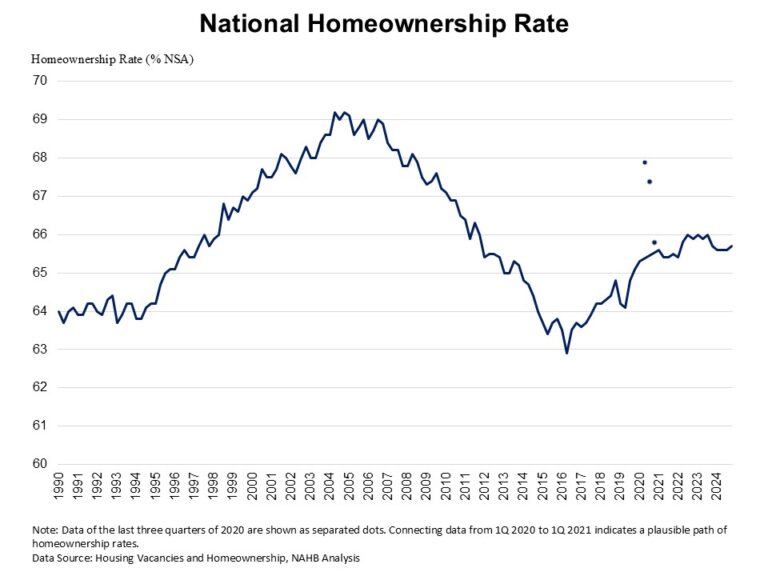
The U.S. homeownership rate inch up to 65.7% in the last quarter of 2024, hovering at the lowest rate in the last two years. The homeownership rate remains below the 25-year average rate of 66.4%.

The national rental vacancy rate stayed at 6.9% for the last quarter of 2024, and the homeowner vacancy rate inched up to 1.1%. The homeowner vacancy rate remains close to the survey’s 67-year low of 0.7%.

Homeownership rates declined for under 35 and 35-44 age groups compared to a year ago. Householders under 35 experienced the largest drop, declining by 1.8 percentage points from 38.1% to 36.3%. The 35-44 age group also saw a 0.6 percentage point decrease, decreasing from 62% to 61.4%. Conversely, homeownership rates for householders aged 45-54 increased from 70.3% to 71%. Among those aged 55-64, homeownership inched up slightly from 76% to 76.3%. Those 65 years and over experienced a modest increase from 79% to 79.5%.

The housing stock-based HVS revealed that the count of total households increased to 132.4 million in the last quarter of 2024 from 131.1 million a year ago. The gains are due to gains in both renter household formation (509,000 increase), and owner-occupied households (783,000 increase).

Discover more from Eye On Housing

Subscribe to get the latest posts sent to your email.


This article was originally published by a eyeonhousing.org . Read the Original article here. .

A key indicator of the labor market is the labor force participation rate. This rate is the percentage of working-age adults in a population who are working or looking for work. The rate is a critical measure connected to both housing demand and housing supply (via the construction labor force).

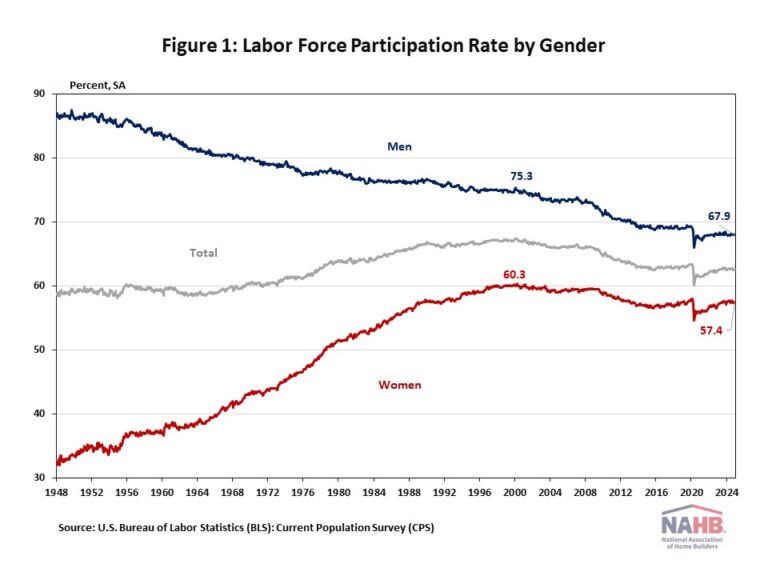
According to the Employment Situation Summary reported by the Bureau of Labor Statistics (BLS), the labor force participation rate remained at 62.5% for the third month in December 2024. After the labor force participation rate reached 67.3% at the beginning of 2000, it has been trending lower. When COVID-19 hit the labor market, the labor force participation rate dropped dramatically from 63.3% in February 2020 to 60.1% in April 2020. The latest labor force participation rate remains below its pre-pandemic levels of 63.3% at the beginning of 2020.

The participation rate is directly connected to the supply of labor. Labor supply varies across different demographic groups, such as age, gender, race, and educational attainment.

Gender

Over time, labor force participation changed dramatically by gender due to evolving societal norms around gender roles. Historically, women experienced a significant increase in labor force participation while men’s participation rates declined. However, over the past 20 years both genders’ labor force participation rates have moved in parallel and been trending downwards. Women’s labor force participation rate is 2.9 percentage points below the peak level in 2000 of 60.3%, while men’s labor force participation rate is 7.4 percentage points lower than the level in 2000 of 75.3%.

According to the latest data from the Current Population Survey (CPS), women currently make up roughly half of the U.S. labor force, representing about 47% of the labor force market. By industry, women accounted for more than half of all workers within several sectors in 2023, such as education and health services (74.4%), other services (53.3%), financial activities (51.1%), and leisure and hospitality (50.8%). Comparably, women were substantially underrepresented (relative to their share of total employment) in manufacturing (29.5%), agriculture (29.3%), transportation and utilities (24.3%), mining (15.3%), and construction (10.8%).

Men tend to have a higher labor force participation rate than women historically, even though this gap has narrowed from 54.7 percentage points in January 1948 to a difference of 10.5 percentage points in December 2024.

Age

The labor force participation rate differs across age groups as well. People ages 65 and older had the lowest labor force participation rate of 19.2%, followed by the youngest age group (16-19 years old) with a participation rate of 36.9%.

Among all age groups, workers aged 25-54, also known as prime-age workers, have the highest labor force participation rate of 83% in 2023. They form the core of the U.S. labor force, accounting for nearly two-thirds (63.8%) of the total labor force. Prime-age workers’ labor force participation rate has fully recovered from the COVID-19 pandemic, surpassing the prior peak of February 2020. The high labor force participation among prime-age men and the rapid increase in prime-age women’s labor force participation contributed to the increase in the labor force over time. By December 2024, prime-age women’s participation rate had hovered near its highest level of 78.1% on record, and 89.0% of prime-age men stayed in the labor force market.

Race and Ethnicity

Labor force participation varies among the largest race and ethnic groups living in the United States, and each group’s labor participation differs according to their gender as well.

Men had a higher labor force participation rate than women in each racial and ethnic group. Among men ages 16 years and over, Hispanic men were the most likely to be in the labor force, with a participation rate of 75.1%, followed by Asian men (76.8%), White men (68.2%), and Black men (65.6%). Among women ages 16 and over, Black women (61.0%) were most likely to participate in the labor force, followed by Hispanic women (58.7%), Asian women (58.1%), and White women (56.5%).

Educational Attainment

Higher levels of educational attainment are generally associated with higher labor force participation rates and lower unemployment rates. It is true for both men and women, and the four selected racial and ethnic groups that people with higher educational attainment tend to have greater employment opportunities and potentially later retirement ages.

With the same level of educational attainment, men are more likely to work than women. Among men with less than a high school diploma, the labor force participation rate was 59.4%, compared to a 34.3% participation rate for women with the same level of educational attainment. The gap of the labor force participation rate between men and women narrows as people achieve higher educational attainment. Women with the highest broad level of education (a bachelor’s degree or higher) have a 69.6% participation rate, a 7.3 percentage point difference from men with the same level of education (76.9%).

Discover more from Eye On Housing

Subscribe to get the latest posts sent to your email.


This article was originally published by a eyeonhousing.org . Read the Original article here. .

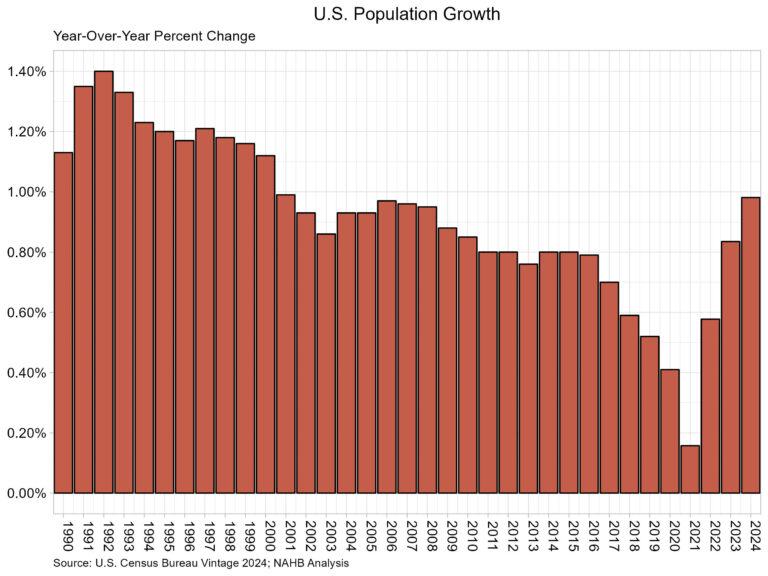
According to the U.S. Census Bureau’s latest estimates, the U.S. resident population grew by 3,304,757 to a total population of 340,110,988. The population grew at a rate of 0.98%, the highest rate since 0.99% in 2001. This also marked the third straight increase in the growth rate of the U.S. population. The vintage population estimates are released annually and represent the change in the U.S. population between July 1st of 2023 and 2024.

The Census Bureau reports that the primary source of population growth was net international migration (immigration), as international migration levels once again were higher than the previous year. The level of net international migration between 2023 and 2024 was 2,786,119. The second component of population growth is natural growth, which represents births minus deaths. Births totaled 3,605,563, down slightly from last year, while the number of deaths was reported at 3,086,925, also a decrease from last year. The natural growth, therefore, between 2023 and 2024 was 518,638.

Each region in the U.S. experienced population growth for the 2023-2024 period. The South led in population growth at 1.34% followed by the West at 0.85%. Meanwhile, the Midwest population grew 0.75%, while the Northeast grew the least at 0.59%.  

At the State level, 47 States and the District of Columbia had a population increase over the year. Of note, D.C. had the highest growth rate at 2.13%. Florida was second with population growth at 2.00% followed by Texas at 1.80%. Numerically, Texas experienced the largest population increase gaining 562,941. This was followed by Florida at 467,347 and California at 232,570.

Only three states lost population or remained level according to Census estimates. Vermont and West Virginia tied with a decline of 0.03%. Meanwhile Mississippi saw no population change.

California remained the most populous state by a healthy margin. California’s population was at 39,198,693, while the next most populous state was Texas at 31,290,831. To round out the top five States by total population the proceeding highest were Florida (23,372,215), New York (19,867,248), and Pennsylvania (13,078,751).

Discover more from Eye On Housing

Subscribe to get the latest posts sent to your email.


This article was originally published by a eyeonhousing.org . Read the Original article here. .

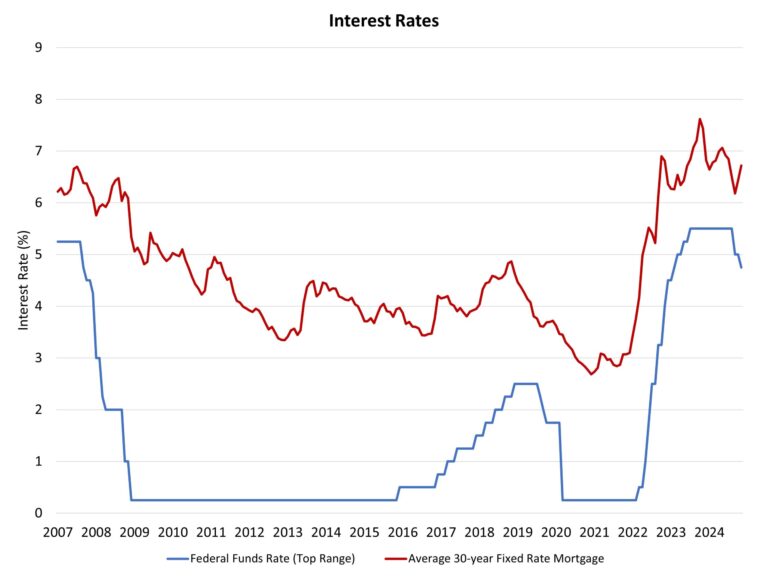
The Fed cut the short-term federal funds rate by an additional 25 basis points at the conclusion of its November meeting, reducing the top target rate to 4.75%. However, while the Fed noted it is making progress to its 2% inflation target, it did not provide post-election guidance on the pace and ultimate path for future interest rate cuts. The bond market is not waiting, with the 10-year Treasury rate rising from 3.6% in mid-September to close to 4.3% due to changing growth and government deficit expectations.

Today’s statement from the Fed noted:

“Recent indicators suggest that economic activity has continued to expand at a solid pace. Since earlier in the year, labor market conditions have generally eased, and the unemployment rate has moved up but remains low. Inflation has made progress toward the Committee’s 2 percent objective but remains somewhat elevated.

The Committee seeks to achieve maximum employment and inflation at the rate of 2 percent over the longer run. The Committee judges that the risks to achieving its employment and inflation goals are roughly in balance. The economic outlook is uncertain, and the Committee is attentive to the risks to both sides of its dual mandate.”

Inflation risks for 2025 are evolving. The policy risks for the central bank had recently been between inflation (decreasing risks) and concerns regarding the health of the labor market (risks rising). However, the 2024 election result changes this outlook somewhat. In particular, the election increases the probability of additional economic growth, a tighter labor market, larger government deficits, and higher tariffs. All of these factors can be inflationary, even if they yield other macroeconomic benefits.

Consequently, the Fed will need to recalibrate its economic and policy outlook given the large number of changes that markets have digested in just the past week alone. In particular, how far will the Fed ultimately cut into 2025 and perhaps 2026? A 3% terminal federal funds rate is unlikely. Some commentators have suggested a 4% rate would at least be a threshold of reevaluation. NAHB’s outlook is for a terminal rate of 3.25%, perhaps 3.5%. However, that decision, or destination, will be dependent on factors like tariff adoption.

Markets and analysts will receive additional information at the conclusion of the December Fed meeting, which will include an update of the central bank’s Summary of Economic Projections. Given the election discussion, is worth noting that the Fed does not try to anticipate changes to future fiscal policy. The Fed will study and model anticipated changes, but such impacts would not be formally incorporated into the Fed’s outlook until such proposals are, at the very least, fully detailed and analyzed. All market participants should be aware that rising government debt levels will push nominal long-term interest rates higher.

While the question of the future policy path matters for long-term interest rates, there is a direct benefit to current easing like today’s rate cut. For example, the November rate reduction will be felt for builder and land developer loan conditions. Interest rates for such loans should move lower by approximately 25 in the coming weeks.

A reduction for the cost of builder and developer loans is a bullish sign for housing affordability. The pace of overall inflation has remained elevated due to the growth of housing/construction costs and elevated measures of shelter inflation, which can only be tamed in the long-run by increases in housing supply. Fed Chair Powell has previously noted it will take some time for rent cost growth to slow. Given recent tight financing conditions, however, the Fed noted that while consumer spending is resilient, “…activity in the housing sector has been weak.”

All things considered, with inflation having moved lower (the September core PCE measure of inflation is at 2.7%, down from 3.7% a year ago), there is clearly policy room for future rate reductions as the Fed normalizes monetary policy. A further cut to the federal funds rate in December, to a 4.5% top rate, seems likely. After that, given expected changes for fiscal policy and fiscal policy impacts, the Fed is likely to slow its pace of rate cuts, perhaps moving to one 25 basis point cut per quarter in 2025 to the ultimate terminal rate. As noted earlier, the level of this terminal rate is likely to be reevaluated in the coming months.

Discover more from Eye On Housing

Subscribe to get the latest posts sent to your email.


This article was originally published by a eyeonhousing.org . Read the Original article here. .

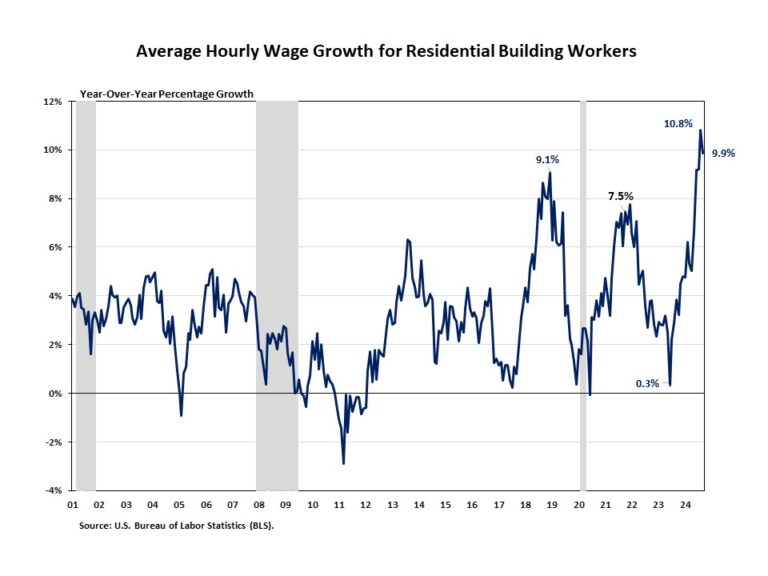
Wages for residential building workers grew at a fast pace of 9.9% in September, following a 10.8% gain in August. These year-over-year growth rates in the past four months were unprecedented in the history of the data series since 1990. After a 0.3% increase in June 2023, the YOY growth rate for residential building worker wages has been trending higher over the past year.

The ongoing skilled labor shortage in the construction labor market and lingering inflation impacts account for the recent acceleration in wage growth. However, the demand for construction labor remained weaker than a year ago. As mentioned in the latest JOLTS blog, the number of open construction sector jobs fell from a revised 328,000 in August to a softer 288,000 in September. Nonetheless, the ongoing skilled labor shortage continues to challenge the construction sector.

According to the Bureau of Labor Statistics report, average hourly earnings for residential building workers was $33.51 per hour in September 2024, increasing 9.9% from $30.5 per hour a year ago. This was 19.2% higher than the manufacturing’s average hourly earnings of $28.12 per hour, 14.7% higher than transportation and warehousing ($29.21 per hour), and 8.1% lower than mining and logging ($36.46 per hour).

Discover more from Eye On Housing

Subscribe to get the latest posts sent to your email.


This article was originally published by a eyeonhousing.org . Read the Original article here. .

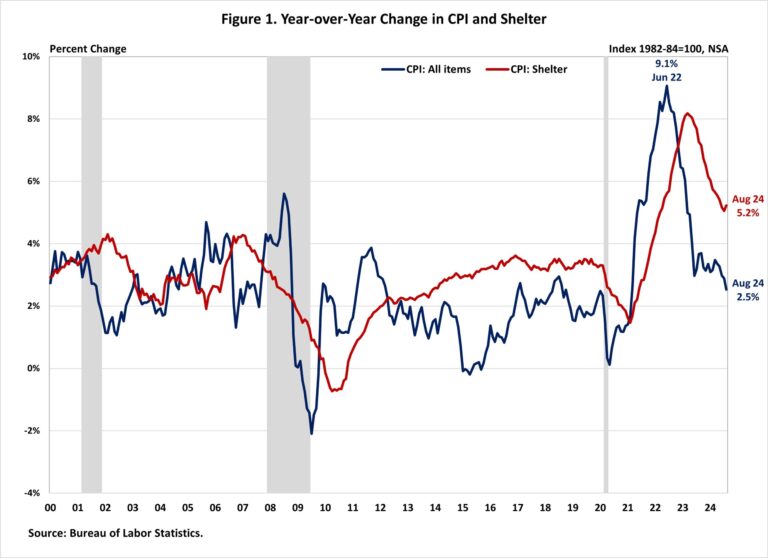
Inflation eased further in August, reaching a new 3-year low despite persistent elevated housing costs. This inflation report is seen as the final key piece of data before the Fed’s meeting next week. The headline reading provides another dovish signal for future monetary policy, after recent signs of weakness in job reports.

Although shelter costs have been trending downward since peaking in early 2023, they continue to exert significant upward pressure on inflation, contributing over 70% of the total 12-month increase in core inflation. As consistent disinflation and a cooling labor market bring the economy into better balance, the Fed is likely to further solidify behind the case for rate cuts, which could help ease some pressure on the housing market.

Though shelter remains the primary driver of inflation, the Fed has limited ability to address rising housing costs, as these increases are driven by a lack of affordable supply and increasing development costs. Additional housing supply is the primary solution to tame housing inflation. However, the Fed’s tools for promoting housing supply are constrained.

In fact, further tightening of monetary policy would hurt housing supply because it would increase the cost of AD&C financing. This can be seen on the graph below, as shelter costs continue to rise at an elevated pace despite Fed policy tightening. Nonetheless, the NAHB forecast expects to see shelter costs decline further in the coming months, as an additional apartment supply reaches the market.  This is supported by real-time data from private data providers that indicate a cooling in rent growth.

The Bureau of Labor Statistics reported that the Consumer Price Index (CPI) rose by 0.2% in August on a seasonally adjusted basis, the same increase as in July. Excluding the volatile food and energy components, the “core” CPI increased by 0.3% in August, after a 0.2% increase in July.

The price index for a broad set of energy sources fell by 0.8% in August, with declines in electricity (-0.7%), gasoline (-0.6%) and natural gas (-1.9%). Meanwhile, the food index rose 0.1%, after a 0.2% increase in July. The index for food away from home increased by 0.3% while the index for food at home remained unchanged.

The index for shelter (+0.5%) continued to be the largest contributor to the monthly increase in all items index. Other top contributors that rose in August include indexes for airline fares (+3.9%) and motor vehicle insurance (+0.6%). Meanwhile, the top contributors that experienced a decline include indexes for used cars and trucks (-1.0%), household furnishings and operations (-0.3%), medical care (-0.1%) and communication (-0.1%). The index for shelter makes up more than 40% of the “core” CPI. The index saw a 0.5% rise in August, following an increase of 0.4% in July. The indexes for owners’ equivalent rent (OER) increased by 0.5% and rent of primary residence (RPR) rose by 0.4% over the month. These gains have been the largest contributors to headline inflation in recent months.

During the past twelve months, on a non-seasonally adjusted basis, the CPI rose by 2.5% in August, following a 2.9% increase in July. This was the slowest annual gain since February 2021. The “core” CPI increased by 3.2% over the past twelve months, the same increase as in July. The food index rose by 2.1%, while the energy index fell by 4.0%, ending five consecutive months of year-over-year increases for the energy index since February 2024.

NAHB constructs a “real” rent index to indicate whether inflation in rents is faster or slower than overall inflation. It provides insight into the supply and demand conditions for rental housing. When inflation in rents is rising faster than overall inflation, the real rent index rises and vice versa. The real rent index is calculated by dividing the price index for rent by the core CPI (to exclude the volatile food and energy components).

In August, the Real Rent Index rose by 0.1%, after a 0.3% increase in July. Over the first eight months of 2024, the monthly growth rate of the Real Rent Index averaged 0.1%, slower than the average of 0.2% in 2023.

Discover more from Eye On Housing

Subscribe to get the latest posts sent to your email.


This article was originally published by a eyeonhousing.org . Read the Original article here. .

The homeownership rate for multigenerational households surpassed that of all other family household types in 2022 and now stands at 74.2%, exceeding the homeownership rate of other family households of 73.9%. Just a decade ago, the homeownership rate for multigenerational stood at 69.3%, second to other family households at 71.3%.

Multigenerational households are defined by the Census Bureau as households with three or more generations living together. In this post, NAHB used the American Community Survey (ACS) 1-year estimates from 2012 to 2022 to estimate the homeownership rates (which is calculated as the total number of owner-occupied units divided by the total number of applicable households) for different household types.

In 2012, the homeownership rate for multigenerational households stood at 69.3%, 2 percentage points (pp) below the 71.3% homeownership rate for other family households. The gap in homeownership rates between these household types remained with higher rates for other family households until 2021. By 2022, the gap inverted with 74.2% of multigenerational households owning homes versus 73.9% of other family households. This represents about a 5 pp increase in homeownership rate for multigenerational households over the decade compared to a 2.6 pp increase for other family households.

The primary factor that explains the rise in the multigenerational household homeownership rate is the availability of more capital during the period of low interest rates in 2021. While the median family income for multigenerational households consistently exceeds that of other family households’ income due to resource pooling, this difference has widened over time. For example, real median income for multigenerational households and other family households in 2012 were $63,643 and $62,633, respectively, with a difference of about $1,000. By 2022, this difference widened almost twelvefold to $11,778, with multigenerational households earning $103,501 and other family households earning $91,723.

Changes in family structure can be ruled out as a factor in this difference as the average household size has remained constant over the decade with an average of 5.1 people per multigenerational household, of which two are working members, while other family households have had an average of 3.1 people and 1.5 working members. This suggests that the income per person in a multigenerational household has been rising faster than other family households.

Income pooling has also buffered multigenerational households through rising home prices despite the higher prevalence of these households in more cost burdened areas. The chart below shows a strong correlation between the owner housing cost burdens and the incidence of multigenerational households. States with larger shares of housing cost burdened households (those that spend more than 30% of their income on housing) also have the higher shares of multigenerational households.

The faster growing income of multigenerational households also helped them afford more expensive homes in recent years, compared to other family households.  Looking at homeowners that moved into owned properties within the year (as a proxy for recent homebuyers), the median home values for multigenerational households have gone from $165,000 in 2012 to $400,000 in 2022. In comparison, the median home values for other family homebuyers went from $180,000 to $380,000. In other words, multigenerational households now pay $20,000 more for a home. However, because they have a higher pooled household income, their estimated home price-to-income (HPI) ratio remains lower than that of other family households.

To conclude, the rising homeownership rate among multigenerational households highlights their financial resilience and adaptability in the face of changing economic conditions. Despite living in less affordable states, these households leverage their pooled incomes to navigate higher home prices effectively. The significant increase in their median income over the past decade has enabled them to capitalize on favorable mortgage rates and propel their homeownership rate to a new decade high.

Footnote:

Discover more from Eye On Housing

Subscribe to get the latest posts sent to your email.


This article was originally published by a eyeonhousing.org . Read the Original article here. .


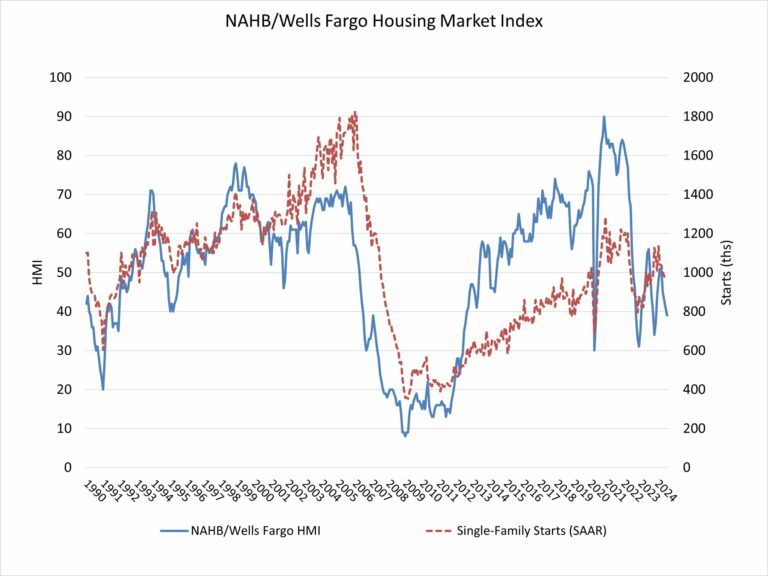
A lack of affordability and buyer hesitation stemming from elevated interest rates and high home prices contributed to a decline in builder sentiment in August.

Builder confidence in the market for newly built single-family homes was 39 in August, down two points from a downwardly revised reading of 41 in July, according to the National Association of Home Builders (NAHB)/Wells Fargo Housing Market Index (HMI) released today. This is the lowest reading since December 2023.

Almost three-quarters of the responses to the August HMI were collected during the first week of the month when interest rates averaged 6.73%, according to Freddie Mac. Mortgage rates declined notably the following week to 6.47%, the lowest reading since May 2023.

Challenging housing affordability conditions remain the top concern for prospective home buyers in the current reading of the HMI, as both present sales and traffic readings showed weakness. However, with current inflation data pointing to interest rate cuts from the Federal Reserve and mortgage rates down markedly in the second week of August, buyer interest and builder sentiment should improve in the months ahead.

The August HMI survey also revealed that 33% of builders cut home prices to bolster sales in August, above the July rate of 31% and the highest share in all of 2024. However, the average price reduction in August held steady at 6% for the 14th straight month. Meanwhile, the use of sales incentives increased to 64% in August from 61% in July, and this was the highest level since April 2019.

Derived from a monthly survey that NAHB has been conducting for more than 35 years, the NAHB/Wells Fargo HMI gauges builder perceptions of current single-family home sales and sales expectations for the next six months as “good,” “fair” or “poor.” The survey also asks builders to rate traffic of prospective buyers as “high to very high,” “average” or “low to very low.” Scores for each component are then used to calculate a seasonally adjusted index where any number over 50 indicates that more builders view conditions as good than poor.

The HMI index charting current sales conditions in August fell two points to 44 and the gauge charting traffic of prospective buyers also declined by two points to 25. The component measuring sales expectations in the next six months increased one point to 49.

Looking at the three-month moving averages for regional HMI scores, the Northeast fell four points to 52, the Midwest dropped four points to 39, the South decreased two points to 42 and the West held steady at 37. The HMI tables can be found at nahb.org/hmi.

Discover more from Eye On Housing

Subscribe to get the latest posts sent to your email.


This article was originally published by a eyeonhousing.org . Read the Original article here. .

Q: I am the personal representative of my dad’s estate that is going through probate. I have a question about the seller’s disclosure statement. I lived in the house when I was a kid/teenager. I moved out when I turned 18, 40-plus years ago. I have never been on the title to the property. Do I still need to fill out a seller’s disclosure statement because I lived in the house?

A: Normally when a property is to be transferred (sold) because of an order by a probate court in the administration of an estate; the seller/executor/personal representative is exempt from filling out a seller’s disclosure statement except when they have lived in the property, as an adult, even if they had no ownership in it. As per the Michigan Association of Realtors legal counsel, an adult who has no ownership in the property and only lived in the home as a child/teenager or college student is exempt from filling out a seller’s disclosure statement. As always, consult an attorney when dealing with legal matters, especially an estate.

Q: We are going to be selling our home this year. My son-in-law says we should try selling it ourselves. I’m not comfortable doing that. Are there any statistics that show what the success rate is with for sale by owners?

A: That’s a good question. FSBOs (for sale by owner) sales accounted for 7% of home sales in 2023. The typical FSBO home sold for $310,000 compared to $405,000 for agent-assisted home sales, according to the National Association of Realtors. This sales price differential between for sale by owner and agent-assisted home sales has been going on for years. Sure, you can go in thinking that you will be saving a 5% to 6% negotiable commission, but on the other end, you are losing over 23% in sales price.

Market update

March’s market update for Macomb County and Oakland County’s housing market (house and condo sales) is as follows: In Macomb County, the average sales price was up by more than 6% and Oakland County’s average sales price was up by more than 5%. Macomb County’s on-market inventory was down by more than 30% and Oakland County’s on-market inventory was down by more than 28%. Macomb County’s average days on market was 33 days and Oakland County’s average days on market was 34 days. Closed sales in Macomb County were down by almost 26% and closed sales in Oakland County were down by almost 15%. The closed sales continue to be down as a direct result of the continued low inventory. Demand still remains high. (All comparisons are month to month, year to year.)

By the long-standing historical definition from the National Association of Realtors, which has been in existence since 1908, a buyer’s market is when there is a seven-month supply or more of inventory on the market. A balanced market between buyers and sellers is when there is a six-month supply of inventory. A seller’s market is when there is a five-month or less supply of inventory. Inventory has continued to stay low. In March, the state of Michigan inventory was at 1.6 months of supply. Both Macomb and Oakland county’s inventories were at 1.2 months. As you can see, by definition, it is not a buyer’s market.

Steve Meyers is a real estate agent/Realtor at RE/MAX First in Shelby Twp. and is a member of the RE/MAX Hall of Fame. He can be contacted with questions at 586-997-5480 or Steve@MeyersRealtor.com You also can visit his website: AnswersToRealEstateQuestions.com.


This article was originally published by a www.theoaklandpress.com . Read the Original article here. .

Pin It