Tag

Quarter

Browsing


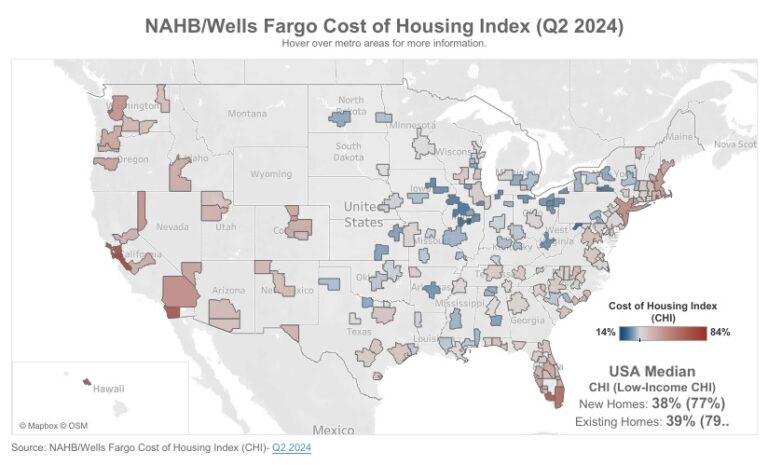
NAHB’s Cost of Housing Index (CHI) highlights the burden that housing costs represent for middle and low-income families. In the second quarter of 2024, the CHI found that a family earning the nation’s median income of $97,800 must spend 38% of its income to cover the mortgage payment on a median-priced new single-family home. Because a typical existing home in the second quarter was more expensive ($422,100) than a typical newly built home ($412,300), the CHI for existing homes was higher, at 39%. 

Low-income families, defined as those earning only 50% of median income, would have to spend 77% of their earnings to pay for a new home and 79% for an existing one.

The latest results reveal that affordability has worsened for existing homes. A typical family needed 39% of its income to pay for a median-priced existing home in the second quarter, up from 36% in the first quarter. A low-income family needed 79% of its income vs. 71% in the previous quarter. In contrast, the CHI and low-income CHI for new homes remained unchanged between the first and second quarters of 2024, at 38% and 77%, respectively.

Additionally, CHI is produced for existing homes in 176 metropolitan areas, breaking down the percentage of a family’s income needed to make a mortgage payment in each area based on the local median existing home price and median income. Percentages are also calculated for low-income families in these markets.

In 14 out of 176 markets in the second quarter, the typical family is severely cost-burdened (must pay more than 50% of their income on a median-priced existing home).  In 89 other markets, such families are cost-burdened (need to pay between 31% and 50%). There are 73 markets where the CHI is 30% of earnings or lower.

The Top Five Severely Cost-Burdened Markets

San Jose-Sunnyvale-Santa Clara, Calif. was the most severely cost-burdened market on the CHI during the second quarter, where 94% of a typical family’s income is needed to make a mortgage payment on an existing home. This was followed by:

• San Francisco-Oakland-Berkeley, Calif. (79%)
• San Diego-Chula Vista-Carlsbad, Calif. (76%)
• Urban Honolulu, Hawaii (76%)
• Naples-Marco Island, Fla. (74%)

Low-income families would have to pay between 147% and 188% of their income in all five of the above markets to cover a mortgage.

The Top Five Least Cost-Burdened Markets

By contrast, Decatur, Ill., was the least cost-burdened market on the CHI, where families needed to spend just 15% of their income to pay for a mortgage on an existing home. Rounding out the least burdened markets are:

• Cumberland, Md.-W.Va. (17%)
• Springfield, Ill. (18%)
• Elmira, N.Y. (18%)
• Peoria, Ill. (19%)
• Binghamton, N.Y. (tied at 19%)

Low-income families in these markets would have to pay between 30% and 39% of their income to cover the mortgage payment for a median priced existing home.

Visit nahb.org/chi for tables and details.

Discover more from Eye On Housing

Subscribe to get the latest posts sent to your email.


This article was originally published by a eyeonhousing.org . Read the Original article here. .


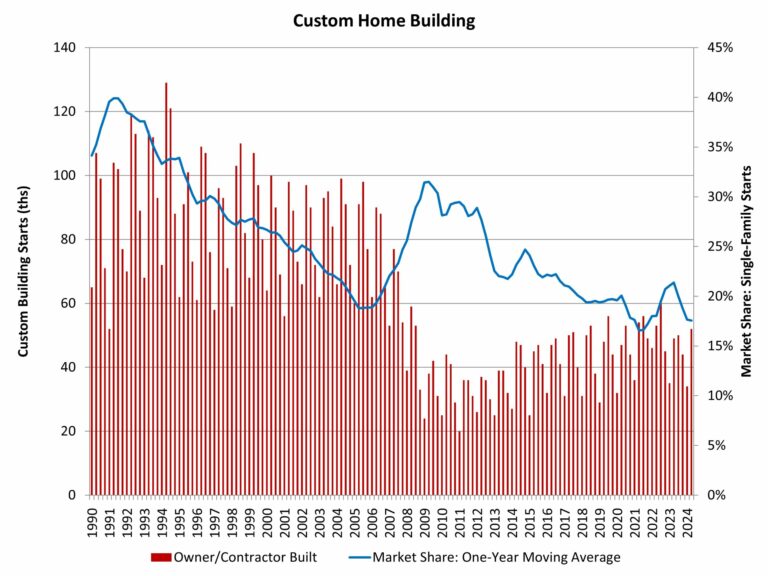
NAHB’s analysis of Census Data from the Quarterly Starts and Completions by Purpose and Design survey indicates gains for custom home building after some recent slowing. Custom home building typically involves home buyers less sensitive to changes for interest rates.

There were 52,000 total custom building starts during the second quarter of 2024. This marks an almost 6% increase compared to the second quarter of 2023 and the best reading since the third quarter of 2022. Over the last four quarters, custom housing starts totaled 180,000 homes, a 5% decline compared to the prior four quarter total (189,000) due to weakness in prior quarters.

After share declines due to a rise in spec building in the wake of the pandemic, the market share for custom homes increased until 2023 and then entered a period of retrenchment. As measured on a one-year moving average, the market share of custom home building, in terms of total single-family starts, has fallen back to just under 18%. This is down from a prior cycle peak of 31.5% set during the second quarter of 2009 and a 21% local peak rate at the beginning of 2023.

Note that this definition of custom home building does not include homes intended for sale, so the analysis in this post uses a narrow definition of the sector. It represents home construction undertaken on a contract basis for which the builder does not hold tax basis in the structure during construction.

Discover more from Eye On Housing

Subscribe to get the latest posts sent to your email.


This article was originally published by a eyeonhousing.org . Read the Original article here. .


During the second quarter of 2024, credit for residential Land Acquisition, Development & Construction (AD&C) continued to tighten and became even more expensive for most types of loans, according to NAHB’s survey on AD&C Financing. The survey was conducted in July and asked specifically about financing conditions in the second quarter, predating the release of some relatively weak economic data that has raised prospects for monetary policy easing.

The net easing index derived from the survey posted a reading of -33.7 in the second quarter (the negative number indicating that credit was tighter than in the previous quarter). The comparable net easing index based on the Federal Reserve’s survey of senior loan officers posted a similar result, with a reading of -23.8—marking the tenth consecutive quarter of borrowers and lenders both reporting tightening credit conditions.

According to the NAHB survey, the most common ways in which lenders tightened in the second quarter were by reducing the amount they are willing to lend, and by lowering the loan-to-value (or loan-to-cost) ratio, each reported by 85% of builders and developers. After those two ways of tightening, three others tied for third place: increasing documentation, increasing the interest rate, and requiring personal guarantees or other collateral unrelated to the project, each reported by exactly half of the borrowers.

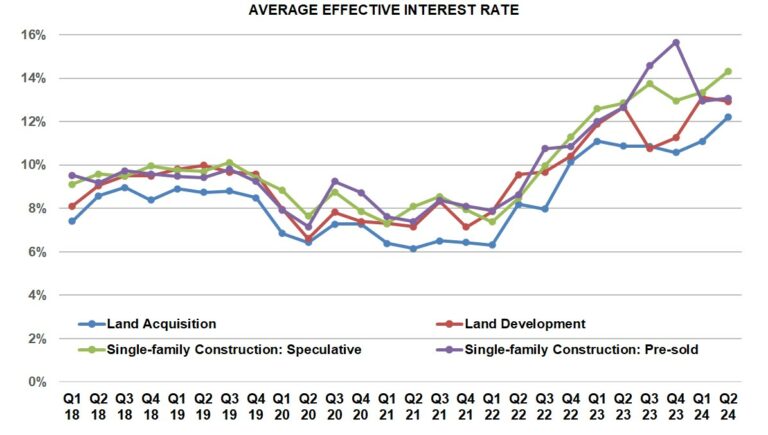
As is often the case, as credit becomes less available it also tends to become more expensive. In the second quarter, the contract interest rate increased on all four categories of AD&C loans tracked in the NAHB survey: from 8.40% in 2024 Q1 to 9.28% on loans for land acquisition, from 8.07% to 9.05% on loans for land development, from 8.24% to 8.98% on loans for speculative single-family construction, and from 8.38% to 8.55% on loans for pre-sold single-family construction.

In addition to the contract rate, initial points charged on the loans can be an important component of the overall cost of credit, especially for loans paid off as quickly as typical single-family construction loans. Trends on average initial points were mixed in the second quarter. The average charge on loans for land acquisition was unchanged at 0.88%. The average declined from 0.85% to 0.70% on loans for land development, and from 0.57% to 0.47% on loans for pre-sold single-family construction. On the other hand, on loans for speculative single-family construction, average initial points increased from 0.76% to 0.89%.

Irrespective of changes in points, increases in the underlying contract rate were sufficient to drive up the average effective interest rate (calculated taking both contract rate and initial points into account), on three of the four categories of AD&C loans in the second quarter. The average effective rate increased from 11.09% to 12.22% on loans for land acquisition, from 13.35% to 14.32% on loans for speculative single-family construction, and from 12.95% to 13.08% on loans for pre-sold single-family construction. Meanwhile, the average effective rate declined on loans for land development—from 13.10% in 2024 Q1 to 12.93%.

The average effective rates on loans for land acquisition and speculative single-family construction in the second quarter of 2024 were the highest they’ve been since NAHB began collecting the information in 2018. However, there’s a reasonable chance the situation will improve in the third and fourth quarters, as the Federal Reserve has begun signaling its intent to cut rates later this year.

More detail on credit conditions for builders and developers is available on NAHB’s AD&C Financing Survey web page.

Discover more from Eye On Housing

Subscribe to get the latest posts sent to your email.


This article was originally published by a eyeonhousing.org . Read the Original article here. .


According to the Federal Reserve Board’s July 2024 Senior Loan Officer Opinion Survey (SLOOS), lending standards were essentially unchanged for all residential real estate (RRE) categories in the second quarter of 2024.  However, demand for RRE loans remained modestly weaker across all categories in the quarter.  Lending conditions were significantly tighter, and loan demand modestly was weaker across all commercial real estate (CRE) loan categories.  Nevertheless, language from the most recent Federal Open Market Committee (FOMC) suggest that cuts to the federal funds rate are imminent which will be welcomed relief for the real estate market and will help stimulate future loan activity.

Residential Real Estate (RRE)

Four of the seven RRE categories (GSE-eligible, non-Qualified Mortgage or QM jumbo, Non-QM non-jumbo, and Subprime)recorded a net share of banks reported tighter lending standards in Q2 2024 as neutral (i.e., 0%) . The other three categories, which included government (i.e., issued by FHFA, Department of Veteran Affairs, USDA, etc.), QM jumbo, and QM non-jumbo non-GSE eligible recorded a negative reading which means that more banks reported looser rather than tighter conditions.

Six of the seven categories of RRE loans showed a decrease in net tightening from Q1 2024 to Q2 2024, with the only exception being GSE-eligible which increased 1.8 percentage points.  The largest drop in the net tightening percentage occurred for Non-QM jumbo which fell 9.8 percentage points (pp) from 9.8% in Q1 2024 to 0% in Q2 2024.

All RRE categories reported net weaker demand in Q2 2024.  The survey has shown that banks have indicated weaker demand for at least 12 consecutive quarters for all RRE categories going back to Q2 2021 (Subprime leads all RRE categories at 16 consecutive quarters).

Commercial Real Estate (CRE)

Banks reported significantly tighter lending conditions for both multifamily as well as all CRE construction & development loans in Q2 2024.  However, both categories showed less net tightening than they did a quarter before, most noticeably multifamily falling 11.7 percentage points.  Nevertheless, it has been 10 consecutive quarters of tighter lending conditions for construction & development and 9 consecutive quarters for multifamily.

For multifamily, 17.5% of banks reported net weakening of demand for loans which is 16.4 percentage points lower compared to Q1 2024.  As for construction & development loans, 15.9% of banks reported net weakening of demand for loans which was little changed from the previous quarter.  Weaker demand has persisted for roughly the last two years for construction & development (10 consecutive quarters) and multifamily (8 consecutive quarters).

Special Questions

The Federal Reserve included a set of special questions this quarter which asked banks “to describe the current level of lending standards at your bank relative to the range of standards that has prevailed between 2005 and the present.”  Effectively, they are asking banks to think about the median lending standards over the last two decades and determine where do conditions today rank on this continuum.  On balance, banks indicated that the current level of lending standards is located at the tighter end of this range for all loan categories, including CRE and RRE loans.

Discover more from Eye On Housing

Subscribe to get the latest posts sent to your email.


This article was originally published by a eyeonhousing.org . Read the Original article here. .


Confidence in the market for new multifamily housing declined year-over-year in the second quarter of 2024, according to results from the Multifamily Market Survey (MMS) released today by the National Association of Home Builders (NAHB).  The MMS produces two separate indices:  The Multifamily Production Index (MPI) had a reading of 44, a decrease of 12 points year-over-year, while the Multifamily Occupancy Index (MOI) had a reading of 81, falling eight points year-over-year.

Multifamily developers are less optimistic than they were at this time last year, given high interest rates and limited financing availability to develop multifamily properties.  However, financial markets may become more stable later in the year, as recent weak economic data make it more likely that the Federal Reserve will cut interest rates.

Multifamily Production Index (MPI)

The MPI is a weighted average of four key market segments: three in the built-for-rent market (garden/low-rise, mid/high-rise, and subsidized) and the built-for-sale (or condominium) market.  The survey asks multifamily builders to rate the current conditions as “good”, “fair”, or “poor” for multifamily starts in markets where they are active.  The index and all its components are scaled so that a number above 50 indicates that more respondents report conditions as good rather than poor.

Even though all four of the components posted year-over-year declines in the second quarter, sentiment about production of garden/low-rise apartments and subsidized apartments remained in positive territory above 50. The component measuring garden/low-rise fell 11 points to 53, the component measuring subsidized units decreased four points to 51, the component measuring built-for-sale units posted a seven-point decline to 38, and the component measuring mid/high-rise units dropped 18 points to 29 (Figure 1).

Multifamily Occupancy Index (MOI)

The MOI is a weighted average of the three built-for-rent market segments (garden/low-rise, mid/high-rise and subsidized).  The survey asks multifamily builders to rate the current conditions for occupancy of existing rental apartments, in markets where they are active, as “good”, “fair”, or “poor”.  Similar in nature to MPI, the index and all its components are scaled so that a number above 50 indicates more respondents report that occupancy is good than report it as poor. 

Although still well above 50, all three components for the MOI experienced year-over-year declines.  The component measuring garden/low-rise fell nine points to 82, mid/high-rise units decreased seven points to 76, and subsidized units decreased six points to 85 (Figure 2).

The MMS was re-designed last year to produce results that are easier to interpret and consistent with the proven format of other NAHB industry sentiment surveys.  Until there is enough data to seasonally adjust the series, changes in the MMS indices should only be evaluated on a year-over-year basis.

Please visit NAHB’s MMS web page for the full report.

Discover more from Eye On Housing

Subscribe to get the latest posts sent to your email.


This article was originally published by a eyeonhousing.org . Read the Original article here. .

Pin It