Tag

Production

Browsing


Housing starts edged lower last month as average monthly mortgage rates increased a quarter-point from 6.18% to 6.43% between September and October, according to Freddie Mac.

Overall housing starts decreased 3.1% in October to a seasonally adjusted annual rate of 1.31 million units, according to a report from the U.S. Department of Housing and Urban Development and the U.S. Census Bureau.

The October reading of 1.31 million starts is the number of housing units builders would begin if development kept this pace for the next 12 months. Within this overall number, single-family starts decreased 6.9% to a 970,000 seasonally adjusted annual rate. On a year-to-date basis, single-family construction is up 9.3%. The volatile multifamily sector, which includes apartment buildings and condos, increased 9.6% to an annualized 341,000 pace but are down 29.3% on a year-to-date basis.

Although housing starts declined in October, builder sentiment improved for a third straight month in November as builders anticipate an improved regulatory environment in 2025 that will allow the industry to increase housing supply. Further interest rate cuts from the Federal Reserve through 2025 should result in lower interest rates for construction and development loans, helping to lead to a stabilization for apartment construction and expansion for single-family home building.

While multifamily starts increased in October, the number of apartments under construction is down to 821,000, the lowest count since March 2022 and down 18.9% from a year ago. In October, there were 1.8 apartments that completed construction for every one apartment that started construction. The three-month moving average reached a ratio of 2 in October.

There were 644,000 single-family homes under construction in October, down 3.6% from a year ago and down 22% from the peak count in the Spring of 2022.

On a regional and year-to-date basis, combined single-family and multifamily starts are 10.4% higher in the Northeast, 1.7% lower in the Midwest, 5.0% lower in the South due to hurricane effects, and 4.4% lower in the West.

Overall permits decreased 0.6% to a 1.42 million unit annualized rate in October. Single-family permits increased 0.5% to a 968,000 unit rate and are up 9.4% on a year-to-date basis. Multifamily permits decreased 3.0% to an annualized 448,000 pace.

Looking at regional data on a year-to-date basis, permits are 0.9% higher in the Northeast, 3.9% higher in the Midwest, 2.4% lower in the South and 4.8% lower in the West.

Discover more from Eye On Housing

Subscribe to get the latest posts sent to your email.


This article was originally published by a eyeonhousing.org . Read the Original article here. .

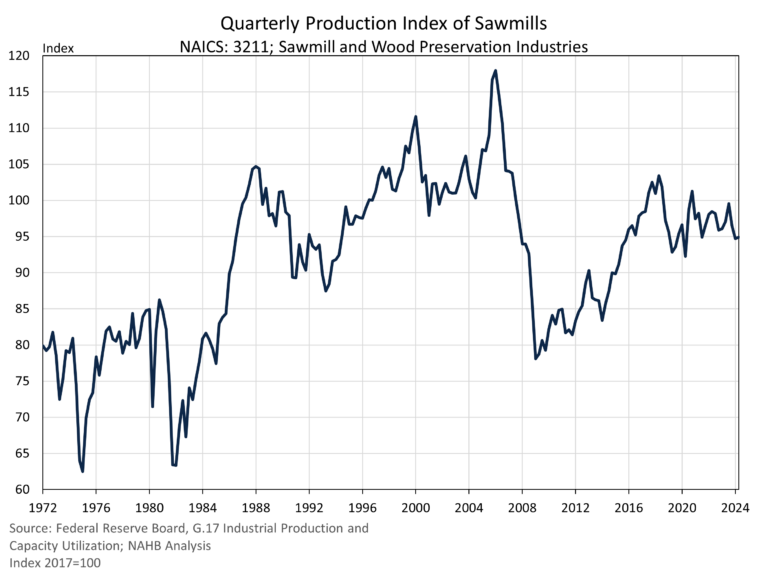
The production index for sawmills and wood preservation industries rose marginally by 0.2% in the second quarter of 2024. After falling for the previous two quarters, this was the first rise in real output since the third quarter of 2023 according to the G.17 data. The index was 2.2% lower than one year ago, the largest year-over-year decline since falling 4.7% in the fourth quarter of 2021.

Quarterly Survey of Sawmills Capacity Utilization

To provide a better understanding of the sawmill and wood preservation industries, the Census Bureau’s Quarterly Survey of Plant Capacity Utilization is another source of interest. This data comes from quarterly surveys of U.S. domestic manufacturing plants and includes a subindustry grouping of sawmills and wood preservation firms. The survey estimates utilization rates based on full production capability, meaning the utilizations rates are found by taking the market value of actual production during the quarter and dividing by an estimated market value of what the firm could have produced at full production capacity. In other words, the rate indicates how much production capacity is used to produce current output.

The sawmill and wood preservation industry full utilization rates jumped significantly over the quarter, up from 61.9% to 70.7%. Given this rise, it is surprising that production did not also increase significantly. Average plant hours per week in operation did rise for these firms, up from 47.9 hours in the first quarter to 57.7 hours in the second quarter.  

Employment

Employment at sawmill and wood preservation firms rose for the first time in six quarters, up to approximately 89,400 employees in the second quarter.  The Great Recession had a substantial impact on this industry, as employment fell from 105,630 in the first quarter of 2008 to a series low of 80,470 in the fourth quarter of 2009. Employment rose from this low to 91,000 in 2014 and has remained around this level for the last ten years.  

Capacity Index Estimate

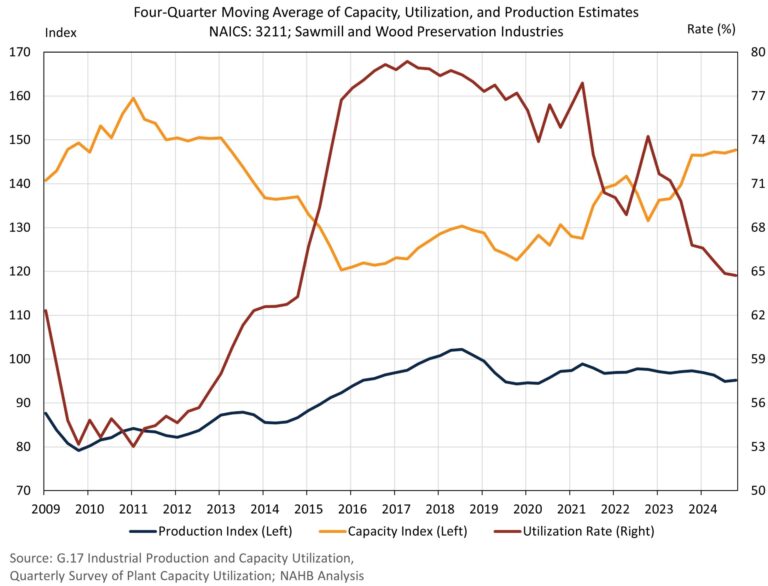
By combining the production index and utilization rate, we can compose a rough index estimate of what the current production capacity is for U.S. sawmills and wood preservation firms. Shown below is a quarterly estimate of the production capacity index. This capacity index measures the real output if all firms were operating at their full capacity.

Due to the volatility of the data, we compute a moving average of the utilization rate, production index and capacity index. These are four-quarter moving averages, which are shown below to provide a clearer picture of the industry.

Based on the data above, sawmill production capacity has increased from 2015 but remains lower than peak levels in 2011. Production by sawmills continues to be higher mainly because the mills are running at higher than historical levels of utilization, as shown in red above. Much of the addition in capacity has been recent, as utilization rates have fallen but production continues to run at higher levels. Despite the U.S. being largest producer of softwood lumber in North America, the current capacity and production levels do not meet the demand of U.S. consumers.

According to Census international trade data, imports remain critical to meeting U.S. demand for softwood lumber. In the month of September alone, imports of softwood lumber stood at 1.1 billion board feet. Canada was the primary country of origin, exporting 987 million board feet into the U.S. in September. The current Antidumping/Countervailing duty rate on these imports from Canada averages 14.5%. U.S. producers claim that Canadian softwood lumber production is subsidized by Canadian provincial governments, which allows Canadian producers to sell lumber at lower than normal market prices. The data indicates that since the expiration of the softwood lumber agreement in 2016, tariffs on Canadian softwood lumber have substantially benefited the U.S. lumber industry, allowing for expanded production capacity.

Discover more from Eye On Housing

Subscribe to get the latest posts sent to your email.


This article was originally published by a eyeonhousing.org . Read the Original article here. .
Pin It