Tag

Prices

Browsing


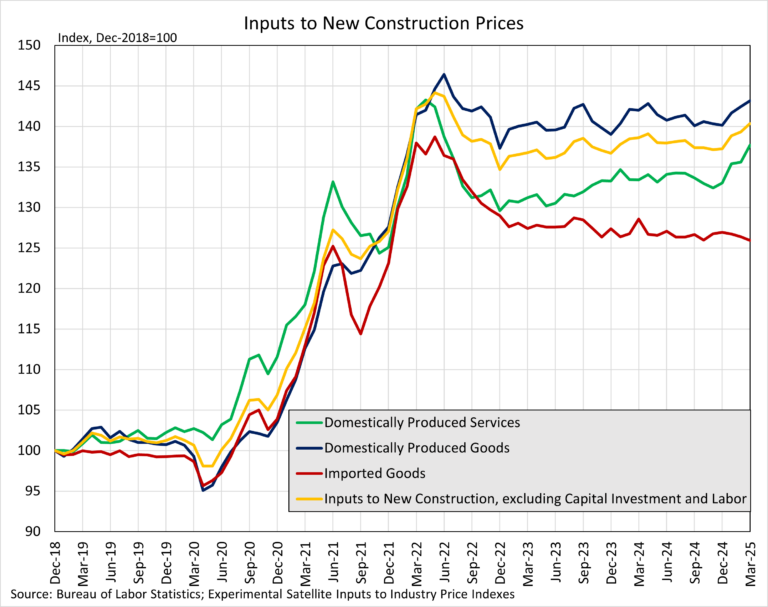
Prices for inputs to new residential construction—excluding capital investment, labor, and imports—were up 1.2% in January according to the most recent Producer Price Index (PPI) report published by the U.S. Bureau of Labor Statistics. The Producer Price Index measures prices that domestic producers receive for their goods and services, this differs from the Consumer Price Index which measures what consumers pay and includes both domestic products as well as imports.

The inputs to the New Residential Construction Price Index grew 1.1% from January of last year. The index can be broken into two components—the goods component increased 2.1% over the year, while services decreased 0.3%. For comparison, the total final demand index, which measures all goods and services across the economy, increased 3.5% over the year, with final demand with respect to goods up 2.3% and final demand for services up 4.1% over the year.

Input Goods

The goods component has a larger importance to the total residential construction inputs price index, representing around 60%. For the month, the price of input goods to new residential construction was up 1.6% in January. Monthly growth of the index was relatively low in the past two years, as this monthly increase was the largest since March of 2022 (3.3%).

The input goods to residential construction index can be further broken down into two separate components, one measuring energy inputs with the other measuring goods less energy inputs. The latter of these two components simply represents building materials used in residential construction, which makes up around 93% of the goods index.

The 2.1% yearly growth in the goods component can be attributed to the rise in the prices of building materials, which grew 2.3% over the year. Meanwhile, the price of energy inputs was 1.6% lower than last year. Between December and January, building materials increased 1.4%, while energy inputs increased 4.3%.

At the individual commodity level, the five commodities with the highest importance for building materials to the New Residential Construction Index were as follows: ready-mix concrete, general millwork, paving mixtures/blocks, sheet metal products, and wood office furniture/store fixtures. Compared to last year, ready-mix concrete was up 4.1%, wood office furniture/store fixtures up 4.7%, general millwork up 2.4%, paving mixtures/blocks up 8.6% while sheet metal products were up 0.4%.

For January, the commodity used in new residential construction that featured the highest price growth was an energy input, home heating oil and distillates, increasing 16.0%. The non-energy input that had the highest monthly price growth was paving mixtures and blocks, up 14.8%. This is likely a pass-through of increases in asphalt prices, which were up 6.9% in January.

Input Services

While prices of inputs to residential construction for services were down 0.3% over the year, they were up 0.5% in January from December. The price index for service inputs to residential construction can be broken out into three separate components: a trade services component, a transportation and warehousing services component, and a services excluding trade, transportation and warehousing component. The most significant component is trade services (around 60%), followed by services less trade, transportation and warehousing (around 29%), and finally transportation and warehousing services (around 11%). The largest component, trade services, was down 1.9% from a year ago. The services less trade, transportation and warehousing component was up 1.6% over the year.   Lastly, prices for transportation and warehousing services advanced 3.1% compared to January last year, the largest year-over-year increase since January of 2023.

Discover more from Eye On Housing

Subscribe to get the latest posts sent to your email.


This article was originally published by a eyeonhousing.org . Read the Original article here. .

Home price growth continued to slow in October, growing at a rate of 3.60% year-over-year, according to the S&P CoreLogic Case-Shiller Home Price Index (seasonally adjusted – SA). This marks a decline from the 3.90% growth rate recorded in September and represents the seventh consecutive drop in the annual growth rate since reaching a peak of 6.54% in March 2024. As shown in the graph below, the index level has experienced monthly declines since July. 

By Metro Area

In addition to tracking national home price changes, the S&P CoreLogic Index (SA) also reports home price indexes across 20 metro areas. Compared to last year, all 20 metro areas reported a home price increase.  There were 11 metro areas that grew more than the national rate of 3.60%. The highest annual rate was New York at 7.31%, followed by Chicago at 6.27% and Las Vegas at 5.93%. The smallest home price growth over the year was seen by Tampa at 0.41%, followed by Denver at 0.47%, and Dallas at 0.91%. 

By Census Division

A similar index, the Federal Housing Finance Agency Home Price Index (SA) publishes not only national data but also data by census division. The national year-over-year rate was 4.43% for October. Meanwhile, the division with the highest year-over-year rate was 6.95% in the Middle Atlantic, while the lowest was 2.30% in the Pacific. A three-month trend in rates is shown for each division below. The FHFA Home Price Index releases their metro and state data on a quarterly basis, which NAHB analyzed in a previous post. 

Discover more from Eye On Housing

Subscribe to get the latest posts sent to your email.


This article was originally published by a eyeonhousing.org . Read the Original article here. .

With the end of 2024 approaching, NAHB’s Eye on Housing is reviewing the posts that attracted the most readers over the last year. In April, Eric Lynch examined various macroeconomic and housing finance components and their responsiveness to changes in the federal funds rate.

As economist Milton Friedman once quipped, monetary policy has a history of operating with “long and variable lags.”[1] What Friedman was expressing is that it takes some time for the true effects of monetary policy, like the changing of the federal funds rate, to permeate completely through the larger economy. While some industries, like housing, are extremely rate-sensitive, there are others that are less so. Given the current inflation challenge, the question then becomes: how does monetary policy affect inflation across a diverse economy like the United States?

This was the question that Leila Bengali and Zoe Arnaut, researchers at the Federal Reserve Board of San Francisco (FSBSF), asked in a recent FSBSF economic letter article, “How Quickly Do Prices Response to Monetary Policy” [2]. The economists examined which components that make up the Personal Consumption Expenditures (PCE) Index[3], an inflation measurement produced by the Bureau of Economic Analysis (BEA), are the most and least responsive to changes in the federal funds rate. While the Federal Reserve makes decisions “based on the totality of the incoming data”[4] including the more popular Consumer Price Index (CPI)[5] produced by the Bureau of Labor Statistics (BLS), their preferred inflation measure is PCE. This is the reason why the researchers focused on this specific index.

Figure 1 represents how selected components would be affected over a four-year period if the federal funds rate increased by one percentage point.[6] The color of the bars is separated using the median cumulative percent price decline over this period: blue is the top 50% of all declines, while red is the bottom 50%.

Both housing components (owner and renter) are classified in red or ‘least-responsive’, which might appear to be counterintuitive given how the latest tightening cycle starting in early 2022 has affected the residential industry. The NAHB/Wells Fargo Housing Market Index (HMI) declined every month in 2022, mortgage rates rose almost to 8%, and existing home sales fell to historically low levels. However, as the shelter component of CPI remains elevated, this less than expected responsive nature of housing could partially explain why the dramatic increase in the federal funds rate has yet to push this part of inflation down further compared to other categories.

Figure 2 illustrates this point by showing both groups along with headline PCE inflation with their respective year-over-year changes since 2019. The blue shaded area is when the Federal Reserve lowered the federal funds rate, while the yellow vertical line is where the Fed started the most recent tightening cycle.

The most responsive grouping (as defined by Figure 1 above) has experienced greater volatility than the least responsive grouping over this period. Especially as home prices have experienced minimal declines, this would provide further evidence for the housing components of inflation (i.e., prices) being somewhat less responsive to monetary policy. It is important to note that this does not suggest that the overall housing industry is not interest rate sensitive, but rather, that other sectors like the financial sectors responded faster.

However, and NAHB has stated this repeatedly, this “less” than expected response for housing is a function of the microeconomic situation that housing is experiencing. Shelter inflation is elevated and slow to respond to tightening conditions because higher housing costs are due to more than simply macroeconomic and monetary policy conditions. In fact, the dominant and persistent characteristic of the housing market is a lack of supply. Also, higher interest rates hurt the ability of the home building sector to provide more supply and tame shelter inflation, by increasing the cost of financing of land development and residential construction. This may be the reason for the somewhat counterintuitive findings of the Fed researchers.

The Federal Reserve has a dual mandate[7] given by Congress, which instructs them to achieve price stability (i.e., controlling inflation) and maximize sustainable employment (i.e., controlling unemployment). To accomplish the first part, the Federal Reserve has targeted an annual rate of inflation at 2%.  As Figure 2 showcases, while the headline PCE remains above this target, the most responsive grouping of PCE is, in fact, below 2% and has been for many months. This leads one to conclude that what is preventing the Federal Reserve from achieving its desired inflation target is due to the least responsive components of the index.

Figure 3 details this case with the bars representing the contributions of the two groupings (most and least responsive) to headline PCE inflation and the yellow line is the federal funds rate. The researchers were able to draw two conclusions from this chart:

“[The] rate cuts from 2019 to early 2020 could have contributed upward price pressures starting in mid- to late 2020 and thus could explain some of the rise in inflation over this period.”
“The tightening cycle that began in March 2022 likely started putting downward pressure on prices in mid-2023 and will continue to do so in the near term.”

Nevertheless, even though there are some who suggest that these monetary policy lags have shortened[8], the researchers do not believe that the drop in inflation after the first rate hike in early-2022 was a direct effect of this policy action.

As evident by Figure 3, the fight to get inflation down to target is going to be much harder moving forward, especially given housing’s least responsive nature. As the researchers concluded, “[even] though inflation in the least responsive categories may come down because of other economic forces, less inflation is currently coming from categories that are most responsive to monetary policy, perhaps limiting policy impacts going forward.”

The Federal Reserve will have to weigh this question as 2024 continues: what are the trade-offs for reaching their inflation rate target to the larger economy if the remaining contributors of inflation are the least responsive to their policy actions?

More fundamentally, if housing (i.e., shelter inflation) is not responding as expected by the academic models, policymakers at the Fed (and more critically policymakers at the state and local level with direct control over issues like land development, zoning and home building) should define, communicate, and enact ways to permit additional housing supply to tackle the persistent sources of U.S. inflation – shelter.

The opinions expressed in this article do not necessarily reflect the views of the Federal Reserve Bank of San Francisco or the Federal Reserve System.

Notes:

[1] https://www.marketplace.org/2023/07/24/milton-friedmans-long-and-variable-lag-explained/#:~:text=long%20and%20variable%20lag.

[2] Bengali, L., & Arnaut, Z. (2024, April 8). How Quickly Do Prices Respond to Monetary Policy? Federal Reserve Bank of San Francisco.

[3]

[4]

[5]

[6] Specifically, the researchers used a statistical model called vector autoregression (VAR) which examines the relationship of multiple variables over time.  As a result, VAR models can produce what are known as impulse response functions (IRF) which can show how one variable (prices) responds to a shock from another (federal funds rate). Figure 1 is the cumulative effect (i.e., adding all four individual year effects together) of this process.

[7]

[8]

Discover more from Eye On Housing

Subscribe to get the latest posts sent to your email.


This article was originally published by a eyeonhousing.org . Read the Original article here. .
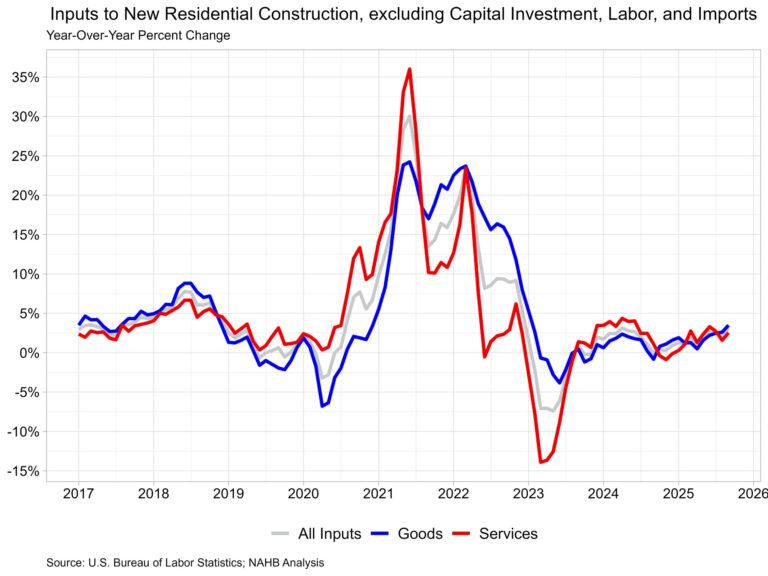

Prices for inputs to new residential construction—excluding capital investment, labor, and imports—were unchanged in November according to the most recent Producer Price Index (PPI) report published by the U.S. Bureau of Labor Statistics. Compared to a year ago, this index was up 0.7% in November after rising 0.3% in October.

The inputs to the new residential construction price index can be broken into two components­—one for goods and another for services. The goods component increased 1.2% over the year, while services decreased 0.3%. For comparison, the total final demand index increased 3.0% over the year in November, with final demand with respect to goods up 1.1% and final demand for services up 3.9% over the year.

Goods

The goods component has a larger importance to the total residential construction inputs price index, representing around 60%. The price of input goods to new residential construction was unchanged in November from October. The input goods to residential construction index can be further broken down into two separate components, one measuring energy inputs with the other measuring goods less energy inputs. The latter of these two components simply represents building materials used in residential construction, which makes up around 93% of the goods index.

Prices for inputs to residential construction, goods less energy, were up 2.3% in November compared to a year ago. This year-over-year increase was larger than in October (2.0%) and was the largest year-over-year increase since June earlier this year. The growth rate in November 2023 was 1.2%. The index for inputs to residential construction for energy fell 10.9% year-over-year in November, the fourth straight yearly decline in input energy prices.  

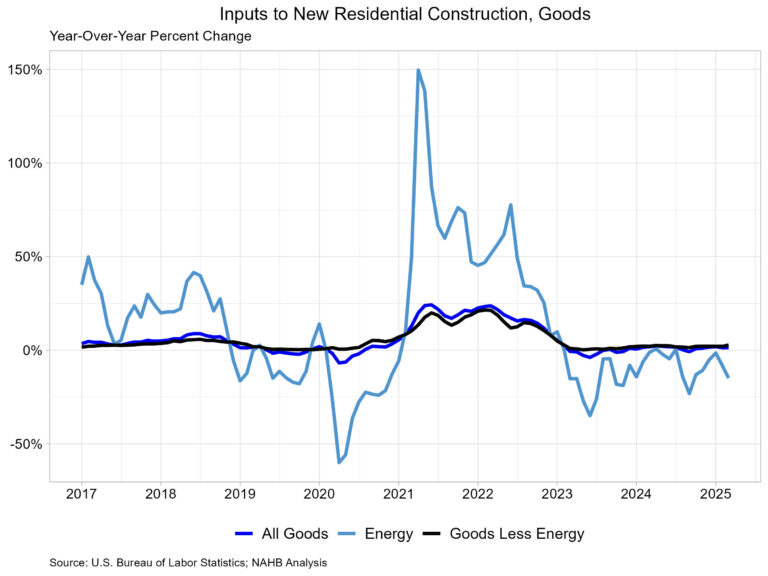
The graph below focuses on the data since the start of 2023 for residential goods inputs. Energy prices have continued to fall over the past year, with only two periods of growth in 2024.

At the individual commodity level, excluding energy, the five commodities with the highest importance for building materials to the new residential construction index were as follows: ready-mix concrete, general millwork, paving mixtures/ blocks, sheet metal products, and wood office furniture/store fixtures. Across these commodities, there was price growth across the board compared to last year. Ready-mix concrete was up 3.9%, wood office furniture/store fixtures up 3.4%, general millwork up 2.8%, paving mixtures/blocks up 1.6% and sheet metal products up 0.5%. Unsurprisingly, given how energy prices have trended this year, the input commodity that had the largest fall in price over the year was No. 2 diesel, which was down 20.6%.

Among lumber and wood products, the commodities with the highest importance to new residential construction were general millwork, prefabricated structural members, softwood veneer/plywood, softwood lumber (not edge worked) and hardwood veneer/plywood. The input commodity in residential construction that had the highest year-over-year percent change (across all input goods) in November was softwood lumber (not edge worked), which was 13.7% higher than November 2023. This is of particular note because none of the other top wood commodities had a year-over-year change above 3% in November. Lumber supplies have been driving prices higher over the past month as the sawmill industry continues to adjust to the mill closures that occurred earlier this year. Higher lumber demand as residential construction rebounds due to lower interest rates is likely to continue to increase lumber prices.

Services

Prices of inputs to residential construction for services, were unchanged in November from October. The price index for service inputs to residential construction can be broken out into three separate components: a trade services component, a transportation and warehousing services component, and a services excluding trade, transportation and warehousing component. The most significant component is trade services (around 60%), followed by services less trade, transportation and warehousing (around 29%), and finally transportation and warehousing services (around 11%). The largest component, trade services, compared to last year was down 1.2% in November after declining 1.5% in October.

Discover more from Eye On Housing

Subscribe to get the latest posts sent to your email.


This article was originally published by a eyeonhousing.org . Read the Original article here. .


Home price growth continued to slow in September, growing at a rate just below 4% year-over-year. The S&P CoreLogic Case-Shiller Home Price Index (seasonally adjusted – SA) posted a 3.89% annual gain, down from a 4.28% increase in August. The S&P CoreLogic Case-Shiller HPI year-over-year rate has decelerated for the seventh consecutive month, peaking at 6.54% in February 2024. Meanwhile, the Federal Housing Finance Agency Home Price Index (SA) grew at a rate of 4.36%, stagnant from the previous month.  

By Metro Area

In addition to tracking national home price changes, the S&P CoreLogic Index (SA) also reports home price indexes across 20 metro areas. Compared to last year, all 20 metro areas reported a home price increase.  There were 11 metro areas that grew more than the national rate of 3.89%. The highest annual rate was New York at 7.55%, followed by Cleveland at 7.13% and Chicago at 6.94%. The smallest home price growth over the year was seen by Denver at 0.22%, followed by Tampa at 0.99%, and Portland at 1.07%. 

By Census Division 

Monthly, the FHFA Home Price Index (SA) publishes not only national data but also data by census division. The highest year-over-year rate for September was 7.10% in the Middle Atlantic division, while the lowest was 1.16% in the West South Central division. Most divisions saw an increase from last month as shown in the chart below except for the West South Central and East North Central divisions. The FHFA Home Price Index releases their metro and state data on a quarterly basis, which NAHB analyzed in a previous post. 

Discover more from Eye On Housing

Subscribe to get the latest posts sent to your email.


This article was originally published by a eyeonhousing.org . Read the Original article here. .


Prices for inputs to new residential construction—excluding capital investment, labor, and imports—decreased 0.2% in October according to the most recent Producer Price Index (PPI) report published by the U.S. Bureau of Labor Statistics. Compared to a year ago, this index is up 0.3% in October after a decline of 0.1% in September.

The inputs to the new residential construction price index can be broken into two components­—one for goods and another for services. The goods component increased 0.7% over the year, while services decreased 0.4%. For comparison, the total final demand index increased 2.4% over the year for October, with final demand with respect to goods up 0.2% and final demand for services up 3.5% over the year.

Input Goods

The goods component has a larger importance to the total residential construction inputs price index, representing around 60%. The price of input goods to new residential construction was up 0.3% in October from September. The input goods to residential construction index can be further broken down into two separate components, one measuring energy inputs with the other measuring goods less energy inputs. The latter of these two components simply represents building materials used in residential construction, which makes up around 93% of the goods index.

Prices for inputs to residential construction, goods less energy, were up 2.0% in October compared to a year ago. This year-over-year increase was larger than in September (1.4%) and was the first percentage point increase in the year-over-year rate since April. The growth rate in October 2023 was 0.8%. The index for inputs to residential construction for energy fell 13.1% year-over-year in October, the third straight yearly decline in input energy prices.

The graph below focuses on the data since the start of 2023 for residential goods inputs. Energy prices have continued to fall over the past year, with only two periods of growth in 2024.

At the individual commodity level, excluding energy, the five commodities with the highest importance for building materials to the new residential construction index were as follows: ready-mix concrete, general millwork, paving mixtures/ blocks, sheet metal products, and wood office furniture/store fixtures. Across these commodities, there was price growth across the board compared to last year. Ready-mix concrete was up 3.7%, wood office furniture/store fixtures up 3.6%, general millwork up 2.8%, paving mixtures/blocks up 2.4% and sheet metal products up 0.6%.

Input Services

Prices of inputs to residential construction for services fell 1.0% in October from September. The price index for service inputs to residential construction can be broken out into three separate components: a trade services component, a transportation and warehousing services component, and a services excluding trade, transportation and warehousing component. The most significant component is trade services (around 60%), followed by services less trade, transportation and warehousing (around 29%), and finally transportation and warehousing services (around 11%). The largest component, trade services, compared to last year was down 1.5% in October after increasing 0.6% in September. The decline in October was the first decline since August 2023, when the trade services index was down 1.2%.

Discover more from Eye On Housing

Subscribe to get the latest posts sent to your email.


This article was originally published by a eyeonhousing.org . Read the Original article here. .

 All-cash purchases accounted for 7.9% of new home sales in the third quarter of 2024, marking the highest level this year but lowest level for the third quarter since 2022, according to NAHB analysis of the latest Census Quarterly Sales by Price and Financing report. Among mortgaged home sales, FHA-backed and VA-backed sales fell while conventional sales increased. This is in line with the overall trend observed in mortgage activity, as mortgage demand grew with moderating rates during this period. Despite the decline in total sales, the median purchase price of new homes (across all financing types) continued to increase in the third quarter.

Since the Federal Reserve began raising interest rates in early 2022, the share of all-cash new home sales has increased significantly, with an average of 8.7% amid this tightening cycle. The interest rate hikes have caused the average mortgage rate to more than double, surging from 3.1% in the fourth quarter of 2021 to 7.0% by the end of second quarter of 2024. The chart below illustrates how much more sensitive the all-cash share has become to changes in the federal funds rate since 2017. However, after peaking at 10.7% in the fourth quarter of 2022, the all-cash share has recently trended lower.

Although cash sales make up a relatively small portion of new home sales, they constitute a larger share of existing home sales. This share also increased significantly since the Fed began raising interest rates in early 2022. According to estimates from the National Association of Realtors, 30% of existing home transactions were all-cash sales in September 2024, up from 26% in August and 29% a year ago.

The share of FHA-backed sales fell from 13.0% to 11.9% in the third quarter of 2024, reaching the lowest level since the fourth quarter of 2022. This share remains below the post-Great Recession average of 17.0%. Meanwhile, the share of VA-backed sales also decreased, falling from 5.4% to 5.1%. Among declines in other types of new home financing, the share of conventional loans financed sales saw an increase in the third quarter of 2024, climbing from 73.9% to 75.1%, the highest level since the fourth quarter of 2022.

Price by Type of Financing

Different sources of financing also serve distinct market segments, which is revealed in part by the median new home price associated with each. In the third quarter, the national median sales price of a new home was $420,400. Split by types of financing, the median prices of new homes financed with conventional loans, FHA loans, VA loans, and cash were $466,100, $352,100, $404,000, and $401,600, respectively.

The purchase price of new homes financed with conventional and cash declined over the past year, while the price of homes financed with FHA loans and VA loans increased. The largest decline occurred in cash sales prices, which fell 21.1% over the year. This is in stark contrast to year-over-year price changes in the third quarter of 2022 and 2023, when median sales price rose 16.9% and 18.2% (see below).

Discover more from Eye On Housing

Subscribe to get the latest posts sent to your email.


This article was originally published by a eyeonhousing.org . Read the Original article here. .

New manufactured homes saw a decline in shipments in 2023 compared to the previous year. According to the Manufactured Housing Survey (MHS), 89,169 manufactured homes were shipped in 2023, a decrease of 21% from the 112,882 homes shipped in 2022. The Census defines a manufactured home as a movable dwelling, 8 feet or more wide and 40 feet or more long, designed to be towed on its own chassis, with transportation gear integral to the unit when it leaves the factory, and without need of a permanent foundation. No building permit is required for a manufactured home.

Despite the 2023 decline, the ratio of shipments to new single-family site-built home construction starts remained consistent between 1 to 9 and 1 to 10. In 2023, that number was 1 to 10, meaning that for every new manufactured home shipped, 10 new single-family site-built homes started construction. Of the total 2023 shipments, 35.7% (31,830 homes) were either sold or leased, while 2022 saw 46,696 (49%) being sold or leased.

Regionally, the South continued to receive the majority of shipments at 66%. The Midwest followed with 14%, the West with 11%, and the Northeast with 6%. Texas remained the leading state for shipments, accounting for 15,073 homes, which represents 17% of the total. Altogether, the top ten states comprised over 60% of the shipment share, highlighting a concentrated market presence.

Breaking down the types of manufactured homes shipped, 45% were single-section units. These homes had an average sales price of $84,800 and an average area of 1,038 square feet, translating to a price of $81.70 per square foot. In contrast, 54% of the shipments were multi-section homes, with an average sales price of $154,100 and a larger area of 1,748 square feet, equating to $88.16 per square foot. When compared to new single-family site-built homes started in 2023, which had an average price of $165.94 per square foot (excluding land value), multi-section manufactured homes are approximately 1.9 times less expensive per square foot.

Out of the total homes shipped, 70% (59,950 homes) were placed at their final destinations. Among the placed homes, 21% were titled as real estate property, while the majority, 76%, were classified as personal property. Additionally, only 29% of the placed homes were situated within a manufactured housing community. Census doesn’t have an official definition of a manufactured housing community, but as an example of the industry’s term of art, Law Insider defines it as “any area where two or more manufactured home lots are leased specifically for the use of manufactured homes”.

Looking into other characteristics of placed manufactured homes, over half (57%) had concrete footings. Pressure-treated wood and monolithic-slab foundations comprised 12% each, and basement or crawl space foundations was 4%. For homes not placed on concrete or slab foundations, the most common type of pier is concrete block (77%) while the majority (84%) were secured using anchors and tie-down straps, and 11% utilizing anchors and alternative foundations.

Discover more from Eye On Housing

Subscribe to get the latest posts sent to your email.


This article was originally published by a eyeonhousing.org . Read the Original article here. .

The Good Brigade/Getty Images; Illustration by Austin Courregé/Bankrate

Key takeaways

Existing-home sales in July 2024 rose 1.3 percent from the previous month, ending four straight months of declines, according to the National Association of Realtors.

The nationwide median sale price was $422,600, up 4.2 percent from last year and the highest July median on record.

Inventory in July continued to inch up, reaching a 4.0-month supply — a sign that buyers may be gaining more leverage in the market.

The housing market reversed course slightly in July 2024, showing a slight increase in sales for the first time in four months, a new report by the National Association of Realtors (NAR) shows. Sales of existing homes rose 1.3 percent from last month, which marks an end to four consecutive months of declines but is still 2.5 percent lower than one year ago. Meanwhile, the median home-sale price dropped slightly from June’s all-time high but still marked the highest median price on record for the month of July, according to NAR Chief Economist Lawrence Yun.

High mortgage rates have contributed to the sluggish sales figures. While rates have thankfully remained below the 8 percent mark briefly seen in October 2023, they are still hovering between 6.5 and 7 percent. The average rate on a 30-year fixed-rate loan was 6.62 percent as of August 21, according to Bankrate’s most recent survey of large lenders. Combined with the historically high prices, that means affordability challenges remain daunting for homebuyers.

The fate of the housing market in the coming months will be dictated in part by the direction of mortgage rates.
— Mark Hamrick, Bankrate Senior Economic Analyst

“The fate of the housing market in the coming months will be dictated in part by the direction of mortgage rates, as well as the health of the broader economy,” says Mark Hamrick, Bankrate’s senior economic analyst. “The market could benefit from a combination of tailwinds, if they were to develop and are sustained.”

Existing-home sales finally inch upward

The count of existing-home sales includes all completed resales, including single-family houses, condos, townhouses and co-ops. According to NAR, the number of sales nationally increased 1.3 percent month-over-month to an annual pace of 3.95 million transactions in July 2024. While that’s the first increase since Q1, it’s still a 2.5 percent decrease from last year.

“Despite the modest gain, home sales are still sluggish,” Yun said in a statement.

Regionally, the Northeast saw the biggest sales increase, up 4.3 percent from June and 2.1 percent from July of last year. In the West, sales rose 1.4 percent both month-over-month and year-over-year. Sales in the South rose 1.1 perent from June but were down 3.8 percent from last year, and in the Midwest sales were flat in July and down 5.2 percent from July of last year.

Days on market

Properties typically remained on the market for 24 days in July, up slightly from 22 days in June and 20 days in July of last year. Selling times are a crucial measure at any time of year, but especially during the peak spring and summer selling seasons.

Home prices hit new July record

The nationwide median sale price for existing homes in July clocked in at $422,600. That’s down slightly from June’s all-time high of $426,900, mostly due to seasonality, but it’s still an increase of 4.2 percent from last year and the highest July median on record. This month’s jump marks 13 consecutive months of year-over-year price increases.

All four geographic regions again experienced annual price increases in July. The West continued to have the highest median price by far at $629,500, up 3.4 percent from a year ago. In the Northeast, the median rose 8.3 percent from a year ago to $505,100. The South’s median price rose 2.3 percent to $372,500, and the Midwest’s median rose 4.5 percent to $321,300.

First-time homebuyers made up 29 percent of sales in July, no change from June but down slightly from 30 percent in July of last year. All-cash deals accounted for 27 percent of July sales, up slightly from 26 percent a year ago.

Housing inventory on the rise

The supply of homes for sale is inching higher, after being severely low for quite some time. Total housing inventory — the overall number of homes for sale on the market — stood at 1.33 million units at the end of July. That’s up a modest 0.8 percent from June but a significant 19.8 percent jump from a year ago. The figure represents 4.0-month supply, which is getting closer to the five-to-six months typically required for a healthy, balanced market.

Despite the sharp rise in mortgage rates this past fall, which has kept many homeowners from sellingand thus kept those homes off the market, things may be looking up for homebuyers. “Consumers are definitely seeing more choices, and affordability is improving due to lower interest rates,” Yun said.

Robert Frick, corporate economist with Navy Federal Credit Union, cautiously agreed: “This is a glimmer of hope, not a turnaround signal,” he said. “Home sales remain weak, but lower mortgage rates should bring more potential sellers off the sidelines and increase affordability somewhat.”


This article was originally published by a www.bankrate.com . Read the Original article here. .


Home Buying

The bad news: They broke records in July. The good news: The increases were modest and are less than what buyers paid in June.

“With the prime selling season behind us, we’re seeing fewer bidding wars, more offers under asking price, and homes that are taking longer to sell,” said Jared Wilk, president of the Greater Boston Association of Realtors. Adobe Stock

The median sales prices for single-family homes and condominiums in Greater Boston broke records for July but were less than what buyers paid in June, according to a report the Greater Boston Association of Realtors released Wednesday.

The median sales price for a single-family in July was $910,000 — $15,000 more compared to July 2023 but $50,000 less than the June 2024 median.

In the condo market, buyers paid a median of $740,000 in July. That’s $2,000 more than they shelled out in July 2023 and $12,000 less than compared with June 2024.

Buyers are enjoying more purchasing power, and “there is some evidence that prices may have reached their ceiling, at least in the near term,” according to the report.

“What we are experiencing at the moment is not a price correction, but rather a softening in prices,” Jared Wilk, the association’s president and a broker with Compass in Wellesley, said in the news release. “With the prime selling season behind us, we’re seeing fewer bidding wars, more offers under asking price, and homes that are taking longer to sell. As a result, sellers have become more flexible, with some agreeing to price reductions in order to sell.”

“Prices also have eased a bit from their peak over the past month, which suggests buyers are finding more room for negotiation,” Wilk added, “and that’s giving many a renewed sense of optimism as we approach the fall market.”

Evidence may indicate that prices are capping out, but the median sales price year-to-date is still 7.1 percent higher than at this point in 2023, according to the report.

Data provided by MLSPIN © Domus Analytics under license for the GBARData provided by MLSPIN © Domus Analytics under license for the GBAR

Condo buyers are paying $189 more per square foot than single-home purchasers, according to the report — $630 compared with $441.

Mortgage rates giveth and taketh away

Mortgage rates that have eased from a high of 7.22 percent on May 2 may have played a role in the nearly 15 percent jump in sales and the 10 percent increase in local listings year-over-year in July in the single-family home market.

The available inventory in July was 1.2 months — a disappointing number that suggests that some sellers who don’t want to trade their low mortgage rates for ones in the mid-sixes — are still hesitant to list. Many experts agree that at least a five-month supply of inventory is a healthy market. High mortgage rates also relegate some buyers to the sidelines as the costs ratchet up, siphoning their buying power.

“There’s no denying the fact that sales activity continues to lag behind historic norms, but it’s also worth noting that last month was the busiest one we’ve had for home and condo closings in more than a year,” Wilk said. “Buyers have a larger selection of homes to choose from than they did last summer, and with mortgage rates lower than they were this spring, the market has become increasingly more inviting to those looking to buy.”

Condo sales were down 1.2 percent, but the “months supply” of inventory rose from 1.7 in July 2023 to 2.1 last month.

“Although buyer demand has been slowed by higher interest rates, it continues to outpace the supply of homes for sale,” Wilk said, “and that imbalance has kept upward pressure on selling prices and allowed for continued price appreciation.”

Economic forecasts call for mortgage rates to continue to fall, but not below 6 percent. The average rate ticked up last week to 6.49 percent.

Massachusetts home prices soar

The median sales price for a single-family home in the state jumped 6.6 percent to $650,000 in July, according to a report The Warren Group, a data analytics firm, released Tuesday.

That’s a record for the month, but home prices are losing momentum, according to Cassidy Norton, associate publisher and media relations director for the group: “Interest rates are more than double where they were two years ago, and I’m certain prices would be even higher without those changes. That does lead to a lack of inventory that may have abated price gains somewhat. Unfortunately, the lack of inventory will continue to be the biggest factor driving prices for the foreseeable future.”

Sales were up a modest 0.8 percent.

In Arlington, the median sales price of $1,142,500 for a single-family home in July reflects more than an 11 percent decrease. In Needham, the median sales price was $1,408,000, a jump of 3.9 percent, according to the report.

In the condo market, sales were up 3.2 percent, and the median price rose only 1.8 percent year over year to $565,000.

“The median condo price also reached a new high for July, but prices were down moderately from the previous month,” Norton said. “This could be an early indicator that condo prices are starting to plateau.”

In Quincy, the median sales price for a unit was $485,000, a drop of nearly 5 percent. In Malden, the median sales price for July was $425,000, an increase of 6.3 percent.

Check out the breakdowns by town and county and the recent sales list from The Warren Group.


This article was originally published by a www.boston.com . Read the Original article here. .

Pin It