Tag

Price

Browsing


Home price growth continued to slow in August, growing at a rate just above 4% year-over-year. The S&P CoreLogic Case-Shiller Home Price Index (seasonally adjusted – SA) posted a 4.24% annual gain, down from a 4.82% increase in July. Similarly, the Federal Housing Finance Agency Home Price Index (SA) rose 4.25%, down from 4.72% in July. Both indexes experienced a sixth consecutive year-over-year deceleration in August. The year-over-year rate peaked in February 2024 when the S&P CoreLogic Case-Shiller stood at 6.57% and the FHFA at 7.28%.

By Metro Area

In addition to tracking national home price changes, the S&P CoreLogic Index (SA) also reports home price indexes across major metro areas. Compared to last year, all 20 metro areas reported a home price increase.  There were 12 metro areas that grew more than the national rate of 4.24%. The highest annual rate was New York at 8.07%, followed by Las Vegas and Chicago both with rates of 7.22%. The smallest home price growth over the year was seen by Denver at 0.68%, followed by Portland at 0.82%, and Dallas at 1.57%.

By Census Division

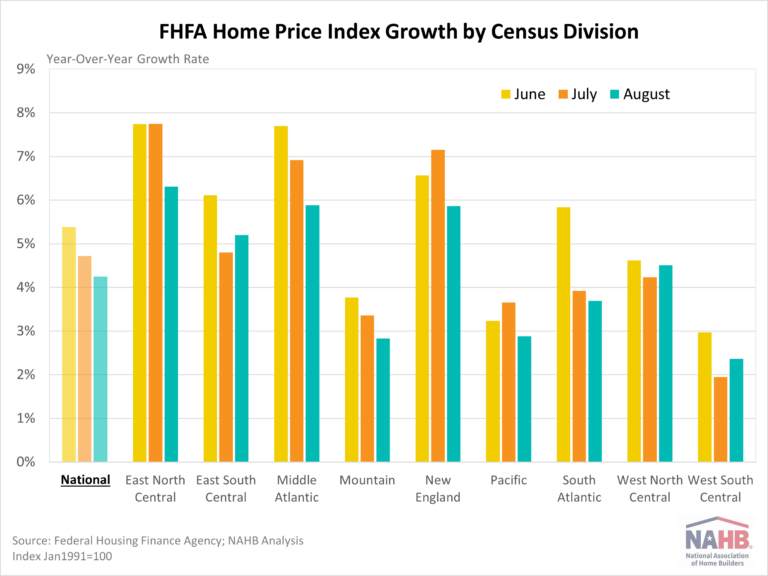
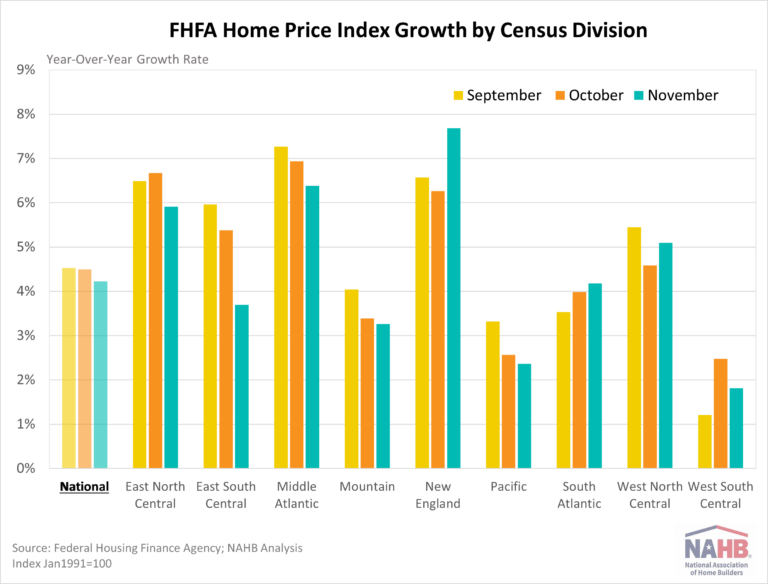
Monthly, the FHFA Home Price Index (SA) publishes not only national data but also data by census division. All divisions saw an annual increase of over 2% in August. The highest rate for August was 6.31% in the East South Central division, while the lowest was 2.36% in the West South Central division. As shown in graph below, all divisions saw a slow in rates compared to June. The FHFA Home Price Index releases their metro and state data on a quarterly basis, which NAHB analyzed in a previous post.

Discover more from Eye On Housing

Subscribe to get the latest posts sent to your email.


This article was originally published by a eyeonhousing.org . Read the Original article here. .

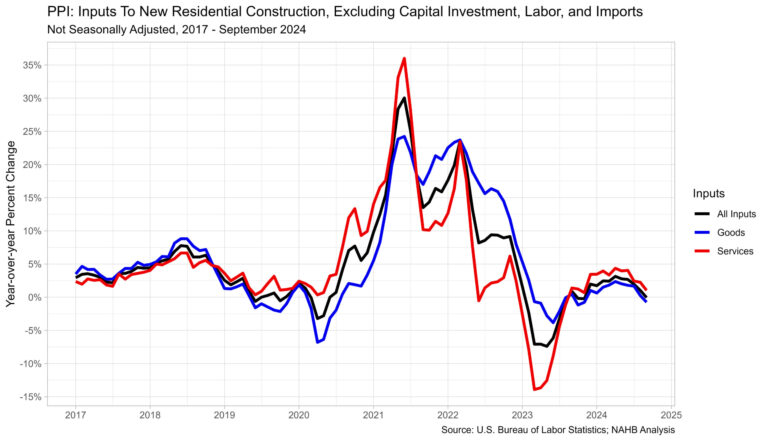
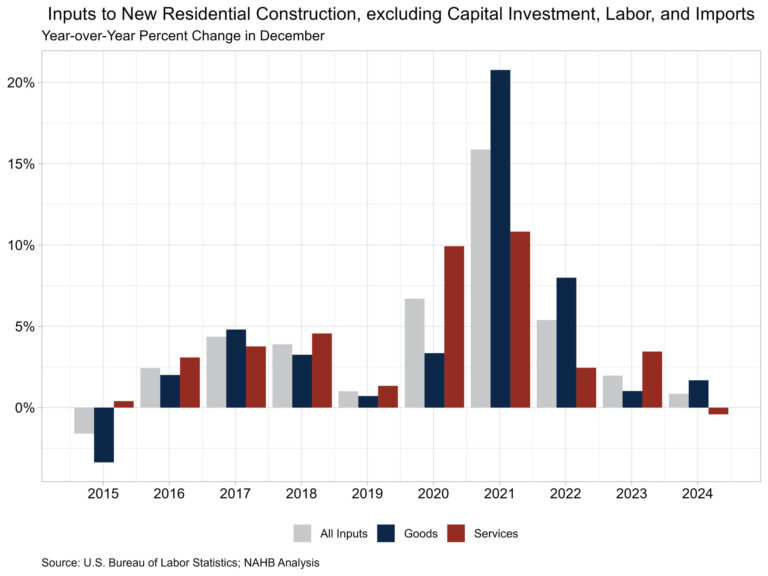
Prices for inputs to new residential construction—excluding capital investment, labor, and imports—decreased 0.6% in September according to the most recent Producer Price Index (PPI) report published by the U.S. Bureau of Labor Statistics. Compared to a year ago, this index was down 0.1% in September after an increase of 1.0% in August.

The inputs to new residential construction price index can be broken into two components­—one for goods and another for services. The goods component decreased 0.7% over the year, while services increased 1.0%. For comparison, the total final demand index increased 1.8% over the year in September, with final demand goods down 1.1% and final demand services up 3.1% over the year.

Input Goods

The goods component has a larger importance to the total residential construction inputs price index, around 60%. The price of input goods to residential construction was down 0.7% in September from August. The input goods to residential construction index can be further broken down into two separate components, one measuring energy inputs with the other measuring goods less energy inputs. The latter of these two components simply represents building materials used in residential construction, which makes up around 93% of the goods index.

Prices for inputs to residential construction, goods less energy, were up 1.5% in September compared to a year ago. This year-over-year growth has continued to slow since April when it was at 2.5% and remains well below growth in September of 2022 when it was at 14.3%. The year-over-year growth in September 2023 was 1.0%, making this year’s growth slightly higher. The index for inputs to residential construction for energy fell 23.5% in September, the largest yearly decrease since 26.1% in July 2023.

The graph below focuses on the data since the start of 2023 for residential goods inputs. Energy prices have retreated over the past year, with only two periods of growth in 2024.

Input Services

Prices of inputs to residential construction, services, fell 0.5% in September from August. The price index for service inputs to residential construction can be broken out into three separate components: the trade services component, the transportation and warehousing services component, and the services less trade, transportation and warehousing component. The most vital component is trade services (around 60%), followed by services less trade, transportation and warehousing (around 29%), and finally transportation and warehousing services (around 11%). The largest component, trade services, compared to last year was up 0.4% in September after increasing 2.1% in August.

Discover more from Eye On Housing

Subscribe to get the latest posts sent to your email.


This article was originally published by a eyeonhousing.org . Read the Original article here. .

Home prices remain elevated but price growth continues to decelerate, according to the S&P CoreLogic Case-Shiller Home Price Index (HPI) recent release. The S&P CoreLogic Case-Shiller HPI (seasonally adjusted) reached its 14th monthly consecutive record high in July 2024. The index increased at a seasonally adjusted annual rate of 2.15%, down slightly from a revised June rate of 2.19%. This rate has slowed over the past six months, from a high of 6.53% in February 2024. The index has not seen an outright decrease since January of 2023 (nineteen months).

Separately, the House Price Index released by the Federal Housing Finance Agency (FHFA; SA) posted its sixth monthly consecutive record high, after having decreased slightly in January of this year. The FHFA HPI recorded a 1.57% increase in July, upward from a revised 0.03% rate in June.  

Year-Over-Year  

Home prices experienced a fifth consecutive year-over-year declaration in July, tabulated by both indexes. The S&P CoreLogic Case-Shiller HPI (not seasonally adjusted – NSA) posted a 4.96% annual gain in July, down from a revised 5.50% increase in June. Meanwhile, the FHFA HPI (NSA) index rose 4.56%, down from a revised 5.37% in June. Both indexes have seen yearly growth rates slow since February 2024, when the S&P CoreLogic Case-Shiller stood at 6.54% and the FHFA at 7.23%. 

By Metro Area

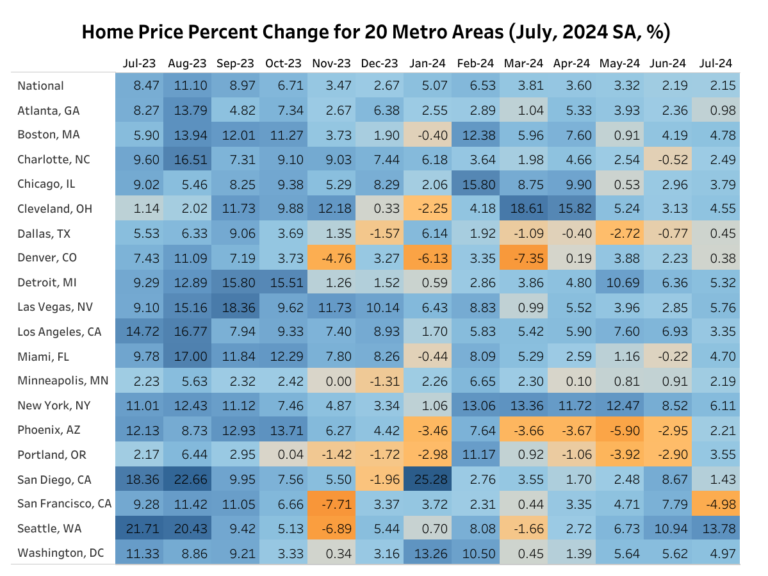
In addition to tracking national home price changes, the S&P CoreLogic Index (SA) also reports home price indexes across 20 metro areas. At an annual rate, only one out of 20 metro areas reported a home price decline: San Francisco at -3.10%. Among the 20 metro areas, 15 exceeded the national rate of 2.15%. Seattle had the highest rate at 13.78%, followed by New York at 6.11%, and Las Vegas at 5.76%. The monthly trends are shown in the graph below.  

Monthly, the FHFA HPI (SA) releases not only national but also census division house price indexes. Out of the nine census divisions, three posted negative monthly depreciation (adjusted to an annual rate) for July: South Atlantic at -7.88%, West South Central at -6.80%, and East South Central at -0.66%. The divisions with positive home price appreciation ranged from 2.02% in West North Central to 11.57% in East South Central. The FHFA HPI releases its metro and state data on a quarterly basis, which NAHB analyzed in a previous post. 

Discover more from Eye On Housing

Subscribe to get the latest posts sent to your email.


This article was originally published by a eyeonhousing.org . Read the Original article here. .

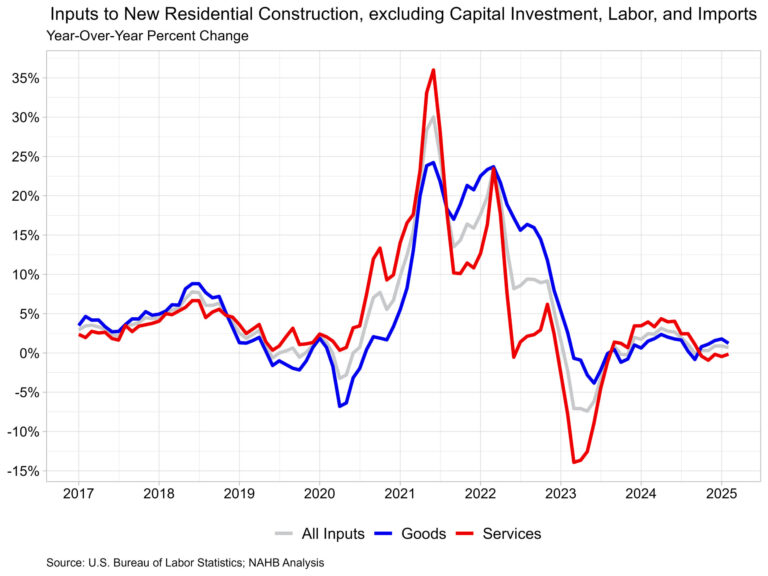
Prices for inputs to new residential construction, excluding capital investment, labor and imports decreased 0.1% in August according to the most recent Producer Price Index (PPI) report published by the U.S. Bureau of Labor Statistics. Compared to a year ago, this index was up 0.8% in August after a 1.8% increase in July. The inputs to new residential construction price index can be broken into two components­—one for goods and another for services. The goods component increased 0.2% over the year, while services increased 1.9%. For comparison, the total final demand index increased 1.7% over the year in August, with final demand goods flat and final demand services up 2.6% over the year.

Input Goods

The goods component has a larger importance to the total residential inputs price index, around at 60%. The price of inputs to residential construction, goods, remained flat in August after increasing 0.1% in July. The input goods to residential construction index can be further broken down into two separate components, one measuring energy inputs with the other measuring goods less foods and energy inputs. The latter of these two components simply represents building materials used in residential construction, which makes up around 93% of the goods index. Prices for inputs to residential construction, goods less food and energy, were up 1.6% in August compared to a year ago. This year-over-year growth has come down since April, when it was at 2.5% and remains well below the growth in August of 2022, when it was at 14.7%.

The graph below focuses on the data since the start of 2023 for residential goods inputs. Energy prices have retreated over the past year, with only two periods of growth in 2024.

Input Services

Prices of inputs to residential construction, services, fell 0.2% in August after remaining flat in July. The price index for service inputs to residential construction can be broken out into three separate components, a trade services component, a transportation and warehousing services component, and a services less trade, transportation and warehousing component. The most vital component is trade services (around 60%), followed by services less trade, transportation and warehousing (around 29%), and finally transportation and warehousing services (around 11%).

Discover more from Eye On Housing

Subscribe to get the latest posts sent to your email.


This article was originally published by a eyeonhousing.org . Read the Original article here. .

House price appreciation was recorded in all 50 states and the District of Columbia. Limited resale inventory and strong growth in demand continued to put upward pressure on house prices.

Nationally, house prices grew at a relatively slower pace, compared to double-digit annual growth during the COVID-19 pandemic. According to the quarterly all-transactions House Price Index (HPI) released by the Federal Housing Finance Agency (FHFA), U.S. house prices rose 5.9% in the second quarter of 2024, compared to the second quarter of 2023. This rate of price growth decreased from 6.4% in the first quarter of 2024.

The quarterly FHFA HPI not only reports house prices at the national level, but it also provides insights about house price fluctuations at the state and metro area levels. The FHFA HPI used in this article is the all-transactions index, measuring average price changes in repeat sales or refinancings on the same single-family properties.  

Between the second quarter of 2023 and the second quarter of 2024, all 50 states and the District of Columbia had positive house price appreciation, ranging from 1.5% to 10.4%. West Virginia led the way with the highest price appreciation (+10.4%). It was followed by New Jersey with a 10.1% gain, and New Hampshire with a 9.1% gain. Meanwhile, Louisiana had the lowest price growth (+1.5%). Among all 50 states and the District of Columbia, 28 states exceeded the national growth rate of 5.9%. Compared to the first quarter of 2024, thirty-five out of the 50 states had a deceleration in house price appreciation in the second quarter.

House prices have changed unevenly across U.S. metro areas, from the second quarter of 2023 to the second quarter of 2024. House price appreciation ranged from -4.6% to +20.7%. In the second quarter of 2024, 14 metro areas, in reddish color on the map above, had negative house price appreciation, while the remaining 370 metro areas experienced positive price appreciation.

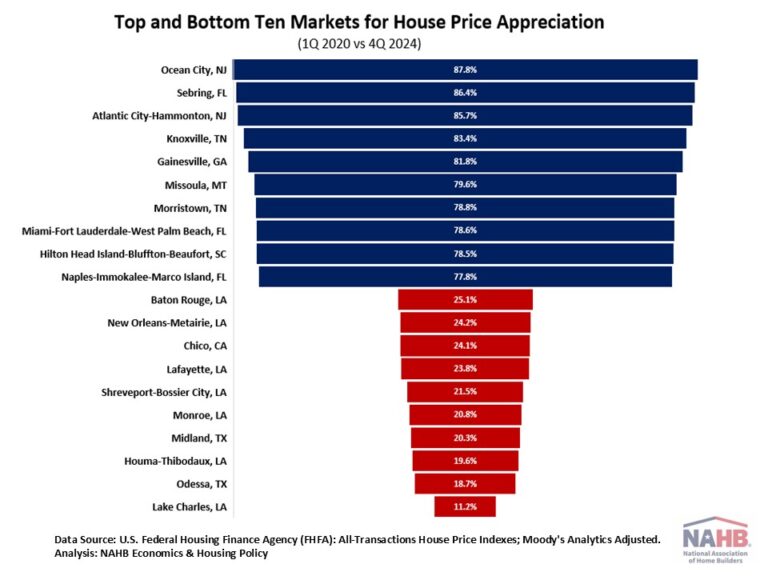
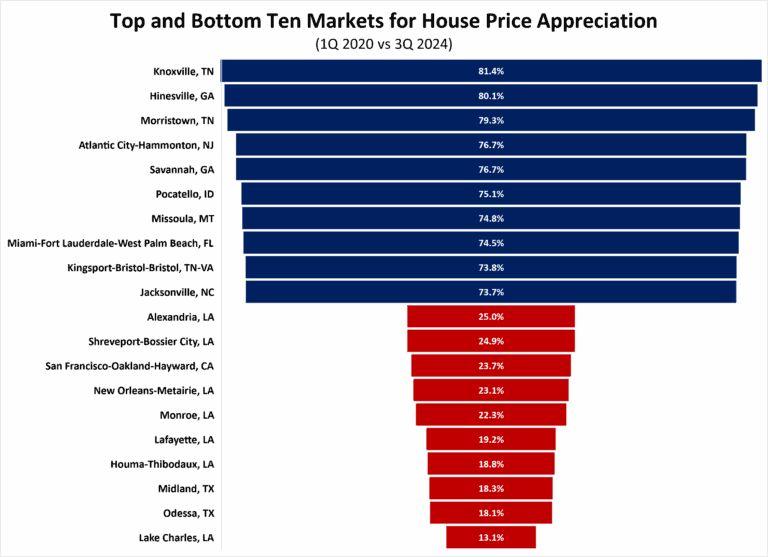
Meanwhile, house prices in the second quarter of 2024 are much higher than they were before the pandemic. Nationally, house prices rose 49.7% between the first quarter of 2020 and the second quarter of 2024. More than half of the metro areas saw house prices rise by more than the national price growth rate of 49.7%. Among all the metro areas, house price appreciation ranged from 13.8% to 81.0%. House prices in the South and the West have grown faster than the prices in the Midwest and Northeast. Within the top 20 metro areas that had the highest house price appreciation, 11 metro areas are in the South Atlantic Division and six in the East South Central Division, while none were in the Midwest.

Discover more from Eye On Housing

Subscribe to get the latest posts sent to your email.


This article was originally published by a eyeonhousing.org . Read the Original article here. .

Median square foot prices (excluding record-high improved lot values) for new single-family detached (SFD) homes started in 2023 remained largely stable, according to NAHB’s analysis of the latest Survey of Construction data. For custom, or contractor-built, homes, the median price was $162 per square foot of floor space, not significantly different from $156 in 2022. For spec starts, after excluding lot values, the median was $150 per square foot of floor area. There remains a significant regional variation in square foot prices. In the spec market, after excluding lot values, median prices ranged from $262 per square foot in New England to $133 in the East South Central division.

Contract prices of custom homes do not include the value of an improved lot as these homes are built on the owner’s land (with either the owner or a contractor acting as a general contractor). Consequently, contract prices are typically reported as lower than the sale prices of spec homes. To make the comparison more meaningful, the cost of lot development is excluded from sale prices in this analysis.

The recent modest square foot price changes marked a sharp decline from the double-digit price hikes that characterized home building in the post-pandemic environment. Just a year prior, in 2022, increases for square foot prices in new SFD homes were approaching 20%, more than doubling the historically high U.S. inflation rate of 8%. The deceleration for median square foot prices reflects relatively stable building material prices and slower growth in home building wages in 2023. The shifts towards cost-effective methods, such as building homes on slabs rather than with full or partial basements, also contributed to decelerating median square foot prices.

In the for-sale market, the New England division registered the highest and fastest rising median square foot prices. Half of new for-sale SFD homes started here in 2023 were sold at prices exceeding $262 per square foot of floor area, paid on top of the most expensive lot values in the nation. After showing slower appreciation in 2022-2023, the Pacific division came in second, with median prices of $216 per square foot.

The most economical SFD spec homes were started in the South region, where the median sale prices per square foot were below the national median of $150. The East South Central division is home to the least expensive for-sale homes. Half of all for-sale SFD homes started here in 2023 registered square foot prices of $133 or lower, paid on top of the most economical lot values in the country. The other two divisions in the South – West South Central and South Atlantic –registered median prices of $144 per square foot, the second lowest in the nation.

Because square foot prices in this analysis exclude the cost of developed lot, highly variant land values cannot explain the regional differences in square foot prices. However, overly restrictive zoning practices, more stringent construction codes and higher other regulatory costs undoubtedly contribute to higher per square foot prices. Regional differences in the types of homes, prevalent features and materials used in construction also contribute to price differences. In the South, for example, lower square foot prices partially reflect less frequent regional occurrence of costly new home features such as basements.

In the custom home market, new contractor-built SFD homes in New England are by far the most expensive to build. Half of custom SFD homes started in New England in 2023 registered prices greater than $233 per square foot of floor area. The East North Central division came in second with the median of $199 per square foot of floor space. The median custom square foot price in the neighboring Mid Atlantic division was $183 per square foot.

The Mountain division had similarly high custom square foot prices. Half of custom SFD started here in 2023 had prices of $184 per square foot or higher. The corresponding median price in the neighboring Pacific was $167 per square foot.

The West South Central and South Atlantic divisions are where the most economical custom homes were started in 2023 with half of new custom homes registering prices at or below $136 and $138 per square foot of floor space, respectively. The remaining division in the South – East South Central – recorded slightly higher median square foot contract prices of $145 – still below the national median of $162.

Typically, contractor-built custom homes are more expensive per square foot than for-sale homes after excluding improved lot values. Over the last two decades, this custom home premium averaged slightly above 9%, suggesting that new custom home buyers are not only willing to wait longer to move into a new home, but also pay extra for pricier features and materials.

However, these custom home premiums (see the chart below) largely disappeared in the post-pandemic environment characterized by supply chain disruptions, skyrocketing building materials costs and home prices setting new records monthly. In 2023, the custom home premium averaged 8%, close to its historic norm, suggesting that this recent trend reversed, and once again custom home buyers are likely to pay more for pricier features and materials.

The NAHB estimates in this post are based on the Survey of Construction (SOC) data. The survey information comes from interviews of builders and owners of the selected new houses. The reported prices are medians, meaning that half of all builders reported higher per square foot prices and the other half reported prices lower than the median. While the reported median prices cannot reflect the price variability within a division, and even less so within a metro area, they, nevertheless, highlight the regional differences in square foot prices.

For the square footage statistics, the SOC uses all completely finished floor space, including space in basements and attics with finished walls, floors, and ceilings. This does not include a garage, carport, porch, unfinished attic or utility room, or any unfinished area of the basement.

Discover more from Eye On Housing

Subscribe to get the latest posts sent to your email.


This article was originally published by a eyeonhousing.org . Read the Original article here. .


Home price growth continues to decelerate, according to the recent release of the S&P CoreLogic Case-Shiller Home Price Index (HPI). The S&P CoreLogic Case-Shiller HPI increased at a seasonally adjusted annual rate of 1.89% for June 2024, slowing from a revised rate of 3.28% in May. Home prices have not seen an outright decrease since January of 2023. However, 1.89% is the smallest growth in prices since February of 2023. Additionally, the growth rate has shown a generally declining trend since a peak of 9.76% in August 2023.

Meanwhile, the Home Price Index released by the Federal Housing Finance Agency (FHFA; SA), recorded a decline in home prices for June. The index declined at an annual rate of -1.04% for June, decreasing from a revised 0.51% rate in May. The FHFA Index has experienced just one other decrease since August of 2022, with a decline of -1.03% in January 2024.

Year-Over-Year

Home prices experienced a fourth year-over-year deceleration in June, tabulated by both indexes. The S&P CoreLogic Case-Shiller HPI (not seasonally adjusted – NSA) posted a 5.42% annual gain in June, down from a 5.94% increase in May. Since June of 2023, the index has seen steady increases in the year-over-year growth rate. However, this growth rate began slowing in March of 2024 and has continued to decelerate through June. Meanwhile, the FHFA HPI (NSA) index rose 5.23%, down from 5.95% in May. This rate has decelerated from 7.19% in February.

By Metro Area

In addition to tracking national home price changes, the S&P CoreLogic Index (NSA) also reported home price indexes across 20 metro areas in May. At an annual rate, five out of 20 metro areas reported home price declines: Phoenix at -3.02%, Portland at -2.90%, Dallas at -0.69%, Charlotte at -0.56%, and Miami at -0.03%. Among the 20 metro areas, thirteen exceeded the national rate of 1.89%. Seattle had the highest rate at 10.80%, followed by San Diego at 9.18%, and then Los Angeles at 7.89%. The monthly trends are shown in the graph below.

By Census Division

Monthly, the FHFA HPI (SA) releases not only national data but census division data as well. Out of the nine census divisions, seven posted negative monthly depreciation (adjusted to an annual rate) for June, ranging from -7.59% in the Mountain division to -0.82% in the Middle Atlantic. The remaining two divisions with positive home price appreciation were East South Central at 8.66% and the South Atlantic at 3.09%. The FHFA HPI releases its metro and state data on a quarterly basis, which NAHB analyzes in a previous post.

Discover more from Eye On Housing

Subscribe to get the latest posts sent to your email.


This article was originally published by a eyeonhousing.org . Read the Original article here. .


Inputs to residential construction, goods less foods and energy, decreased 0.04% over July according to the most recent Producer Price Index (PPI) report published by the U.S. Bureau of Labor Statistics (BLS). The index for inputs to residential construction, goods less food and energy, represents building materials used in residential construction. Compared to a year ago, the index is up 2.01% in July, marking the sixth straight month of above 2% growth.

Just past the midpoint of 2024, the year-to-date (YTD) increase in the index is at 0.47%. This is slightly higher yet similar to the YTD growth rate for 2023, which was 0.44%.

The seasonally adjusted PPI for final demand goods increased 0.62% in July, after decreasing a revised 0.36% in June. In July, the PPI for final demand energy increased 1.90%, final demand food also rose 0.61% and final demand goods, less food and energy, rose 0.24%. The BLS producer price indices measure the average change in selling prices that domestic producers receive for their output.

The seasonally adjusted PPI for softwood lumber fell 1.04% in July after rising 3.29% in June. Softwood lumber prices were 13.12% lower than July 2023.

The non-seasonally adjusted PPI for gypsum building materials increased 0.08% in July after no increase in June. Compared to last year, the index was up 4.25%, the highest yearly increase since April 2023 when the index was up 12.14%.

The seasonally adjusted PPI for ready-mix concrete rose 0.03% in July after falling 0.15% in June. Monthly growth in prices for read-mix concrete has been relatively flat for four consecutive months after prices peaked in March. Over the year, ready-mix concrete prices were 5.05% higher than July 2023.

The non-seasonally adjusted PPI for steel mill products fell for the second straight month, down 3.29% in July. Steel mill product prices are 13.99% lower than last year. Overall, steel mill product prices have fallen 36.99% since peaking back December of 2021.

The non-seasonally adjusted special commodity grouping PPI for copper rose 0.56% in July after falling 2.79% in June. Over the year, the index was up 14.26%. This special commodity grouping of copper includes the following commodities: copper and nickel ores, copper cathode and refined copper, copper base scrap, secondary copper (alloyed and unalloyed), copper and brass mill shapes, copper wire and cable, and copper base castings (excluding die-castings).

Discover more from Eye On Housing

Subscribe to get the latest posts sent to your email.


This article was originally published by a eyeonhousing.org . Read the Original article here. .
Pin It