Tag

policy research

Browsing


Reflecting the sharp increase in net immigration of recent years, the number of new immigrants joining the construction industry rose substantially in 2022. According to the latest American Community Survey (ACS), the industry managed to attract close to 130,000 new workers coming from outside the U.S. to help with persistent labor shortages. For comparison, this inflow surpasses the combined number of new immigrants who joined the industry in the two years prior to the pandemic. Only during the housing boom of 2005-2006, was the industry absorbing a similar number of new foreign-born workers.

Native-born workers remain reluctant to join the industry, with their total count remaining below the record levels of the housing boom of the mid-2000s by over half a million. As a result, the share of immigrants in construction reached a new historic high of 25.5%. In construction trades, the share of immigrants remains even higher, with one in three craftsmen coming from outside the U.S. This is consistent with the earlier ACS data that regularly shows higher shares of immigrants in the construction trades.

In 2023, 11.9 million workers, including both self-employed and temporarily unemployed, comprised the construction workforce. Out of these, 8.9 million were native-born, and 3 million were foreign-born, the highest number of immigrant workers in construction ever recorded by the ACS.

The construction labor force, including both native- and foreign-born workers, exceeds the pre-pandemic levels but remains smaller than during the housing boom of the mid-2000s.  As the chart above illustrates, it is the native-born workers that remain missing. Compared to the peak employment levels of 2006, construction is short 550,000 native-born workers and new immigrants only partially close the gap. Due to the data collection issues during the early pandemic lockdown stages, we do not have reliable estimates for 2020 and omit these in the chart above.

Typically, the annual flow of new immigrant workers into construction is highly responsive to the changing labor demand. The number of newly arrived immigrants in construction rises rapidly when housing starts are rising and declines precipitously when the housing industry is contracting. The response of immigration is normally quite rapid, occurring in the same year as a change in construction activity. Statistically, the link is captured by high correlation between the annual flow of new immigrants into construction and measures of new home construction, especially new single-family starts. 

The latest data show that the substantial uptick in the number of new immigrants in 2022 does not reflect the changing volume of home building as new single-family starts declined during that time period.

Previously, the link between immigrant inflow and home building activity also disconnected in 2017 when NAHB’s estimates showed a surprising drop in the number of new immigrants in construction despite steady gains in housing starts. The connection was further severed by pandemic-triggered lockdowns and restrictions on travel and border crossings, drastically interrupting the flow of new immigrant workers. In 2021, however, the flow of immigrants into construction returned to typical levels driven by home building activity.

The overall rising trend and the noticeable uptick after the pandemic in the share of immigrants are consistent with but more pronounced in construction compared to broader U.S. economy. Excluding construction, where the reliance on foreign-born workers is greater, the share of immigrants in the U.S. labor force increased from just over 14% in 2004 to over 17% in 2023, the highest share recorded by the ACS.

Discover more from Eye On Housing

Subscribe to get the latest posts sent to your email.


This article was originally published by a eyeonhousing.org . Read the Original article here. .

Prices for inputs to new residential construction—excluding capital investment, labor, and imports—decreased 0.2% in October according to the most recent Producer Price Index (PPI) report published by the U.S. Bureau of Labor Statistics. Compared to a year ago, this index is up 0.3% in October after a decline of 0.1% in September.

The inputs to the new residential construction price index can be broken into two components­—one for goods and another for services. The goods component increased 0.7% over the year, while services decreased 0.4%. For comparison, the total final demand index increased 2.4% over the year for October, with final demand with respect to goods up 0.2% and final demand for services up 3.5% over the year.

Input Goods

The goods component has a larger importance to the total residential construction inputs price index, representing around 60%. The price of input goods to new residential construction was up 0.3% in October from September. The input goods to residential construction index can be further broken down into two separate components, one measuring energy inputs with the other measuring goods less energy inputs. The latter of these two components simply represents building materials used in residential construction, which makes up around 93% of the goods index.

Prices for inputs to residential construction, goods less energy, were up 2.0% in October compared to a year ago. This year-over-year increase was larger than in September (1.4%) and was the first percentage point increase in the year-over-year rate since April. The growth rate in October 2023 was 0.8%. The index for inputs to residential construction for energy fell 13.1% year-over-year in October, the third straight yearly decline in input energy prices.

The graph below focuses on the data since the start of 2023 for residential goods inputs. Energy prices have continued to fall over the past year, with only two periods of growth in 2024.

At the individual commodity level, excluding energy, the five commodities with the highest importance for building materials to the new residential construction index were as follows: ready-mix concrete, general millwork, paving mixtures/ blocks, sheet metal products, and wood office furniture/store fixtures. Across these commodities, there was price growth across the board compared to last year. Ready-mix concrete was up 3.7%, wood office furniture/store fixtures up 3.6%, general millwork up 2.8%, paving mixtures/blocks up 2.4% and sheet metal products up 0.6%.

Input Services

Prices of inputs to residential construction for services fell 1.0% in October from September. The price index for service inputs to residential construction can be broken out into three separate components: a trade services component, a transportation and warehousing services component, and a services excluding trade, transportation and warehousing component. The most significant component is trade services (around 60%), followed by services less trade, transportation and warehousing (around 29%), and finally transportation and warehousing services (around 11%). The largest component, trade services, compared to last year was down 1.5% in October after increasing 0.6% in September. The decline in October was the first decline since August 2023, when the trade services index was down 1.2%.

Discover more from Eye On Housing

Subscribe to get the latest posts sent to your email.


This article was originally published by a eyeonhousing.org . Read the Original article here. .

The production index for sawmills and wood preservation industries rose marginally by 0.2% in the second quarter of 2024. After falling for the previous two quarters, this was the first rise in real output since the third quarter of 2023 according to the G.17 data. The index was 2.2% lower than one year ago, the largest year-over-year decline since falling 4.7% in the fourth quarter of 2021.

Quarterly Survey of Sawmills Capacity Utilization

To provide a better understanding of the sawmill and wood preservation industries, the Census Bureau’s Quarterly Survey of Plant Capacity Utilization is another source of interest. This data comes from quarterly surveys of U.S. domestic manufacturing plants and includes a subindustry grouping of sawmills and wood preservation firms. The survey estimates utilization rates based on full production capability, meaning the utilizations rates are found by taking the market value of actual production during the quarter and dividing by an estimated market value of what the firm could have produced at full production capacity. In other words, the rate indicates how much production capacity is used to produce current output.

The sawmill and wood preservation industry full utilization rates jumped significantly over the quarter, up from 61.9% to 70.7%. Given this rise, it is surprising that production did not also increase significantly. Average plant hours per week in operation did rise for these firms, up from 47.9 hours in the first quarter to 57.7 hours in the second quarter.  

Employment

Employment at sawmill and wood preservation firms rose for the first time in six quarters, up to approximately 89,400 employees in the second quarter.  The Great Recession had a substantial impact on this industry, as employment fell from 105,630 in the first quarter of 2008 to a series low of 80,470 in the fourth quarter of 2009. Employment rose from this low to 91,000 in 2014 and has remained around this level for the last ten years.  

Capacity Index Estimate

By combining the production index and utilization rate, we can compose a rough index estimate of what the current production capacity is for U.S. sawmills and wood preservation firms. Shown below is a quarterly estimate of the production capacity index. This capacity index measures the real output if all firms were operating at their full capacity.

Due to the volatility of the data, we compute a moving average of the utilization rate, production index and capacity index. These are four-quarter moving averages, which are shown below to provide a clearer picture of the industry.

Based on the data above, sawmill production capacity has increased from 2015 but remains lower than peak levels in 2011. Production by sawmills continues to be higher mainly because the mills are running at higher than historical levels of utilization, as shown in red above. Much of the addition in capacity has been recent, as utilization rates have fallen but production continues to run at higher levels. Despite the U.S. being largest producer of softwood lumber in North America, the current capacity and production levels do not meet the demand of U.S. consumers.

According to Census international trade data, imports remain critical to meeting U.S. demand for softwood lumber. In the month of September alone, imports of softwood lumber stood at 1.1 billion board feet. Canada was the primary country of origin, exporting 987 million board feet into the U.S. in September. The current Antidumping/Countervailing duty rate on these imports from Canada averages 14.5%. U.S. producers claim that Canadian softwood lumber production is subsidized by Canadian provincial governments, which allows Canadian producers to sell lumber at lower than normal market prices. The data indicates that since the expiration of the softwood lumber agreement in 2016, tariffs on Canadian softwood lumber have substantially benefited the U.S. lumber industry, allowing for expanded production capacity.

Discover more from Eye On Housing

Subscribe to get the latest posts sent to your email.


This article was originally published by a eyeonhousing.org . Read the Original article here. .

The Fed cut the short-term federal funds rate by an additional 25 basis points at the conclusion of its November meeting, reducing the top target rate to 4.75%. However, while the Fed noted it is making progress to its 2% inflation target, it did not provide post-election guidance on the pace and ultimate path for future interest rate cuts. The bond market is not waiting, with the 10-year Treasury rate rising from 3.6% in mid-September to close to 4.3% due to changing growth and government deficit expectations.

Today’s statement from the Fed noted:

“Recent indicators suggest that economic activity has continued to expand at a solid pace. Since earlier in the year, labor market conditions have generally eased, and the unemployment rate has moved up but remains low. Inflation has made progress toward the Committee’s 2 percent objective but remains somewhat elevated.

The Committee seeks to achieve maximum employment and inflation at the rate of 2 percent over the longer run. The Committee judges that the risks to achieving its employment and inflation goals are roughly in balance. The economic outlook is uncertain, and the Committee is attentive to the risks to both sides of its dual mandate.”

Inflation risks for 2025 are evolving. The policy risks for the central bank had recently been between inflation (decreasing risks) and concerns regarding the health of the labor market (risks rising). However, the 2024 election result changes this outlook somewhat. In particular, the election increases the probability of additional economic growth, a tighter labor market, larger government deficits, and higher tariffs. All of these factors can be inflationary, even if they yield other macroeconomic benefits.

Consequently, the Fed will need to recalibrate its economic and policy outlook given the large number of changes that markets have digested in just the past week alone. In particular, how far will the Fed ultimately cut into 2025 and perhaps 2026? A 3% terminal federal funds rate is unlikely. Some commentators have suggested a 4% rate would at least be a threshold of reevaluation. NAHB’s outlook is for a terminal rate of 3.25%, perhaps 3.5%. However, that decision, or destination, will be dependent on factors like tariff adoption.

Markets and analysts will receive additional information at the conclusion of the December Fed meeting, which will include an update of the central bank’s Summary of Economic Projections. Given the election discussion, is worth noting that the Fed does not try to anticipate changes to future fiscal policy. The Fed will study and model anticipated changes, but such impacts would not be formally incorporated into the Fed’s outlook until such proposals are, at the very least, fully detailed and analyzed. All market participants should be aware that rising government debt levels will push nominal long-term interest rates higher.

While the question of the future policy path matters for long-term interest rates, there is a direct benefit to current easing like today’s rate cut. For example, the November rate reduction will be felt for builder and land developer loan conditions. Interest rates for such loans should move lower by approximately 25 in the coming weeks.

A reduction for the cost of builder and developer loans is a bullish sign for housing affordability. The pace of overall inflation has remained elevated due to the growth of housing/construction costs and elevated measures of shelter inflation, which can only be tamed in the long-run by increases in housing supply. Fed Chair Powell has previously noted it will take some time for rent cost growth to slow. Given recent tight financing conditions, however, the Fed noted that while consumer spending is resilient, “…activity in the housing sector has been weak.”

All things considered, with inflation having moved lower (the September core PCE measure of inflation is at 2.7%, down from 3.7% a year ago), there is clearly policy room for future rate reductions as the Fed normalizes monetary policy. A further cut to the federal funds rate in December, to a 4.5% top rate, seems likely. After that, given expected changes for fiscal policy and fiscal policy impacts, the Fed is likely to slow its pace of rate cuts, perhaps moving to one 25 basis point cut per quarter in 2025 to the ultimate terminal rate. As noted earlier, the level of this terminal rate is likely to be reevaluated in the coming months.

Discover more from Eye On Housing

Subscribe to get the latest posts sent to your email.


This article was originally published by a eyeonhousing.org . Read the Original article here. .

Approximately 27% of the national housing stock consists of multifamily homes—defined as residential buildings with multiple separate housing units within one structure. According to the 2023 American Community Survey 1-year estimates, these units range from small duplexes, triplexes, and quadplexes (2 to 4 units) to medium-sized buildings (5 to 49 units) and large complexes (50 or more units).

While most congressional districts have multifamily housing shares between 10% to 20% of total housing units, this proportion varies widely, from as low as 8% to as high as 98%. The map below illustrates the distribution of multifamily housing stock across congressional districts with larger shares indicated by bigger bubble size. This visualization shows that districts with the largest share of multifamily units are, unsurprisingly, concentrated in densely populated urban areas.

New York leads in this regard, with its 12th and 13th Districts – both encompassing upper and midtown Manhattan – having almost exclusively multifamily units at 98% each. In fact, eight out of the top 10 districts with the largest share of multifamily housing are in New York. Other areas with large shares include New Jersey’s 8th District, also within the New York metropolitan area, and Massachusetts’s 7th District that includes Boston. At the lower end of the distribution, North Carolina’s 8th District has only 8% multifamily units, while Michigan’s 2nd and 9th Districts, Arizona’s 9th District, and Florida’s 12th District all have around 9% multifamily units.

Building Sizes in Multifamily Units

In most congressional districts, multifamily units tend to be on the smaller side, with the majority consisting of buildings with 5 to 19 units, followed by those with 2 to 4 units. Duplexes, triplexes, and quadplexes (2 to 4 units) are especially common in the Northeast, various Mountain states, and parts of California. Apart from Illinois’s 4th District, which has the highest share of small multifamily units (70%), the remaining top five districts with the largest shares of 2 to 4 unit buildings are all in New York, each exceeding 60%.

Buildings with 5 to 19 units are more prevalent across the South and Midwest, with Maryland’s 2nd, 3rd and 4th Districts owning majority shares of this building type with 59%, 62% and 61%, respectively. High-density areas like New York’s 12th District, Florida’s 27th District – located within Miami-Dade County – and Washington, D.C. (at large), tend to have the largest multifamily (50 or more) buildings. North Dakota (at large) and Minnesota’s 6th District stand out as the only two congressional districts where the majority of multifamily buildings have between 20 to 49 multifamily units.

Gross Median Rent and Renter Cost Burden

Multifamily units are predominantly rented rather than owned, with 86% being occupied by renters. This trend holds across all multifamily types, with larger buildings generally more likely to be rental properties, while condominiums (owner-occupied units) are often smaller buildings. A Fannie Mae study on the multifamily market found that larger properties typically command higher monthly rents, especially in major metropolitan areas. The chart below corroborates this, showing that districts with higher shares of large multifamily buildings (50 or more units) also have higher median monthly rents (including utilities and fuel). However, lower median rents don’t always equate to more affordability, as even low-rent areas can have high renter cost burdens due to lower income levels. For example, New York’s 12th District has the highest median rent at $3,121, with 43% of renters burdened (spending over 30% of income on housing costs), a rate matched by Kentucky’s 5th District, where the median rent is only $727. Overall, despite rent prices moderating (see Real Rent Index), rental cost burdens remain high across the country, with only 23 of 436 congressional districts (including D.C.) having fewer than 40% of renter households burdened by housing costs.

Additional housing data for your congressional district are provided by the US Census Bureau here.

Discover more from Eye On Housing

Subscribe to get the latest posts sent to your email.


This article was originally published by a
eyeonhousing.org . Read the Original article here. .


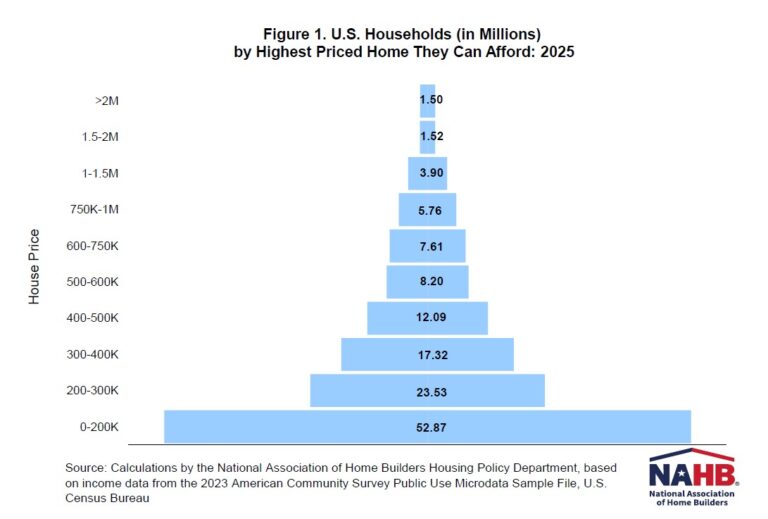
With elevated interest rates and rising home prices, 103.5 million households in the United States cannot afford a $495,750 median-priced new home. The growing affordability crisis makes housing a top issue for voters in the 2024 presidential election. Both presidential candidates have offered housing policy proposals to address our nation’s housing supply and affordability challenges.

Homeownership has been a crucial part of the American Dream for over a century as owning a home not only provides households with a stable place to live, but also offers an opportunity for households to accumulate assets and build wealth over time through equity.

A recent NAHB study on home buyer preferences revealed that a single-family detached home remained the top purchase preference for two out of every three buyers. In reality, only 54% of the total housing units in 2023 were owner-occupied single-family detached homes, according to NAHB analysis of American Community Survey (ACS) data. This equates to around 70 million homes of the total 131 million housing units.

In addition, a recent article in the Washington Post stated that “the new American Dream should be a townhouse (using the term of single-family attached homes in this post).” The article argues that townhouses are more affordable, need less maintenance, and foster a sense of community. Additionally, townhomes in medium-density residential neighborhoods can be a good option for younger home buyers. However, owner-occupied single-family attached homes only accounted for 4% of the total occupied housing units in 2023.

Single-Family Detached Homes Across Congressional Districts

Across congressional districts, the share of single-family detached homes among all owner-occupied housing units varies substantially, ranging from 3% to 95%.

Texas has a high share of owner-occupied single-family homes. Texas’s 20th congressional district has the highest share of single-family detached homes. All congressional districts in Texas have at least an 83% share of single-family detached homes. Four districts in Texas, two in Indiana and Nebraska, one in Iowa, and one in California report the top ten highest share of single-family detached homes.

At the bottom of the ranking, congressional districts in New York and Pennsylvania are on the list of the ten lowest shares of single-family detached homes. New York’s 12th, 13th, and 10th, where renter-occupied housing units exceed owner-occupied ones, have the lowest share with 3%, 4%, and 5%, respectively. In addition to a lower share of single-family detached homes, New York’s 12th and 13th have a low share of single-family attached homes, with 2% for both districts. In the District of Columbia, at-large, 22% of owner-occupied single-family housing units are detached, ranked as the 12th lowest share.

Despite the geographic variation, single-family detached homes dominate most of the owner-occupied housing markets. Out of all 436 congressional districts, only 18 congressional districts have a lower share of single-family detached homes than the national level of 54%.

Single-Family Attached Homes Across Congressional Districts

Although single-family attached homes are not as popular as single-family detached homes in the owner-occupied housing market, the share of single-family attached homes shows substantial variation across congressional districts, ranging from 0% to 78%.

Pennsylvania’s 3rd congressional district has about 78% single-family attached homes, followed by Pennsylvania’s 2nd district with 75% single-family attached homes, and Maryland’s 7th district with 57%. The District of Columbia, at-large, with only 22% single-family detached homes, was ranked as the fourth highest share of single-family attached homes (43%).

Single-family attached homes have become popular as more home buyers are looking for “medium-density residential neighborhoods, such as urban villages that offer walkable environments and other amenities”, as mentioned in an NAHB blog post.

Median Home Value

The median value of owner-occupied housing units in the United States is $340,200, though it varies significantly across congressional districts depending on local housing supply and demand, property size, neighborhood, and overall economic factors. Coastal areas often have significantly higher median home values than rural regions.

Analysis of the 2023 ACS data shows that of the 14 congressional districts where median house value exceeds one million, 12 of them are in California. California’s 16th congressional district has the highest median home value of $1,820,400 among all congressional districts, with 81% of 159,895 owner-occupied housing units valuing more than one million dollars.

New York’s 12th and 10th congressional districts, with only 3% and 5% single-family detached homes, are the other two districts where median home value is over one million.

Additional housing data for your congressional district are provided by the US Census Bureau here.

Discover more from Eye On Housing

Subscribe to get the latest posts sent to your email.


This article was originally published by a eyeonhousing.org . Read the Original article here. .
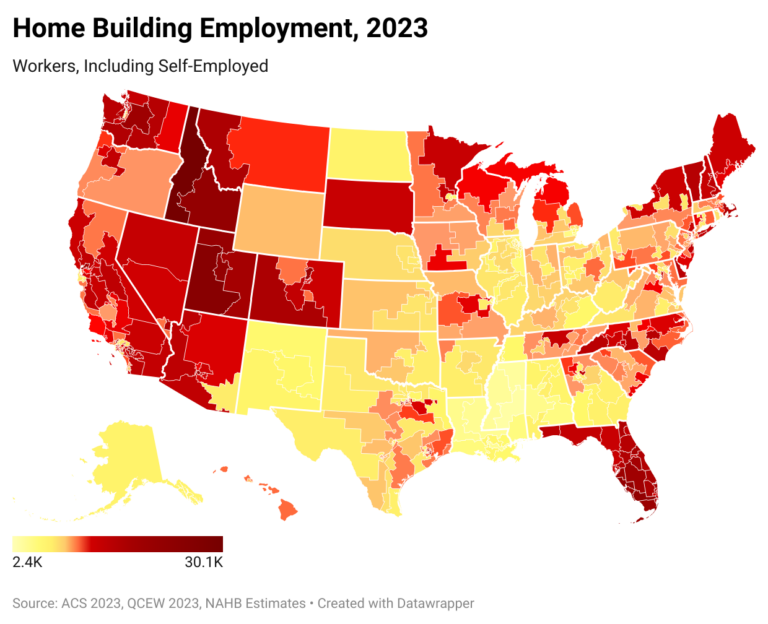

As of 2023, nearly 40% of homeowners in the United States are mortgage-free, the highest level seen in the past 13 years. With elections approaching, it is valuable to analyze the share of mortgage-free homeowners across congressional districts, as these patterns often provide insights into the local housing market as well as demographic shifts.

Both the number and the share of homeowners without mortgages have steadily increased since 2010, according to the 2023 American Community Survey. In 2010, around 32.8% of homeowners, or 24.5 million households, were mortgage-free. By 2023, this number had increased to 39.8% of homeowners, with 34.1 million homeowners having fully paid off their mortgages. Over the past 13 years, the share of mortgage-free homeowners has reached a record high level.

Older homeowners are more likely to have fully paid off their mortgages. In 2023, two-thirds of the mortgage-free homeowners are baby boomers aged 60 years and over. In contrast, only 5% of mortgage-free homeowners are under 35 years old, 8% are between 35 and 44 years old, 11.9% are aged 45 to 55, and 8.9% are between 55 and 59.

The share of mortgage-free homeowners varies substantially across the congressional districts. Districts with more affordable housing or a higher proportion of older populations tend to have a higher percentage of mortgage-free homeowners. The top 5 congressional districts for mortgage-free homeownership are primarily located in Southern states such as Texas, West Virginia, Kentucky, Mississippi, where lower housing costs or favorable weather attract older residents. As of 2023, Texas’s 34th district had the highest share of mortgage-free homeowners in the nation. Following closely, West Virginia’s 1st district had 61.2% of homeowners living mortgage-free, while Kentucky’s 5th district had a mortgage-free rate of 60.2%, Mississippi’s 2nd district had 58.7%, and Texas’s 29th district had 56.7%.

In contrast, districts with younger populations, higher levels of urbanization and less affordable housing tend to have lower shares of mortgage-free homeowners. The five congressional districts that struggle the most with low rates of mortgage-free homeowners include Maryland’s 5th district (20.8%), Virginia’s 10th district (22.6%), the District of Columbia’s Delegate District at Large (22.7%), Virginia’s 7th district (22.6%) and California’s 37th district (20.8%).  

Additional housing data for your congressional district are provided by the US Census Bureau here.

Discover more from Eye On Housing

Subscribe to get the latest posts sent to your email.


This article was originally published by a eyeonhousing.org . Read the Original article here. .


In 2023, the total number of second homes was 5.7 million, accounting for 4% of the total housing stock, according to NAHB estimates of the 2023 American Community Survey. Second homes have been in a steady decline over the past few years, from 7.15 million in 2020, to 6.5 million in 2022, dropping to 5.7 million in 2023.

The distribution of second homes across the U.S. reveals important geographic patterns, particularly when examined at the congressional district level. This analysis focuses on the number and the location of second homes qualified for or defined by the home mortgage interest deduction using the Census Bureau’s 2023 American community Survey (ACS). It does not account for homes held primarily for investment or business purposes.

Half of the nation’s second homes are concentrated in a small number of congressional districts, primarily in these states: Florida, California, New York, Texas, Michigan, North Caroline, Pennsylvania, and Arizona. Florida alone accounted for 15.8% of all second homes, with 16 out of its 28 congressional districts having more than 25,000 second homes each. Florida’s 19th Congressional District had the largest stock of second homes, with 123,853 units. In contrast, Wyoming’s At Large Congressional District had the smallest stock, with 17,623 second homes.

Analysis of congressional district data shows that second homes are not just concentrated in conventional coastal and resort areas. Second homes make up a significant portion of the housing stock in various districts across the country. Michigan’s 1st Congressional District had the highest share of second homes, with 24.5% of its housing stock qualified as second homes. Wisconsin’s 7th Congressional District had 82,755 second homes, almost 20% of its total housing stocks.

While some congressional districts have a higher percentage of second homes, many other congressional districts also show a notable prevalence of second homes. In 2023, 32 congressional districts in 17 states had at least 10% of housing units that were second homes. Of these congressional districts, 8 congressional districts were in Florida, 4 in New York, 3 in California, and 2 in Maine, Michigan, North Carolina, and 1 congressional district each in Arizona, Colorado, Hawaii, Maryland, Massachusetts, Minnesota, New Jersey, Pennsylvania, South Carolina, Vermont, Wisconsin.

NAHB estimates are based on the definition used for home mortgage interest deduction: a second home is a non-rental property that is not classified as taxpayer’s principal residence. Examples could be: (1) a home that used to be a primary residence due to a move or a period of simultaneous ownership of two homes due to a move; (2) a home under construction for which the eventual homeowner acts as the builder and obtains a construction loan (Treasury regulations permit up to 24 months of interest deductibility for such construction loans); or (3) a non-rental seasonal or vacation residence. However, homes under construction are not included in this analysis because the ACS does not collect data on units under construction.

Discover more from Eye On Housing

Subscribe to get the latest posts sent to your email.


This article was originally published by a eyeonhousing.org . Read the Original article here. .

While the lack of affordable housing dominates the headlines across the nation, congressional districts with higher shares of renter households are disproportionately affected by the current affordability crisis. Geographically, the districts with the largest housing cost burdens are heavily concentrated in California, Florida, and the coastal Northeast.

Buoyed by significant home equity gains and locked in by below-market mortgages rates, current home owners are in a more advantageous financial position to weather the growing affordability crisis. At the same time, renters are facing the worst affordability on record. According to the latest 2023 American Community Survey (ACS), more than half of all renter households, or 23 million, spend 30 percent or more of their income on housing, and therefore are considered burdened by housing costs. Among home owners, the share of households that are cost burdened is less than a quarter (24%). Nevertheless, this amounts to 20.6 million owner households who experience housing cost burdens. As a result, congressional districts where housing markets are dominated by renters are more likely to register higher overall shares of households with cost burdens.

In a typical congressional district, about a third of all households, renters and owners combined, experience housing cost burdens. In contrast, in the ten congressional districts with the highest burden rates, more than half of all households spend 30% or more of their income on housing.

The highest burden rates are found in five districts each in California and New York and two in Florida (see the chart above). In New York’s 15th and 13th, 55% and 52% of households, respectively, are burdened with housing costs. The vast majority of these households are renters, as reflected by the low homeownership rates in these districts, 16% and 13%, respectively. Similarly, the remaining top 10 districts with the highest shares of burdened households have homeownership rates well below the national average of 65%. On the list, only Florida’s 20th and 24th have homeownership rates that exceed 50%. Since congressional districts are drawn to represent roughly the same number of people, higher shares typically translate into larger counts of cost burdened households. To capture any remaining differences, the size of the bubbles in the chart correlates with the overall number of burdened households.

On the rental side, nine out of eleven worst burdened districts are in Florida. Close to two thirds of renters in Florida’s 26th, 20th, 25th and 19th are burdened with housing costs. The renter burden rates are similarly high in Florida’s 28th, 21st, 24th, 13th, and 23rd, where the shares of housing cost burdened renters are between 63% and 64%. Only California’s 27th and 29th register slightly higher burden shares exceeding 64%. At the other end of the spectrum is Wisconsin’s 7th, where just a third of renter households experience housing cost burdens.

Florida, New York, and California stand out for simultaneously having congressional districts with the highest shares of cost burdened renters and owners. The heaviest owner burden rates dozen consists of five congressional districts in New York and California each and two in Florida. In New York’s 9th and 8th districts, 43% and 42% of home owners, respectively, spend 30% of more of their income on housing. While high property taxes contribute heavily to owners’ burden in New York and California, fast rising insurance premiums strain home owners’ budgets in Florida.

The list of congressional districts with the lowest ownership burden rates include Alabama’s 5th, West Virginia’s 1st and 2nd, North Dakota’s at-Large, South Carolina’s 4th, Indiana’s 4th, 5th, and 6th, Arkansas 3rd, Tennessee’s 2nd, Missouri’s 3rd and 6th. Less than 17% of home owners in these districts spend 30% of their income or more on housing.

Additional housing data for your congressional district are provided by the US Census Bureau here.

Discover more from Eye On Housing

Subscribe to get the latest posts sent to your email.


This article was originally published by a eyeonhousing.org . Read the Original article here. .

Nationally, nearly 140 million people in the United States routinely commuted to work, according to NAHB analysis of the 2023 American Community Survey data. Among these people, approximately 23.8 million people spent more than 90 minutes each day going to and from their place of employment, and nearly 12.5 million commuters traveled at least 120 minutes daily.

According to the Nobel Prize winner Daniel Kahneman’s research (2004), “commuting to work” was one of the least enjoyable activities and was most frequently associated with negative feelings during the day. While much research has revealed that longer commute times are associated with lower happiness and well-being, research by political scientists Benjamin Newman, Joshua Johnson, and Patrick Lown found that commuting significantly decreases political participation. People with long commute times are less involved in politics.

As the presidential election approaches, it is worth noting the variation in commute times across congressional districts. By analyzing the data from the American Community Survey (ACS) 1-year estimates, we summarize trends in the mean travel time among U.S. workers between 2010 and 2023 and also provide a deeper understanding of geographic patterns and the variation in commute times across congressional districts. In this article, “mean travel time to work” is calculated by dividing the total one-way commute time by the number of workers who commute. It indicates the average time workers spend traveling from home to work daily.

From 2010 to 2019, the mean travel time to work in the United States increased every year. In 2021, the COVID-19 pandemic led to a significant increase in remote work, meanwhile, the mean travel time to work decreased dramatically. Since then, the mean travel time to work increased by 1.2 minutes to 26.8 minutes in 2023 but remained below its historic high of 27.6 minutes in 2019.

Commute times vary across congressional districts and show geographical patterns. The map above illustrates the variation in the mean travel time to work in 2023 by five categories from light teal to dark blue (data is not available for Texas’s 27th congressional district). The lightest teal represents these congressional districts where people spend 17.2 – 19.9 minutes traveling to work daily, while the dark blue marks these congressional districts where people spend 35 minutes or more traveling to work daily, on average.

Noticeably, most people in the Mountain and West North Central Divisions have smaller travel times than those in the coastal states. In the least mean travel time category (between 17.2 and 19.9 minutes), there are 12 congressional districts in total. These include two congressional districts in both Nebraska and Iowa, one in Kansas, Texas, Montana, and Oregon, and four at-large congressional districts in South Dakota, North Dakota, Wyoming, and Alaska. Nebraska’s 3rd congressional district, one of the largest non-at-large districts in the United States, had the least mean travel time to work among all 436 congressional districts. People from Nebraska’s 3rd district spent only 17.2 minutes traveling to work on average and 80% of them drove alone to work. It was followed by Kansas’s 1st congressional district and Texas’s 19th congressional district.

Within the top mean travel time category, people spend 35 minutes or more traveling to work daily. It includes 12 congressional districts in New York, three in California, two in Maryland, and one in both Virginia and New Jersey.

It is no surprise that New York had the longest commute time in the United States. The mean travel time to work was 32.8 minutes daily, on average. Out of 26 congressional districts in New York, 18 of them had higher mean travel time to work than the national average of 26.8 minutes. The top eight congressional districts with the highest mean travel time to work were all in New York.

A larger share of people who worked outside their county of residence partially explains longer commute times in congressional districts where people spent 35 minutes or more traveling to work daily. For example, New York’s 5th congressional district, with the highest mean travel time to work of 45.5 minutes, reported that 45.3% of people worked outside their county of residence. Meanwhile, congressional districts in the least mean travel time category reported a significantly smaller share of people who worked outside their county of residence. Only 18% of people in Nebraska’s 3rd congressional district worked outside their county of residence. The majority of people in these districts worked in their county of residence.

Housing is a key issue for long commute times as it affects the distance between home and work. The results from NAHB’s HBGI showed that since the beginning of the COVID-19 pandemic housing demand has shifted from higher-density core areas to low-density markets, where homes are larger and more affordable. Additionally, a published study (2022) found that lack of affordable housing increased commute times as people moved to lower-cost housing in the outer reaches of major metro areas. To reduce commute times, the authors suggest creating and preserving dedicated affordable housing units, changing zoning to allow for more housing development, relaxing housing regulations to facilitate higher-density development, increasing government housing subsidies, and adopting tenant protections.

Additional data for your congressional district are provided by the US Census Bureau here.

Discover more from Eye On Housing

Subscribe to get the latest posts sent to your email.


This article was originally published by a eyeonhousing.org . Read the Original article here. .
Pin It