Tag

OwnerOccupied

Browsing


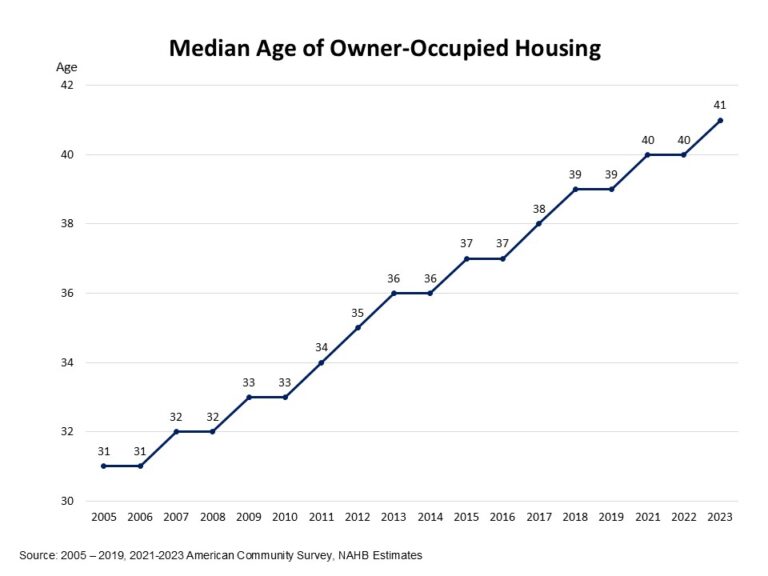
Around 48% of the U.S. housing stocks dates back to the 1980s and earlier. The median age of owner-occupied homes has climbed to 41 years in 2023, up from 31 years in 2005 according to the latest data from the American Community Survey[1]. The U.S. owner-occupied housing stock has aged rapidly particularly, particularly since the Great Recession, as the residential construction continues to fall behind in delivering new homes.

Currently, new home construction faces headwinds such as rising material costs, persistent labor shortage and elevated interest rates. These challenges have contributed to an insufficient supply of new construction, making the nation’s owner-occupied housing stock significantly older over time. As a result, the aging housing stock signals a future growing remodeling market. Older structures require updates to add new amenities or need repairs or replacements of old components.

Moreover, the lock-in effect from historically low mortgage rates during the pandemic period has led many homeowners to stay put and renovate their existing homes to accommodate the growing needs of their families. Over the long run, the aging of the housing stock implies that remodeling may grow faster than new construction.

From 2020 to 2023, new construction added nearly 2.6 million owner-occupied homes, accounting for only 3% of total owner-occupied housing stock as of 2023. Relatively newer homes built between 2010 and 2019 took up around 9% of the stock, while those constructed between 2000 and 2009 made up 15%. In contrast, around 48% of the owner-occupied homes were built before 1980, including around 35% built before 1970.

Due to modest supply of housing construction, the share of relatively newer owner-occupied homes (those built within past 13 years) has declined greatly, from 18% in 2013 to only 12% in 2023. Meanwhile, the share of older homes that are at least 44 years old has increased significantly, rising from 39% in 2013 to 48% in 2023. This shift further reflects the ongoing aging of the U.S. housing stock, highlighting the growing importance of the remodeling sector to address the growing needs of homeowners nationwide.

[1] : Census Bureau did not release the standard 2020 1-year American Community Survey (ACS) due to the data collection disruptions experienced during the COVID-19 pandemic. The data quality issues for some topics remain in the experimental estimates of the 2020 data. To be cautious, the 2020 experimental data is not included in the analysis.

Discover more from Eye On Housing

Subscribe to get the latest posts sent to your email.


This article was originally published by a eyeonhousing.org . Read the Original article here. .

With elevated interest rates and rising home prices, 103.5 million households in the United States cannot afford a $495,750 median-priced new home. The growing affordability crisis makes housing a top issue for voters in the 2024 presidential election. Both presidential candidates have offered housing policy proposals to address our nation’s housing supply and affordability challenges.

Homeownership has been a crucial part of the American Dream for over a century as owning a home not only provides households with a stable place to live, but also offers an opportunity for households to accumulate assets and build wealth over time through equity.

A recent NAHB study on home buyer preferences revealed that a single-family detached home remained the top purchase preference for two out of every three buyers. In reality, only 54% of the total housing units in 2023 were owner-occupied single-family detached homes, according to NAHB analysis of American Community Survey (ACS) data. This equates to around 70 million homes of the total 131 million housing units.

In addition, a recent article in the Washington Post stated that “the new American Dream should be a townhouse (using the term of single-family attached homes in this post).” The article argues that townhouses are more affordable, need less maintenance, and foster a sense of community. Additionally, townhomes in medium-density residential neighborhoods can be a good option for younger home buyers. However, owner-occupied single-family attached homes only accounted for 4% of the total occupied housing units in 2023.

Single-Family Detached Homes Across Congressional Districts

Across congressional districts, the share of single-family detached homes among all owner-occupied housing units varies substantially, ranging from 3% to 95%.

Texas has a high share of owner-occupied single-family homes. Texas’s 20th congressional district has the highest share of single-family detached homes. All congressional districts in Texas have at least an 83% share of single-family detached homes. Four districts in Texas, two in Indiana and Nebraska, one in Iowa, and one in California report the top ten highest share of single-family detached homes.

At the bottom of the ranking, congressional districts in New York and Pennsylvania are on the list of the ten lowest shares of single-family detached homes. New York’s 12th, 13th, and 10th, where renter-occupied housing units exceed owner-occupied ones, have the lowest share with 3%, 4%, and 5%, respectively. In addition to a lower share of single-family detached homes, New York’s 12th and 13th have a low share of single-family attached homes, with 2% for both districts. In the District of Columbia, at-large, 22% of owner-occupied single-family housing units are detached, ranked as the 12th lowest share.

Despite the geographic variation, single-family detached homes dominate most of the owner-occupied housing markets. Out of all 436 congressional districts, only 18 congressional districts have a lower share of single-family detached homes than the national level of 54%.

Single-Family Attached Homes Across Congressional Districts

Although single-family attached homes are not as popular as single-family detached homes in the owner-occupied housing market, the share of single-family attached homes shows substantial variation across congressional districts, ranging from 0% to 78%.

Pennsylvania’s 3rd congressional district has about 78% single-family attached homes, followed by Pennsylvania’s 2nd district with 75% single-family attached homes, and Maryland’s 7th district with 57%. The District of Columbia, at-large, with only 22% single-family detached homes, was ranked as the fourth highest share of single-family attached homes (43%).

Single-family attached homes have become popular as more home buyers are looking for “medium-density residential neighborhoods, such as urban villages that offer walkable environments and other amenities”, as mentioned in an NAHB blog post.

Median Home Value

The median value of owner-occupied housing units in the United States is $340,200, though it varies significantly across congressional districts depending on local housing supply and demand, property size, neighborhood, and overall economic factors. Coastal areas often have significantly higher median home values than rural regions.

Analysis of the 2023 ACS data shows that of the 14 congressional districts where median house value exceeds one million, 12 of them are in California. California’s 16th congressional district has the highest median home value of $1,820,400 among all congressional districts, with 81% of 159,895 owner-occupied housing units valuing more than one million dollars.

New York’s 12th and 10th congressional districts, with only 3% and 5% single-family detached homes, are the other two districts where median home value is over one million.

Additional housing data for your congressional district are provided by the US Census Bureau here.

Discover more from Eye On Housing

Subscribe to get the latest posts sent to your email.


This article was originally published by a eyeonhousing.org . Read the Original article here. .

Pin It