Tag

other housing data

Browsing


The majority of NAHB builder members are small businesses, according to the annual census of its members NAHB has been conducting since 2008. The most recent installment of the census was conducted at the end of 2023 and covered business activity through 2023.

The census shows that, on average, NAHB builders started 59.2 homes in 2023 (37.3 single-family and 21.9 multifamily). However, the median number of homes started was only six. Because the data include a small percentage of very large builders, the average number of starts is much higher than the median. For that reason, the median may better represent the experience of the typical NAHB builder.

Another, conventional way to evaluate the size of a business is by the annual revenue it generates. In the 2023 NAHB census, 14% of builders reported a dollar volume of less than $500,000, 12% reported between $500,000 and $999,999, 38% between $1.0 and $4.9 million, 15% between $5.0 and $9.9 million, 6% between $10.0 million and $14.9 million, and 14% reported $15.0 million or more. Only 1% reported no business activity at all in 2023. The median edged up to $3.4 million (from $3.3 million in 2021 and 2022). For comparison, the Small Business Administration’s size standards classify residential builders and remodelers as small if they have average annual receipts of $45.0 million or less ($34.0 million or less for land developers).

Historically, NAHB initiated the current version of its member census during the industry-wide downturn of 2008, when the median annual revenue of builder members was only around $1.0 million. Median annual revenue began rising in 2013, as the industry slowly recovered, plateauing at $2.6 to $2.7 million from 2017 through 2020, before jumping to $3.3 million in 2021 and 2022 and then edging up by another $0.1 million in 2023.

Due to their status as small businesses and extensive use of subcontractors, many builders carry relatively few employees on their payrolls. In NAHB’s 2023 census, builder members reported a median of six employees, including employees in both construction and non-construction jobs.

Whether based on the median of six employees, the median of six homes started, or the median annual revenue of $3.4 million, it is safe to conclude that the majority of NAHB’s builder members qualify as small businesses.

For more detail on the 2023 NAHB Builder Member Census, including a profile for each of the seven major categories of builder, please see the July 2024 Special Study.

Discover more from Eye On Housing

Subscribe to get the latest posts sent to your email.


This article was originally published by a eyeonhousing.org . Read the Original article here. .

According to the Federal Reserve Board’s July 2024 Senior Loan Officer Opinion Survey (SLOOS), lending standards were essentially unchanged for all residential real estate (RRE) categories in the second quarter of 2024.  However, demand for RRE loans remained modestly weaker across all categories in the quarter.  Lending conditions were significantly tighter, and loan demand modestly was weaker across all commercial real estate (CRE) loan categories.  Nevertheless, language from the most recent Federal Open Market Committee (FOMC) suggest that cuts to the federal funds rate are imminent which will be welcomed relief for the real estate market and will help stimulate future loan activity.

Residential Real Estate (RRE)

Four of the seven RRE categories (GSE-eligible, non-Qualified Mortgage or QM jumbo, Non-QM non-jumbo, and Subprime)recorded a net share of banks reported tighter lending standards in Q2 2024 as neutral (i.e., 0%) . The other three categories, which included government (i.e., issued by FHFA, Department of Veteran Affairs, USDA, etc.), QM jumbo, and QM non-jumbo non-GSE eligible recorded a negative reading which means that more banks reported looser rather than tighter conditions.

Six of the seven categories of RRE loans showed a decrease in net tightening from Q1 2024 to Q2 2024, with the only exception being GSE-eligible which increased 1.8 percentage points.  The largest drop in the net tightening percentage occurred for Non-QM jumbo which fell 9.8 percentage points (pp) from 9.8% in Q1 2024 to 0% in Q2 2024.

All RRE categories reported net weaker demand in Q2 2024.  The survey has shown that banks have indicated weaker demand for at least 12 consecutive quarters for all RRE categories going back to Q2 2021 (Subprime leads all RRE categories at 16 consecutive quarters).

Commercial Real Estate (CRE)

Banks reported significantly tighter lending conditions for both multifamily as well as all CRE construction & development loans in Q2 2024.  However, both categories showed less net tightening than they did a quarter before, most noticeably multifamily falling 11.7 percentage points.  Nevertheless, it has been 10 consecutive quarters of tighter lending conditions for construction & development and 9 consecutive quarters for multifamily.

For multifamily, 17.5% of banks reported net weakening of demand for loans which is 16.4 percentage points lower compared to Q1 2024.  As for construction & development loans, 15.9% of banks reported net weakening of demand for loans which was little changed from the previous quarter.  Weaker demand has persisted for roughly the last two years for construction & development (10 consecutive quarters) and multifamily (8 consecutive quarters).

Special Questions

The Federal Reserve included a set of special questions this quarter which asked banks “to describe the current level of lending standards at your bank relative to the range of standards that has prevailed between 2005 and the present.”  Effectively, they are asking banks to think about the median lending standards over the last two decades and determine where do conditions today rank on this continuum.  On balance, banks indicated that the current level of lending standards is located at the tighter end of this range for all loan categories, including CRE and RRE loans.

Discover more from Eye On Housing

Subscribe to get the latest posts sent to your email.


This article was originally published by a eyeonhousing.org . Read the Original article here. .


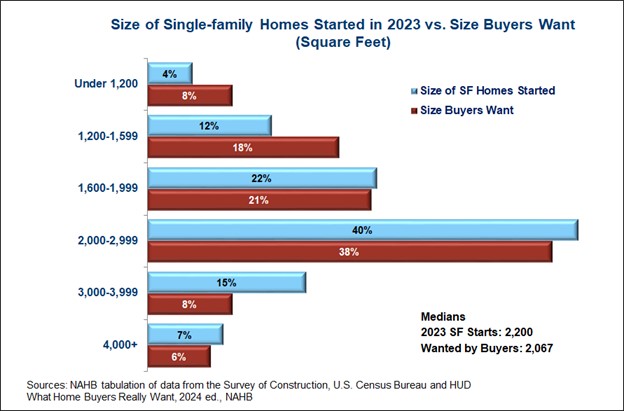
The share of new single-family homes built in the 1,600-3,000 square-foot range closely matches the share of buyers who want homes of that size, according to recent surveys from NAHB and the U.S. Census Bureau. The surveys show that 21% of buyers want homes with 1,600 to 1,999 square feet, and 22% of new single-family homes started in 2023 have that much floor space. In the next tier up, 38% of buyers want homes with 2,000 to 2,999 square feet, and 40% of new single-family homes fall within that size range.

Results on the square footage buyers want in their next home were published in the 2024 edition of What Home Buyers Really Want, based on a representative sample of 3,008 recent and prospective home buyers conducted in 2023. The size of homes started comes from NAHB tabulation of the recently released 2023 data file from the Census Bureau’s Survey of Construction.

Outside of the 1,600-3,000 square-foot range, the match between what buyers want and what builders provide is not as close. While 26% of buyers want homes under 1,600 square feet, only 16% of single-family homes started in 2023 were that small. And while 22% of new homes have at least 3,000 square feet, only 14% of buyers are looking for homes that large.

Part of the reason for the apparent mismatch, of course, is that builders are compensating for the existing stock of housing, much of which was built decades ago when homes tended to be smaller. According to the latest American Housing Survey (funded by HUD and conducted in odd-numbered years by the Census Bureau), a full one-third of existing homes in the U.S. have less than 1,500 square feet of floor space. Moreover, the median size of an existing single-family detached home is 1,800 square feet, compared to 2,200 square feet for single-family homes started in 2023 and the 2,067 square feet that home buyers say they want in the NAHB survey.

In other words, the median buyer wants a home that is 133 square feet smaller than the median new single-family home, but still 267 square feet larger than the median existing single-family detached home.

Discover more from Eye On Housing

Subscribe to get the latest posts sent to your email.


This article was originally published by a eyeonhousing.org . Read the Original article here. .


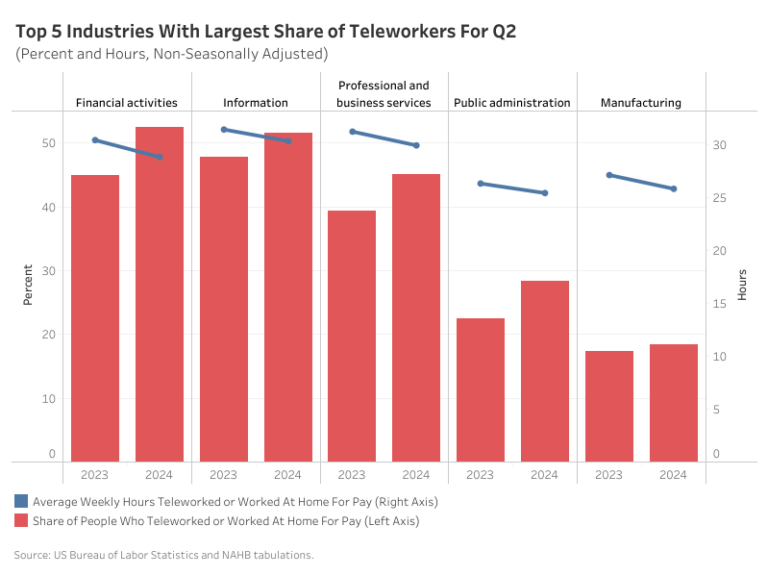
The total share of workers teleworking or working from home for pay has increased from 2023, according to the latest Telework or Work at Home for Pay Survey from the Bureau of Labor Statistics. In June 2023, 19% of the labor force teleworked on a non-seasonally adjusted basis. This share rose to 22.3% in June 2024, even though the total number of workers remained stable. However, the average weekly hours of remote work among teleworkers decreased slightly by 1.7 hours, from 28.7 to 27 hours a week. This decline is due to a shift toward hybrid work, with the proportion of people working all their hours remotely dropping from 53.2% to 48.4%.

Across all occupations, the share of teleworkers has increased, while the average weekly telework hours have declined. Management, professional, and related occupations had the highest share of teleworkers, with 37.8% working remotely in June, averaging 27.1 hours per week. In contrast, natural resources, construction, and maintenance occupations had the lowest share, with only 3.0% teleworking for an average of 21.4 hours a week.

By industry, financial activities saw the largest increase in teleworkers, rising by 7.5 percentage points from 44.9% in June 2023 to 52.4% in June 2024. Meanwhile, the average weekly telework hours for this industry decreased modestly from 30.4 hours to 28.8 hours. The information industry, previously the leader in telework, increased by 3.8 percentage points, from 47.8% to 51.6%. Its average weekly telework hours declined by 1.1 hours, from 31.4 to 30.3 hours.

The increase in teleworking has significant implications for the housing and real estate market. With more people working from home, there may be a growing demand to remodel their current homes to have dedicated office spaces. Additionally, commercial real estate could face challenges as businesses reconsider their office space needs, potentially leading to an increase in flexible workspaces or a reevaluation of leasing strategies.

There are also policy proposals that NAHB supports which aim to repurpose underused commercial spaces into residential real estate, such as the “Revitalizing Downtowns and Main Streets Act” that proposes a 20% tax credit to encourage converting vacant commercial properties into affordable housing, thereby addressing the nationwide housing shortage.

Discover more from Eye On Housing

Subscribe to get the latest posts sent to your email.


This article was originally published by a eyeonhousing.org . Read the Original article here. .

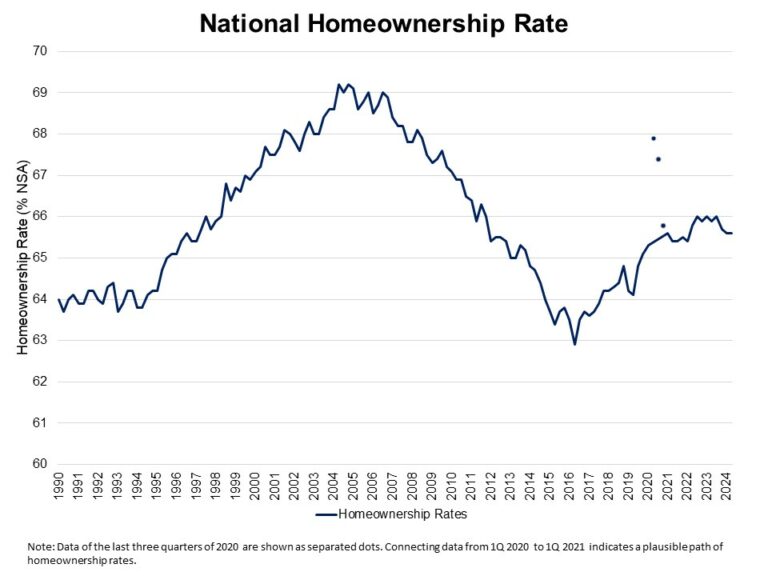
The U.S. homeownership rate was 65.6% in the second quarter of 2024, unchanged from the first quarter of 2024, according to the Census’s Housing Vacancies and Homeownership Survey (HVS). However, this marks the lowest rate in the last two years. The homeownership rate is below the 25-year average rate of 66.4%, due to a multidecade low for housing affordability conditions.

The homeownership rate for the head of households (householders) under the age of 35 decreased to 37.4% in the second quarter of 2024. Amidst elevated mortgage interest rates and tight housing supply, affordability is declining for first-time homebuyers. This age group, who are particularly sensitive to mortgage rates, home prices, and the inventory of entry-level homes, saw the largest decline among all age categories.

The national rental vacancy rate stayed at 6.6% for the second quarter of 2024, and the homeowner vacancy rate inched up to 0.9%. The homeowner vacancy rate is still hovering near the lowest rate in the survey’s 67-year history (0.7%).

The homeownership rates for householders under 35, between 35 and 44, and 65 and over decreased compared to a year ago. The homeownership rates among householders under 35 experienced a 1.1 percentage point decrease from 38.5% to 37.4%. Followed by the 35-44 age group with a 0.9 percentage point decrease from 63.1% to 62.2%. Next, were households with ages 65 years and over, who experienced a modest 0.3 percentage point decline. However, homeownership rates for the 45-54 age group inched up to 71.1% in the second quarter of 2024 from 70.8% a year ago. The homeownership rate of 55-64 year olds edged up to 75.8% from a year ago.

The housing stock-based HVS revealed that the count of total households increased to 131.4 million in the second quarter of 2024 from 130 million a year ago. The gains are largely due to gains in both renter household formation (855,000 increase), and owner-occupied households (515,000 increase).

Discover more from Eye On Housing

Subscribe to get the latest posts sent to your email.


This article was originally published by a eyeonhousing.org . Read the Original article here. .

Nationwide, the share of non-conventional financing for new home sales accounted for 32.4% of the market per NAHB analysis of the 2023 Census Bureau Survey of Construction (SOC) data. This is a significant 4.3 percentage point increase from the 2022 share of 28.1%. As in previous years, conventional financing dominated the market at 67.6% of sales, albeit lower than the 2022 share of 71.9%.

Non-conventional forms of financing, as opposed to conventional mortgage loans, include loans insured by the Federal Housing Administration (FHA), VA-backed loans, cash purchases and other types of financing such as the Rural Housing Service, Habitat for Humanity, loans from individuals, or state or local government mortgage-backed bonds. The reliance on non-conventional forms of financing varied across the United States, with its share at almost 40% in West South Central but only 17.1% of new single-family home starts in the Middle Atlantic division.

Nationwide, cash purchases were the majority share of non-conventional financing of new home purchases, accounting for 14% of the market share, slightly up from 13% in 2022. NAHB survey based on builders reported that for 2024, all-cash sales are a higher share at 22%. FHA-backed loans accounted for 12%, whereas in 2022, it was only 8% of the market share. The share of VA-backed loans was at 4% market share in 2023, while Other Financing was 3% of market share.

Regionally, cash financing held the highest share in East South Central, where 24.6% of all homes started were purchased with cash. Except for the South Atlantic, West South Central, and the Pacific, cash purchases led non-conventional financing in the remaining six census regions. Cash purchases accounted for 22.0% in East North Central, 16.9% in New England, 12.3% in Mountain, 12.0% in Middle Atlantic, and 10.6% in West North Central region.   

FHA-backed loans accounted for the majority of all non-conventional financing in the West South Central division accounting for 20.8% of the homes started. This share has gone up considerably  from 12.9% in 2022. The New England division reported the lowest FHA-backed loans with only a share of 1.2% of the homes started in 2023.

VA-backed loans were most used in the South Atlantic division, which accounted for 5.9% of non-conventional forms of financing. In New England, none of the homes started used VA-backed loans in 2023.  

Other financing such as the Rural Housing Service, Habitat for Humanity, loans from individuals, state or local government mortgage-backed bonds was highest in East North Central where it was collectively 5.6% of market share, while Middle Atlantic division reported the lowest share at 0.9%.

Discover more from Eye On Housing

Subscribe to get the latest posts sent to your email.


This article was originally published by a eyeonhousing.org . Read the Original article here. .
Pin It