Tag

other housing data

Browsing


New manufactured homes saw a decline in shipments in 2023 compared to the previous year. According to the Manufactured Housing Survey (MHS), 89,169 manufactured homes were shipped in 2023, a decrease of 21% from the 112,882 homes shipped in 2022. The Census defines a manufactured home as a movable dwelling, 8 feet or more wide and 40 feet or more long, designed to be towed on its own chassis, with transportation gear integral to the unit when it leaves the factory, and without need of a permanent foundation. No building permit is required for a manufactured home.

Despite the 2023 decline, the ratio of shipments to new single-family site-built home construction starts remained consistent between 1 to 9 and 1 to 10. In 2023, that number was 1 to 10, meaning that for every new manufactured home shipped, 10 new single-family site-built homes started construction. Of the total 2023 shipments, 35.7% (31,830 homes) were either sold or leased, while 2022 saw 46,696 (49%) being sold or leased.

Regionally, the South continued to receive the majority of shipments at 66%. The Midwest followed with 14%, the West with 11%, and the Northeast with 6%. Texas remained the leading state for shipments, accounting for 15,073 homes, which represents 17% of the total. Altogether, the top ten states comprised over 60% of the shipment share, highlighting a concentrated market presence.

Breaking down the types of manufactured homes shipped, 45% were single-section units. These homes had an average sales price of $84,800 and an average area of 1,038 square feet, translating to a price of $81.70 per square foot. In contrast, 54% of the shipments were multi-section homes, with an average sales price of $154,100 and a larger area of 1,748 square feet, equating to $88.16 per square foot. When compared to new single-family site-built homes started in 2023, which had an average price of $165.94 per square foot (excluding land value), multi-section manufactured homes are approximately 1.9 times less expensive per square foot.

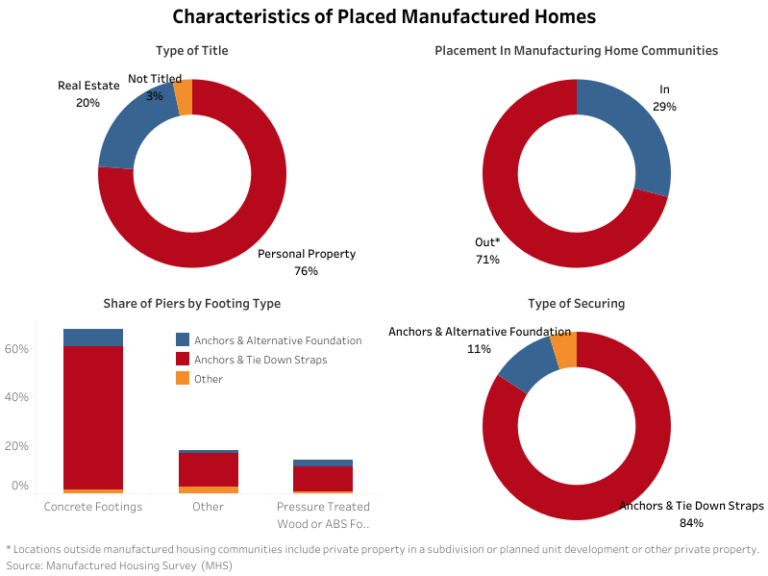
Out of the total homes shipped, 70% (59,950 homes) were placed at their final destinations. Among the placed homes, 21% were titled as real estate property, while the majority, 76%, were classified as personal property. Additionally, only 29% of the placed homes were situated within a manufactured housing community. Census doesn’t have an official definition of a manufactured housing community, but as an example of the industry’s term of art, Law Insider defines it as “any area where two or more manufactured home lots are leased specifically for the use of manufactured homes”.

Looking into other characteristics of placed manufactured homes, over half (57%) had concrete footings. Pressure-treated wood and monolithic-slab foundations comprised 12% each, and basement or crawl space foundations was 4%. For homes not placed on concrete or slab foundations, the most common type of pier is concrete block (77%) while the majority (84%) were secured using anchors and tie-down straps, and 11% utilizing anchors and alternative foundations.

Discover more from Eye On Housing

Subscribe to get the latest posts sent to your email.


This article was originally published by a eyeonhousing.org . Read the Original article here. .

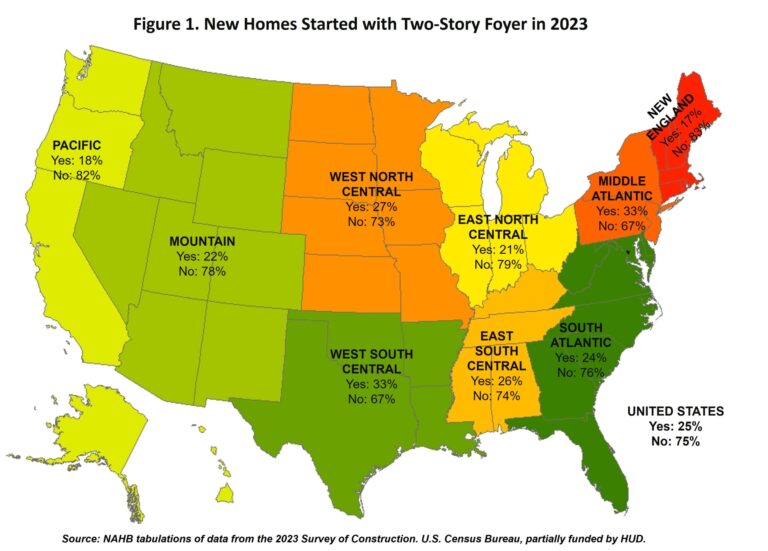
In 2023, a quarter of new homes were built with a two-story foyer, down slightly from 26% in 2022, according to data obtained from the Census Bureau’s Survey of Construction (SOC) and tabulated by NAHB. The market share of two-story foyers has been generally trending downward over the past seven years, with most new single-family homes being built without a two-story foyer nationally and regionally.

According to the Census, a two-story foyer is defined as the entranceway inside the front door of a house and has a ceiling that is at the level of the second-floor ceiling. In the United States, the share of new homes with two-story foyers fell from 26% to 25% in 2023, closer to the low level seen in 2021. This feature is often considered energy-inefficient and is seen as undesirable by both builders and buyers. The declining trend is in line with NAHB’s What Home Buyer’s Really Want, in which recent and prospective buyers rated their preference for 18 specialty rooms. The study found that two-story entry foyers was one of the least desired specialty rooms, with 32% buyers likely to reject a potential home with this feature, and only 13% seeing it as an essential/must-have feature.

Regionally, the share declined in five of the nine divisions. The decline was particularly pronounced in West South Central and New England, reversing the notable increases seen in 2022. In both divisions, the shares have now returned closer to their 2021 levels. The Middle Atlantic and West North Central were the only two divisions to see an increase in the share of two-story foyers from 2022 to 2023, with both shares reaching their highest levels since 2017. Meanwhile, shares in the South Atlantic and Pacific remained unchanged in 2023.

Discover more from Eye On Housing

Subscribe to get the latest posts sent to your email.


This article was originally published by a eyeonhousing.org . Read the Original article here. .

The homeownership rate for multigenerational households increased by 4.9 percentage points (pp) over the last decade, but there’s another household type that experienced an even larger increase in the homeownership rate over the same period—single parent households.

In further analysis of the Census’s American Community Survey (ACS) data, NAHB dives deeper into the homeownership rate for other family household types: married couples with no children, married couples with children and single parent households. In 2022, most family households were married with no children (44%), followed by married with children (26%), single parents (12%), others (12%), and multigenerational families (6%). This composition has not changed much, with the exception of a gradual decrease in the share of married with children and single parent households, which is offset by an increase in the share of married with no children households.

The homeownership rate for single parent households saw the largest gains in homeownership rate with an increase of 5.7 percentage points over the decade. However, the overall level of homeownership rate for single parent households remains the lowest among all other family household types at just 41%.    Another group that saw a large increase was the married couple with children households, with a 4.5% increase over the decade from 73% to 78%. Like multigenerational households, these increases were spurred on by historically low mortgage rates in 2021.

The only household type to have plateaued was married without children. As a matter of fact, these households saw decreasing homeownership rates for a few years before creeping back up to be at roughly the same rate as they were ten years ago at 84%. Nonetheless, married without children households remain as the group with the highest homeownership rate with an average rate of 84% over the decade.

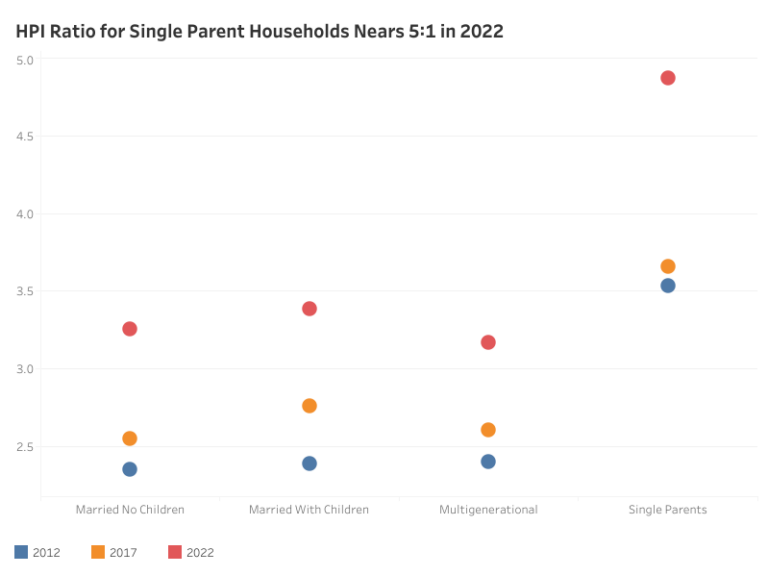
We also examined the estimated home price-to-income ratio (HPI) for various household types. To calculate the home prices for recent homebuyers we used the median property value for owners who moved into their property within the past year. Here is where we see the effect of how multigenerational households were able to lower their HPI with pooled income and budgets. In contrast are single parent households with their estimated home prices approaching five times their income, indicating that these households are significantly burdened by housing costs.   

Given that homeownership rates jumped in recent years for most household types despite increases in home prices suggests that the low mortgage rates in 2021 made steep home prices more palatable for homebuyers to enter the market. However, it is unlikely that we’ll see a continued increase in homeownership while mortgage rates remain elevated. 

Discover more from Eye On Housing

Subscribe to get the latest posts sent to your email.


This article was originally published by a eyeonhousing.org . Read the Original article here. .

With mortgage rates declining by more than one-half of a percentage point from early August through mid-September, per Freddie Mac, builder sentiment edged higher this month even as builders continue to grapple with rising costs.

Builder confidence in the market for newly built single-family homes was 41 in September, up two points from a reading of 39 in August, according to the National Association of Home Builders (NAHB)/Wells Fargo Housing Market Index (HMI). This breaks a string of four consecutive monthly declines.

Due to lower interest rates, builders now have a positive view for future new home sales for the first time since May 2024. However, builders will face competition from rising existing home inventory in many markets as the mortgage rate lock-in effect softens with lower rates.

With inflation moderating, the Federal Reserve is expected to begin a cycle of monetary policy easing this week, which will produce downward pressure on mortgage interest rates and also lower the interest rates on land development and home construction business loans. Lowering the cost of construction is critical to confront persistent challenges for housing affordability.

The latest HMI survey also revealed that the share of builders cutting prices dropped in September for the first time since April, down one point to 32%. Moreover, the average price reduction was 5%, the first time it has been below 6% since July 2022. Meanwhile, the use of sales incentives fell to 61% in September, down from 64% in August.

Derived from a monthly survey that NAHB has been conducting for more than 35 years, the NAHB/Wells Fargo HMI gauges builder perceptions of current single-family home sales and sales expectations for the next six months as “good,” “fair” or “poor.” The survey also asks builders to rate traffic of prospective buyers as “high to very high,” “average” or “low to very low.” Scores for each component are then used to calculate a seasonally adjusted index where any number over 50 indicates that more builders view conditions as good than poor.

All three HMI indices were up in September. The index charting current sales conditions rose one point to 45, the component measuring sales expectations in the next six months increased four points to 53 and the gauge charting traffic of prospective buyers posted a two-point gain to 27.

Looking at the three-month moving averages for regional HMI scores, the Northeast fell three points to 49, the Midwest edged one-point higher to 40, the South decreased one point to 41 and the West increased two points to 39.

The HMI tables can be found at nahb.org/hmi.

Discover more from Eye On Housing

Subscribe to get the latest posts sent to your email.


This article was originally published by a eyeonhousing.org . Read the Original article here. .


The homeownership rate for multigenerational households surpassed that of all other family household types in 2022 and now stands at 74.2%, exceeding the homeownership rate of other family households of 73.9%. Just a decade ago, the homeownership rate for multigenerational stood at 69.3%, second to other family households at 71.3%.

Multigenerational households are defined by the Census Bureau as households with three or more generations living together. In this post, NAHB used the American Community Survey (ACS) 1-year estimates from 2012 to 2022 to estimate the homeownership rates (which is calculated as the total number of owner-occupied units divided by the total number of applicable households) for different household types.

In 2012, the homeownership rate for multigenerational households stood at 69.3%, 2 percentage points (pp) below the 71.3% homeownership rate for other family households. The gap in homeownership rates between these household types remained with higher rates for other family households until 2021. By 2022, the gap inverted with 74.2% of multigenerational households owning homes versus 73.9% of other family households. This represents about a 5 pp increase in homeownership rate for multigenerational households over the decade compared to a 2.6 pp increase for other family households.

The primary factor that explains the rise in the multigenerational household homeownership rate is the availability of more capital during the period of low interest rates in 2021. While the median family income for multigenerational households consistently exceeds that of other family households’ income due to resource pooling, this difference has widened over time. For example, real median income for multigenerational households and other family households in 2012 were $63,643 and $62,633, respectively, with a difference of about $1,000. By 2022, this difference widened almost twelvefold to $11,778, with multigenerational households earning $103,501 and other family households earning $91,723.

Changes in family structure can be ruled out as a factor in this difference as the average household size has remained constant over the decade with an average of 5.1 people per multigenerational household, of which two are working members, while other family households have had an average of 3.1 people and 1.5 working members. This suggests that the income per person in a multigenerational household has been rising faster than other family households.

Income pooling has also buffered multigenerational households through rising home prices despite the higher prevalence of these households in more cost burdened areas. The chart below shows a strong correlation between the owner housing cost burdens and the incidence of multigenerational households. States with larger shares of housing cost burdened households (those that spend more than 30% of their income on housing) also have the higher shares of multigenerational households.

The faster growing income of multigenerational households also helped them afford more expensive homes in recent years, compared to other family households.  Looking at homeowners that moved into owned properties within the year (as a proxy for recent homebuyers), the median home values for multigenerational households have gone from $165,000 in 2012 to $400,000 in 2022. In comparison, the median home values for other family homebuyers went from $180,000 to $380,000. In other words, multigenerational households now pay $20,000 more for a home. However, because they have a higher pooled household income, their estimated home price-to-income (HPI) ratio remains lower than that of other family households.

To conclude, the rising homeownership rate among multigenerational households highlights their financial resilience and adaptability in the face of changing economic conditions. Despite living in less affordable states, these households leverage their pooled incomes to navigate higher home prices effectively. The significant increase in their median income over the past decade has enabled them to capitalize on favorable mortgage rates and propel their homeownership rate to a new decade high.

Footnote:

Discover more from Eye On Housing

Subscribe to get the latest posts sent to your email.


This article was originally published by a eyeonhousing.org . Read the Original article here. .


 In 2022, the total count of second homes was 6.5 million representing 4.6% of the total housing stock, according to NAHB estimates. This reflects a decline from 2020, when the number of second homes stood at 7.15 million.

As of 2022, the state with the largest stock of second homes was Florida (1 million), accounting for 15.3% of all second homes. Wyoming had the smallest stock with approximately 16,320 second homes, . Half of the nation’s second homes can be found in these seven states – Florida, California, New York, Texas, Michigan, North Carolina, Arizona, and Pennsylvania.

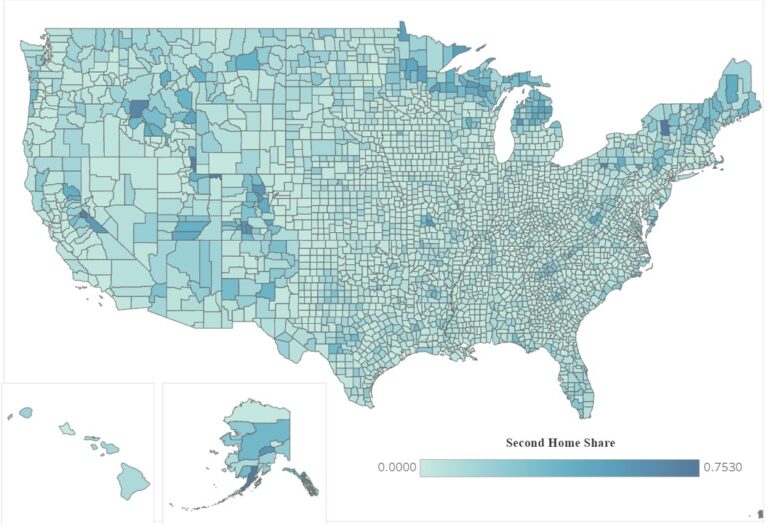
In-depth analysis of the county level data shows that the concentration of second homes is not simply restricted to conventional locations like beachfront areas. There were 807 counties spread over 50 states where second homes accounted for at least 10% of the local housing stock. Only Washington D.C. was the exception, reporting a second home share of 1.8%. Across the nation 314 counties, 10% of all counties in the U.S., had at least 20% of housing units that were made up of second homes.

Counties where at least half of their housing stock is second homes were widely spread over in 14 states.  Of these counties, four were in Wisconsin, four in Colorado, two in Michigan, Minnesota, Utah, California, Massachusetts, and Pennsylvania, and one county each in Alaska, Idaho, Maryland, Missouri, New Jersey, and New York, These national patterns are mapped below.

Counties with more than 25,000 second homes are mostly located in or near metropolitan areas.  The top 10 counties with the most second homes account for around 11.2% of second home stocks, most of which were in Arizona, Florida, California, Massachusetts, and New York. Of the top 10 counties regarding absolute numbers of second homes, only three counties (Lee County, Florida, Barnstable County, Massachusetts, and Collier County, Florida) had more than 20% of their housing stock in second homes.

In terms of methodology, this analysis focuses on the number and location of second homes that would be qualified for the home mortgage interest deduction by individuals using the Census Bureau’s 2022 American Community Survey (ACS). It does not account for homes held primarily for investment or business purposes.

NAHB estimates are based on the definition used for home mortgage interest deduction: a second home is a non-rental property that is not classified as taxpayer’s principal residence. Examples could be: (1) a home that used to be a primary residence due to a move or a period of simultaneous ownership of two homes due to a move; (2) a home under construction for which the eventual homeowner acts as the builder and obtains a construction loan (Treasury regulations permit up to 24 months of interest deductibility for such construction loans); or (3) a non-rental seasonal or vacation residence. However, homes under construction are not included in this analysis because the ACS does not collect data on units under construction.

Discover more from Eye On Housing

Subscribe to get the latest posts sent to your email.


This article was originally published by a eyeonhousing.org . Read the Original article here. .

NAHB analyzed the national market share data released by BUILDER Magazine in a previous blog post.  Last month, BUILDER Magazine released new data on the top 10 home builders within each of the 50 largest new home markets in the U.S. (ranked by single-family permits) (Figure 1).  It is important to note that this post is not specifically analyzing the top 10 largest home builders nationally and each market can differ in its respective top 10 home builder composition.

The top 10 home builders accounted for varying shares, ranging from 40.1% of single-family permits in the Kansas City area to 98.8% in Columbia, SC.  In 11 metro areas, the top 10 builders’ market share exceeded 90%. Across the 50 largest metro areas, the average market share of the top 10 builders was 78.2%, up from 73.3% in 2022.

Looking at results on a map reveals that Florida, South Carolina, Virginia, and southern California have multiple highly concentrated markets.  Texas and the Northwest include markets with lower levels of concentration.

D.R. Horton made the top 10 builder list in 47 markets, the most among all builders.  Lennar and PulteGroup followed, present in the top 10 builder list of 45 and 35 different metro markets, respectively.

From 2022 to 2023, 34 metro areas saw an increase with their top 10 builders’ market share while nine metro areas saw decreases.  The top 5 metro areas with the biggest increases were:

Los Angeles-Long Beach-Anaheim, CA (90.3%, +26 percentage points)

Myrtle Beach-Conway-North Myrtle Beach, SC-NC (92.3%, +16.4 percentage points)

Riverside-San Bernadino-Ontario, CA (94.9%, +16.1 percentage points)

Cape Coral-Fort Myers, FL (96.2%, +15.3 percentage points)

New York-Newark-New Jersey City, NY-NJ-PA (62.6%, +14.9 percentage points)

Of the nine metro markets that saw decreases in the single-family permit share controlled by their top 10 builders, the five largest decreases were seen in:

Portland-Vancouver-Hillsboro, OR-WA (66%, -8.7 percentage points)

North Port-Sarasota-Bradenton, FL (79.1%, -7.4 percentage points)

Deltona-Daytona Beach-Ormond Beach, FL (72.4%, -7.2 percentage points)

Seattle-Tacoma-Bellevue, WA (59.4%, -5.5 percentage points)

Salt Lake City, UT (59.3%, -4.3 percentage points)

Discover more from Eye On Housing

Subscribe to get the latest posts sent to your email.


This article was originally published by a eyeonhousing.org . Read the Original article here. .


Every year since 2008, the NAHB has conducted a member census in order to better understand the composition and characteristics of the people who belong to its organization.  Similar to a previous post about builder members, NAHB conducted a related analysis of its associate members.  In 2023, 65% of NAHB’s members were associate members—those involved in a wide range of support industries and professions including, among others, trade contractors, manufacturers, retailers/distributors, designers, and architects.

Of the 69,645 associate members, 45% are primarily subcontractor/specialty trade contractors, 11% have a professional specialty, 10% are retail dealerships or distributorships, 8% are in financial services, 5% are wholesale dealerships or distributorships, and 17% have some other type of primary activity (Exhibit 1).

In 2023, associate members had a median of 12 employees on payroll, which ties an all-time high set in 2022.  Twenty-two percent of associate members had 1-4 employees, 20% had 5 to 9, 37% had 10 to 49, and 20% had 50 or more employees.  Two percent had no payroll at all.

The median revenue of NAHB associate members was $3.0 million in 2023, an increase from $2.8 million in 2022 and the highest in the 16-year history of the Census (Exhibit 2).

In 2023, the median age of NAHB associate members was 56 which is unchanged from 2022.  Four percent of associate members were less than 35 years old, 15% were 35 to 44, 26% were 45 to 54, 34% were 55 to 64, and 21% were 65 or older.  The share of associate members who identify as female snapped a string of six consecutive annual increases, falling 2 percentage points to 24% from an all-time survey high of 26% in 2022.

For more details about NAHB associate members and a profile of each type of member, please visit housingeconomics.com or click here for the full article.

Discover more from Eye On Housing

Subscribe to get the latest posts sent to your email.


This article was originally published by a eyeonhousing.org . Read the Original article here. .


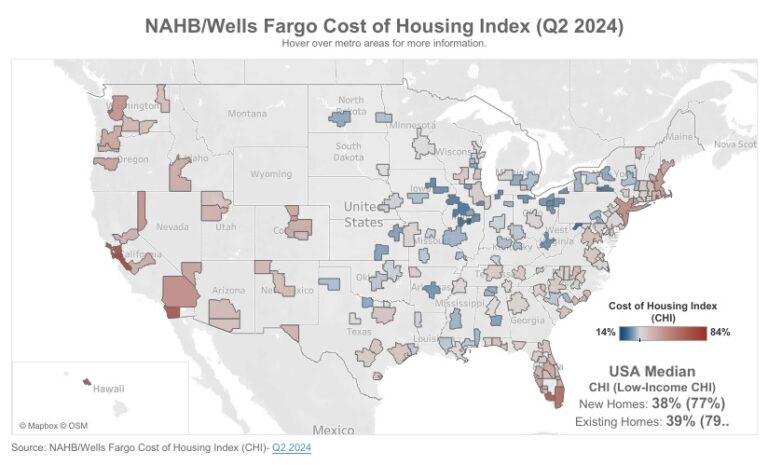
NAHB’s Cost of Housing Index (CHI) highlights the burden that housing costs represent for middle and low-income families. In the second quarter of 2024, the CHI found that a family earning the nation’s median income of $97,800 must spend 38% of its income to cover the mortgage payment on a median-priced new single-family home. Because a typical existing home in the second quarter was more expensive ($422,100) than a typical newly built home ($412,300), the CHI for existing homes was higher, at 39%. 

Low-income families, defined as those earning only 50% of median income, would have to spend 77% of their earnings to pay for a new home and 79% for an existing one.

The latest results reveal that affordability has worsened for existing homes. A typical family needed 39% of its income to pay for a median-priced existing home in the second quarter, up from 36% in the first quarter. A low-income family needed 79% of its income vs. 71% in the previous quarter. In contrast, the CHI and low-income CHI for new homes remained unchanged between the first and second quarters of 2024, at 38% and 77%, respectively.

Additionally, CHI is produced for existing homes in 176 metropolitan areas, breaking down the percentage of a family’s income needed to make a mortgage payment in each area based on the local median existing home price and median income. Percentages are also calculated for low-income families in these markets.

In 14 out of 176 markets in the second quarter, the typical family is severely cost-burdened (must pay more than 50% of their income on a median-priced existing home).  In 89 other markets, such families are cost-burdened (need to pay between 31% and 50%). There are 73 markets where the CHI is 30% of earnings or lower.

The Top Five Severely Cost-Burdened Markets

San Jose-Sunnyvale-Santa Clara, Calif. was the most severely cost-burdened market on the CHI during the second quarter, where 94% of a typical family’s income is needed to make a mortgage payment on an existing home. This was followed by:

• San Francisco-Oakland-Berkeley, Calif. (79%)
• San Diego-Chula Vista-Carlsbad, Calif. (76%)
• Urban Honolulu, Hawaii (76%)
• Naples-Marco Island, Fla. (74%)

Low-income families would have to pay between 147% and 188% of their income in all five of the above markets to cover a mortgage.

The Top Five Least Cost-Burdened Markets

By contrast, Decatur, Ill., was the least cost-burdened market on the CHI, where families needed to spend just 15% of their income to pay for a mortgage on an existing home. Rounding out the least burdened markets are:

• Cumberland, Md.-W.Va. (17%)
• Springfield, Ill. (18%)
• Elmira, N.Y. (18%)
• Peoria, Ill. (19%)
• Binghamton, N.Y. (tied at 19%)

Low-income families in these markets would have to pay between 30% and 39% of their income to cover the mortgage payment for a median priced existing home.

Visit nahb.org/chi for tables and details.

Discover more from Eye On Housing

Subscribe to get the latest posts sent to your email.


This article was originally published by a eyeonhousing.org . Read the Original article here. .

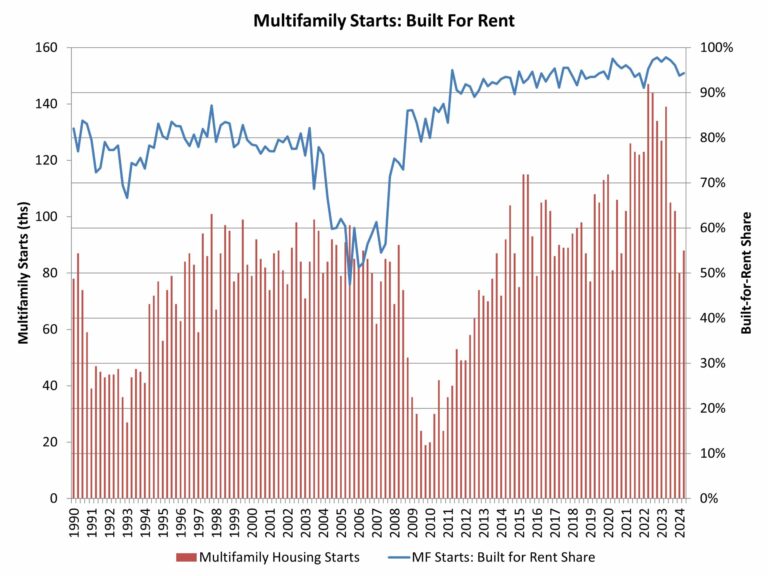
According to NAHB analysis of quarterly Census data, the count of multifamily, for-rent housing starts declined significantly during the second quarter of 2024. For the quarter, 88,000 multifamily residences started construction. Of this total, 83,000 were built-for-rent. This marks a notable 37% decline from the second quarter of 2023 for the multifamily built-for-rent category.

The market share of rental units of multifamily construction starts was flat at a still elevated 94% for the second quarter as the small condo market remained held back due to higher interest rates. In contrast, the historical low share of 47% was set during the third quarter of 2005, during the condo building boom. An average share of 80% was registered during the 1980-2002 period.

For the second quarter, there were just 5,000 multifamily condo unit construction starts.

An elevated rental share of multifamily construction is holding typical apartment size below levels seen during the pre-Great Recession period. According to second quarter 2024 data, the average square footage of multifamily construction starts was relatively unchanged at 1,034 square feet. The median declined to 955 square feet. These estimates are near multidecade lows.

Discover more from Eye On Housing

Subscribe to get the latest posts sent to your email.


This article was originally published by a eyeonhousing.org . Read the Original article here. .
Pin It