Tag

October

Browsing


Existing home sales in October rebounded from a 14-year low and posted the first annual increase in more than three years, as buyers took advantage when mortgage rates briefly reached a 2-year low in late September, according to the National Association of Realtors (NAR). While elevated home prices persist due to the lock-in effect, we expect sales activity to increase as mortgage rates moderate with additional Fed easing. Improving inventory should help slow home price growth and enhance affordability.

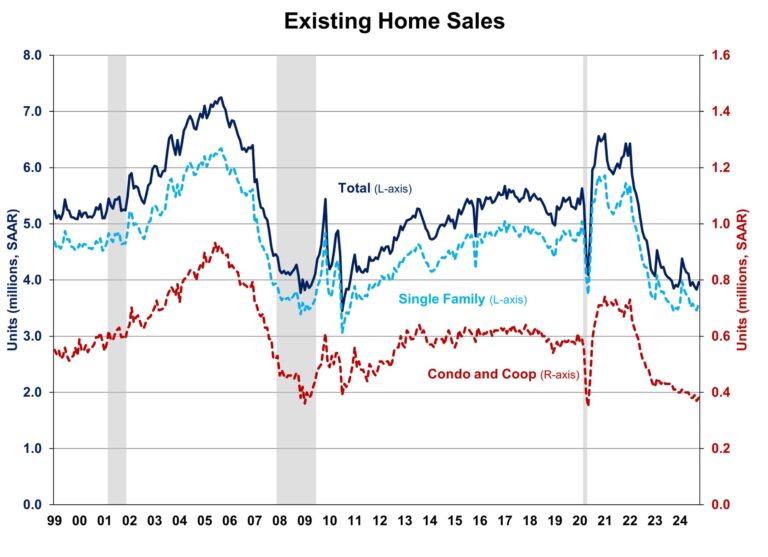
Homeowners with lower mortgage rates have opted to stay put, avoiding trading existing mortgages for new ones with higher rates. This trend is driving home prices higher and holding back inventory. With the Federal Reserve beginning its easing cycle at the September meeting, mortgage rates are expected to gradually decrease, leading to increased demand and unlocking lock-in inventory in the coming quarters. Total existing home sales, including single-family homes, townhomes, condominiums, and co-ops, rose 3.4% to a seasonally adjusted annual rate of 3.96 million in October. On a year-over-year basis, sales were 2.9% higher than a year ago, ending a 38-month streak of year-over-year declines since July 2021.

The first-time buyer share rose to 27% in October, up from 26% in September but down from 28% in October 2023.

The existing home inventory level rose from 1.36 million in September to 1.37 million units in October and is up 19.1% from a year ago. At the current sales rate, September unsold inventory sits at a 4.2-months supply, down from 4.3-months last month but up 3.6-months a year ago. This inventory level remains low compared to balanced market conditions (4.5 to 6 months’ supply) and illustrates the long-run need for more home construction.

Homes stayed on the market for an average of 29 days in October, up from 28 days in September and 23 days in October 2023.

The October all-cash sales share was 27% of transactions, down from 30% in September and 29% a year ago. All-cash buyers are less affected by changes in interest rates.

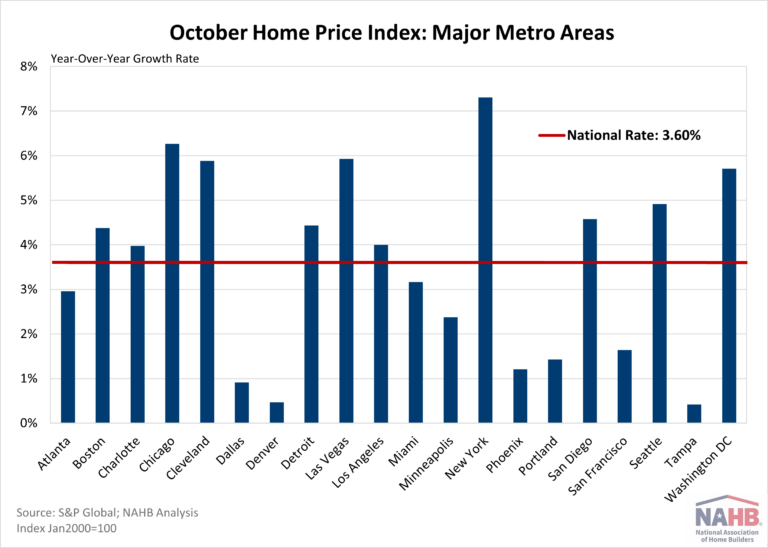
The October median sales price of all existing homes was $407,200, up 4.0% from last year. This marked the 16th consecutive month of year-over-year increases. The median condominium/co-op price in October was up 1.6% from a year ago at $360,300. This rate of price growth will slow as inventory increases.

Geographically, all four regions saw an increase in existing home sales in October, ranging from 1.3% in the West to 6.7% in the Midwest. On a year-over-year basis, sales rose 1.1%, 2.3%, and 8.5% in the Midwest, South and West. Sales in the Northeast stayed unchanged.

The Pending Home Sales Index (PHSI) is a forward-looking indicator based on signed contracts. The PHSI rose from 70.6 to 75.8 in September due to improved inventory and lower mortgage rates in late summer. On a year-over-year basis, pending sales were 2.6% higher than a year ago per National Association of Realtors data.

Discover more from Eye On Housing

Subscribe to get the latest posts sent to your email.


This article was originally published by a eyeonhousing.org . Read the Original article here. .


Clouded by hurricanes in the southeast part of the country and strike activity in the manufacturing sector, October nonfarm payroll figures were mediocre. Nonfarm payroll employment increased in 21 states in October compared to the previous month, while it decreased in 29 states and the District of Columbia. According to the Bureau of Labor Statistics, nationwide total nonfarm payroll employment increased by a meager 12,000 in October, following a gain of 223,000 jobs in September.

On a month-over-month basis, employment data was most favorable in Colorado, which added 9,000 jobs. Louisiana came in second (+7,700), followed by Ohio (+6,400). A total of 144,500 jobs were lost across 29 states and the District of Columbia, with Florida reporting the steepest job losses at 38,000. Washington lost 35,900 jobs while New York lost a total of 10,900 jobs. In percentage terms, employment increased the highest in South Dakota at 0.4%, while Washington saw the biggest decline at 1.0% between September and October.

Year-over-year ending in October, 2.2 million jobs have been added to the labor market across all 50 states and the District of Columbia. This is a 1.4% increase compared to October 2023 level. The range of job gains spanned from 2,800 jobs in Wyoming to 274,600 jobs in Texas. In percentage terms, the range of job growth spanned 3.1% in Idaho to 0.4% in Washington.

Across the nation, construction sector jobs data —which includes both residential and non-residential construction—showed that 33 states and the District of Columbia reported an increase in October compared to September, while 13 states lost construction sector jobs. The four remaining states reported no change on a month-over-month basis. Louisiana, with the highest increase, added 3,400 construction jobs, while Florida, on the other end of the spectrum, lost 5,400 jobs. Overall, the construction industry added a net 8,000 jobs in October compared to the previous month. In percentage terms, Louisiana reported the highest increase at 2.5% and Iowa reported the largest decline at 2.1%.

Year-over-year, construction sector jobs in the U.S. increased by 223,000, which is a 2.8% increase compared to the October 2023 level. Texas added 38,800 jobs, which was the largest gain of any state, while New York lost 9,200 construction sector jobs. In percentage terms, Alaska had the highest annual growth rate in the construction sector at 19.1%. Over this period, Oregon reported the largest decline of 4.3%.

Discover more from Eye On Housing

Subscribe to get the latest posts sent to your email.


This article was originally published by a eyeonhousing.org . Read the Original article here. .


Housing starts edged lower last month as average monthly mortgage rates increased a quarter-point from 6.18% to 6.43% between September and October, according to Freddie Mac.

Overall housing starts decreased 3.1% in October to a seasonally adjusted annual rate of 1.31 million units, according to a report from the U.S. Department of Housing and Urban Development and the U.S. Census Bureau.

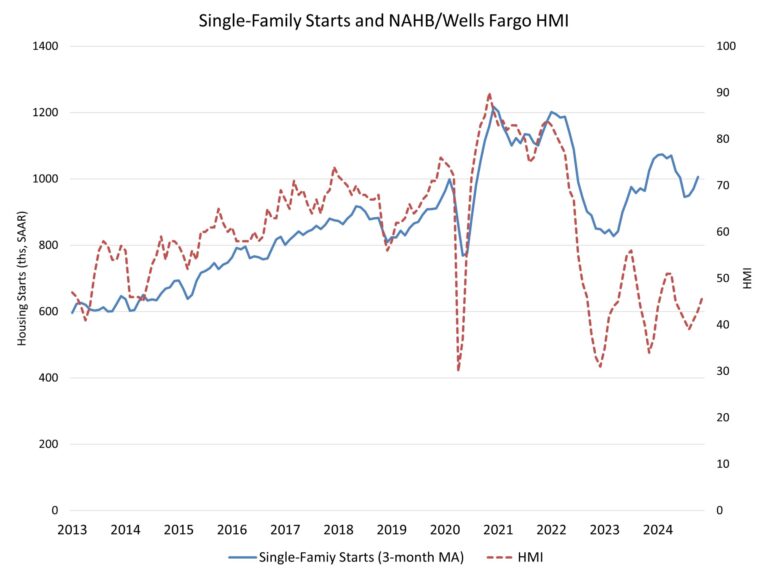
The October reading of 1.31 million starts is the number of housing units builders would begin if development kept this pace for the next 12 months. Within this overall number, single-family starts decreased 6.9% to a 970,000 seasonally adjusted annual rate. On a year-to-date basis, single-family construction is up 9.3%. The volatile multifamily sector, which includes apartment buildings and condos, increased 9.6% to an annualized 341,000 pace but are down 29.3% on a year-to-date basis.

Although housing starts declined in October, builder sentiment improved for a third straight month in November as builders anticipate an improved regulatory environment in 2025 that will allow the industry to increase housing supply. Further interest rate cuts from the Federal Reserve through 2025 should result in lower interest rates for construction and development loans, helping to lead to a stabilization for apartment construction and expansion for single-family home building.

While multifamily starts increased in October, the number of apartments under construction is down to 821,000, the lowest count since March 2022 and down 18.9% from a year ago. In October, there were 1.8 apartments that completed construction for every one apartment that started construction. The three-month moving average reached a ratio of 2 in October.

There were 644,000 single-family homes under construction in October, down 3.6% from a year ago and down 22% from the peak count in the Spring of 2022.

On a regional and year-to-date basis, combined single-family and multifamily starts are 10.4% higher in the Northeast, 1.7% lower in the Midwest, 5.0% lower in the South due to hurricane effects, and 4.4% lower in the West.

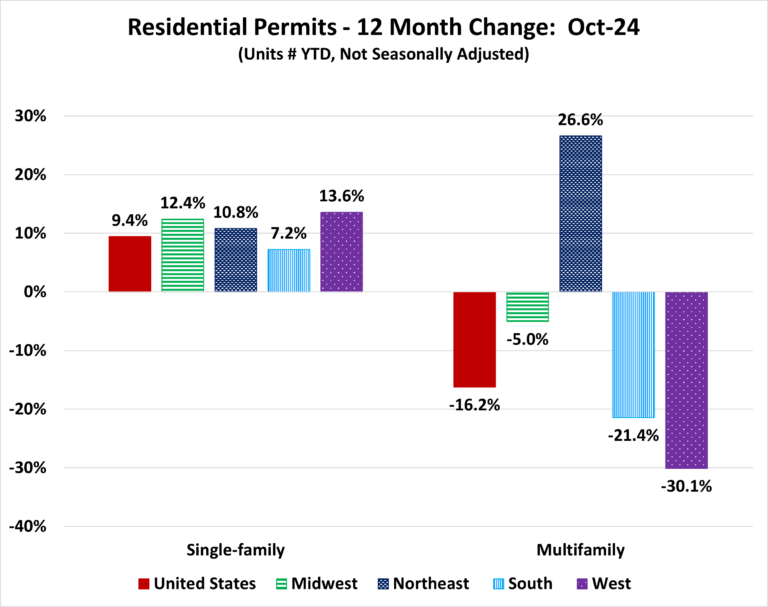
Overall permits decreased 0.6% to a 1.42 million unit annualized rate in October. Single-family permits increased 0.5% to a 968,000 unit rate and are up 9.4% on a year-to-date basis. Multifamily permits decreased 3.0% to an annualized 448,000 pace.

Looking at regional data on a year-to-date basis, permits are 0.9% higher in the Northeast, 3.9% higher in the Midwest, 2.4% lower in the South and 4.8% lower in the West.

Discover more from Eye On Housing

Subscribe to get the latest posts sent to your email.


This article was originally published by a eyeonhousing.org . Read the Original article here. .


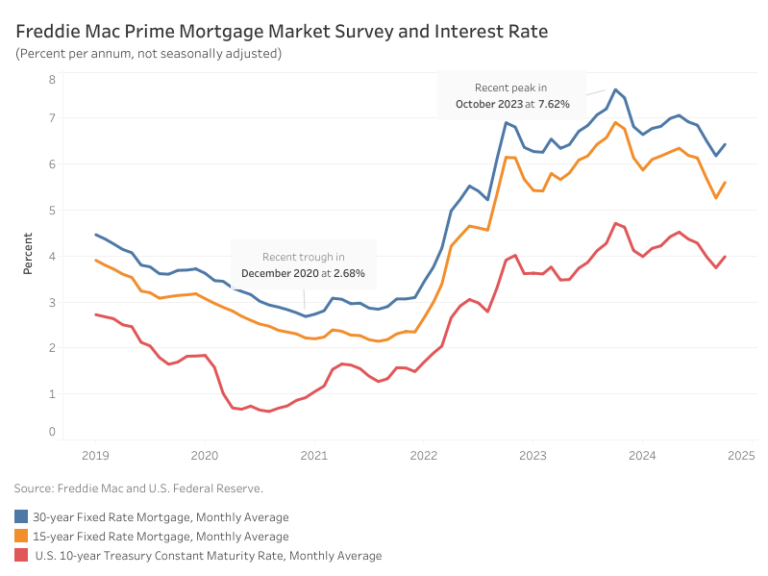
In October, mortgage rates reversed their recent downward trajectory, returning to levels two months earlier. According to Freddie Mac, the average rate for a 30-year fixed-rate mortgage increased 25 basis points (bps) from September to 6.18%. The 15-year fixed-rate mortgage saw an even steeper increase of 34 bps to land at 5.60%.

These increases coincided with heightened volatility in the 10-year Treasury yield, which jumped 38 bps over the month, moving from 3.72% in September to 4.10%. This spike followed a weaker-than-expected labor report driven by the disruptions from two hurricanes, as well as the Boeing strike, and the 2024 election.

However, the largest part of the increase for interest rates is due to growing, post-election concerns over budget deficits. NAHB will be revising its interest rate outlook as the final election results are determined and the fiscal policy position comes into focus. Nonetheless, long-term interest rates have increased since September due to election developments.

Discover more from Eye On Housing

Subscribe to get the latest posts sent to your email.


This article was originally published by a eyeonhousing.org . Read the Original article here. .


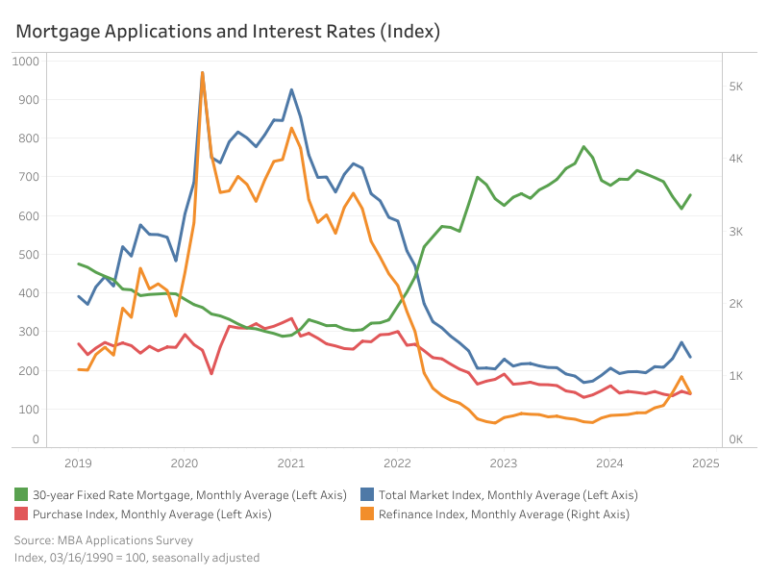
The Market Composite Index, a measure of mortgage loan application volume by the Mortgage Bankers Association’s (MBA) weekly survey, decreased 13.9% month-over-month on a seasonally adjusted (SA) basis due to higher mortgage rates. This decline was reflected in both the Purchase and Refinance Indices, which fell by 4.4% and 23%, respectively. However, compared to October 2023, the Market Composite Index is up by 39%, with the Purchase Index seeing a slight 1.9% increase and the Refinance Index higher by 149.9%.

The average 30-year fixed mortgage rate reversed its downward trajectory with an increase of 36 basis points (bps), following volatility in the ten-year Treasury yield. This brought the rate back to around the same level as it was in August at 6.53%. However, compared to its peak last October, the current rate is 125 bps lower.

The average loan size for the total market (including purchases and refinances) was $390,225 on a non-seasonally adjusted (NSA) basis, a decrease of 2.6% from September. Purchase loans grew by 2.1% to an average of $448,675, while refinance loans declined by 11.3% to $323,750. Adjustable-rate mortgages (ARMs) saw a modest decrease of 3.4% in average loan size from $1.19 million to $1.15 million.

Discover more from Eye On Housing

Subscribe to get the latest posts sent to your email.


This article was originally published by a eyeonhousing.org . Read the Original article here. .


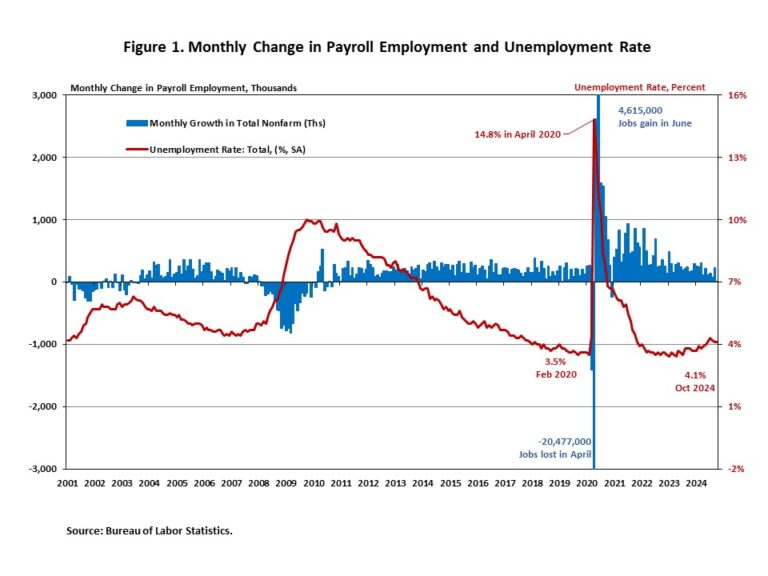
Job growth decelerated significantly in October, driven by the effects of strikes and hurricanes. As stated in this month’s job report, October data are “the first collected since Hurricanes Helene and Milton struck the United States”. Despite lower monthly job gains, the unemployment rate held steady at 4.1%, indicating the labor market remains solid.

In October, wage growth remained unchanged. Wages grew at a 4.0% year-over-year (YOY) growth rate, down 0.3 percentage points from a year ago. Wage growth is outpacing inflation, which typically occurs as productivity increases.

National Employment

According to the Employment Situation Summary reported by the Bureau of Labor Statistics (BLS), total nonfarm payroll employment rose by 12,000 in October, down sharply from a downwardly revised increase of 223,000 jobs in September, marking the smallest monthly job gain in years. The estimates for the previous two months were revised lower. The monthly change in total nonfarm payroll employment for August was revised down by 81,000, from +159,000 to +78,000, while the change for September was revised down by 31,000 from +254,000 to +223,000. Combined, the revisions were 112,000 lower than previously reported.

In the first ten months of 2024, 1,701,000 jobs were created. Additionally, monthly employment growth averaged 170,000 per month, compared to the 251,000 monthly average gain for 2023. The Fed’s easing cycle began on September 18, marking the end of a period of restrictive monetary policy. The U.S. economy has created about 8 million jobs since March 2022, when the Fed enacted the first interest rate hike of this cycle.

The unemployment rate was unchanged at 4.1% in October. While the number of employed persons decreased by 368,000, the number of unemployed persons rose by 150,000.

Meanwhile, the labor force participation rate—the proportion of the population either looking for a job or already holding a job—decreased by one percentage point to 62.6%. However, for people aged between 25 and 54, the participation rate declined for the third straight month to 83.5%. This rate still exceeds the pre-pandemic level of 83.1%. Meanwhile, the overall labor force participation rate remains below its pre-pandemic levels of 63.3% at the beginning of 2020.

In October, employment continued to trend up in health care (+52,000) and government (+40,000). Temporary help for business and professional services lost 49,000 jobs. Manufacturing employment fell by 46,000 in October. The BLS noted that a decline of 44,000 in transportation equipment manufacturing was “largely due to strike activity.”

Construction Employment

Employment in the overall construction sector increased by 8,000 in October, after 27,000 gains in September. While residential construction shed 5,300 jobs, non-residential construction employment added 13,500 jobs for the month.

Residential construction employment now stands at 3.4 million in October, broken down as 957,000 builders and 2.4 million residential specialty trade contractors. The 6-month moving average of job gains for residential construction was 3,000 a month. Over the last 12 months, home builders and remodelers added 44,500 jobs on a net basis. Since the low point following the Great Recession, residential construction has gained 1,388,200 positions.

In October, the unemployment rate for construction workers rose to 5.3% on a seasonally adjusted basis. The unemployment rate for construction workers has remained at a relatively lower level, after reaching 15.3% in April 2020 due to the housing demand impact of the COVID-19 pandemic.

Discover more from Eye On Housing

Subscribe to get the latest posts sent to your email.


This article was originally published by a eyeonhousing.org . Read the Original article here. .

Pin It