Tag

November

Browsing


Over the first eleven months of 2024, the total number of single-family permits issued year-to-date (YTD) nationwide reached 912,910. On a year-over-year (YoY) basis, this is an increase of 8.2% over the November 2023 level of 843,654.

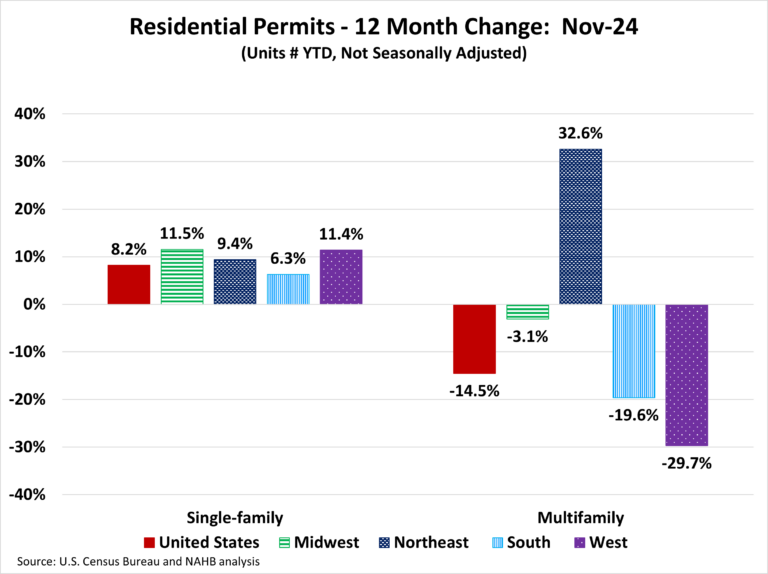
Year-to-date ending in November, single-family permits were up in all four regions. The range of permit increases spanned 11.5% in the Midwest to 6.3% in the South. The West was up by 11.4% and the Northeast was up by 9.4% in single-family permits during this time. For multifamily permits, three out of the four regions posted declines. The Northeast, driven by New York City’s MSA, was the only region to post an increase and was up by 32.6%. Meanwhile, the West posted a decline of 29.7%, the South declined by 19.6%, and the Midwest declined by 3.1%.

Between November 2024 YTD and November 2023 YTD, 44 states posted an increase in single-family permits. The range of increases spanned 31.4% in Montana to 2.6% in Missouri. The remining six states and the District of Columbia reported declines in single-family permits. The ten states issuing the highest number of single-family permits combined accounted for 62.9% of the total single-family permits issued. Texas, the state with the highest number of single-family permits, issued 146,843 permits over the first eleven months of 2024, which is an increase of 8.8% compared to the same period last year. The second highest state, Florida, was down by 0.3%, while the third highest, North Carolina, posted an increase of 7.0%.

Year-to-date ending in November, the total number of multifamily permits issued nationwide reached 445,357. This is 14.5% below the November 2023 level of 520,919.

Between November 2024 YTD and November 2023 YTD, 21 states recorded growth in multifamily permits, while 29 states and the District of Columbia recorded a decline. New York (+113.8%) led the way with a sharp rise in multifamily permits from 14,544 to 31,098, while Idaho had the biggest decline of 54.3% from 5,469 to 2,497. The ten states issuing the highest number of multifamily permits combined accounted for 62.3% of the multifamily permits issued. Over the first eleven months of 2024, Texas, the state with the highest number of multifamily permits issued, experienced a decline of 21.3%. Following closely, the second-highest state in multifamily permits, Florida, saw a decline of 25.0%. California, the third largest multifamily issuing state, decreased by 32.0%.

At the local level, below are the top ten metro areas that issued the highest number of single-family permits.

For multifamily permits, below are the top ten local areas that issued the highest number of permits.

Discover more from Eye On Housing

Subscribe to get the latest posts sent to your email.


This article was originally published by a eyeonhousing.org . Read the Original article here. .

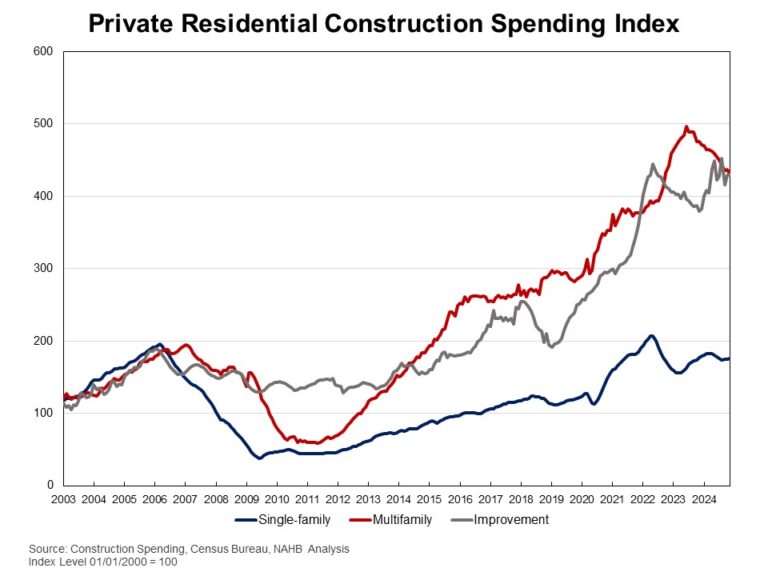
Private residential construction spending edged up by 0.1% in November 2024, according to the latest U.S. Census Construction Spending data. Year-over-year, the November report showed a 3.1% increase.

The monthly increase in total private construction spending was primarily driven by higher spending on single-family construction and residential improvements. Single-family construction spending inched up by 0.3% for the month. This marks a continuation of growth after a five-month decline from April to August, aligning with steady builder confidence seen in the Housing Market Index. However, single-family construction remained 0.7% lower than a year ago. Improvement spending rose by 0.4% in November and was 13.4% higher compared to the same period last year. In contrast, multifamily construction spending declined by 1.3% in November, following a 0.3% increase in October. Compared to a year ago, multifamily construction spending was still 9.5% lower.

The NAHB construction spending index is shown in the graph below. The index illustrates how   spending on single-family construction has slowed since early 2024 under the pressure of elevated interest rates. Multifamily construction spending growth has also slowed down after the peak in July 2023. Meanwhile, improvement spending has increased its pace since late 2023.

Spending on private nonresidential construction was up 1.7% over a year ago. The annual private nonresidential spending increase was mainly due to higher spending for the class of manufacturing ($23.4 billion), followed by the power category ($6.1 billion).

Discover more from Eye On Housing

Subscribe to get the latest posts sent to your email.


This article was originally published by a eyeonhousing.org . Read the Original article here. .

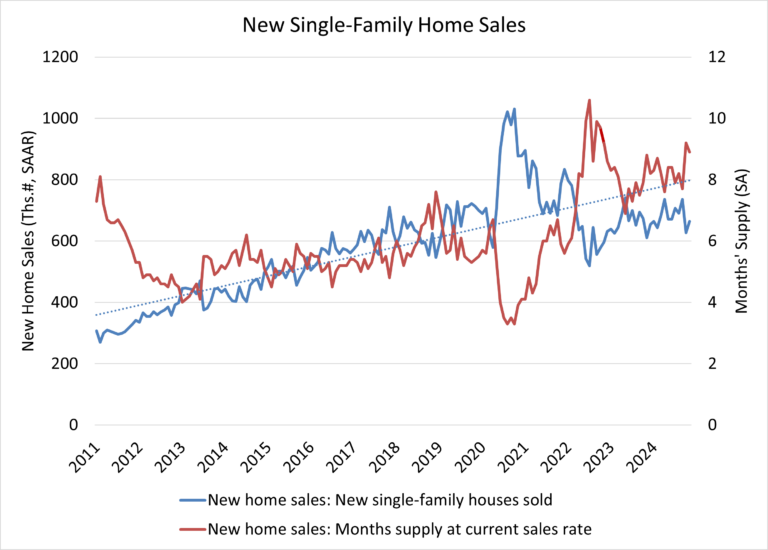
In November 2024, the U.S. housing market experienced a significant boost, with sales of new single-family homes reaching a seasonally adjusted annual rate of 664,000, according to newly released data from the U.S. Department of Housing and Urban Development and the U.S. Census Bureau. This marks a 5.9% increase from October’s revised figures and an 8.7% rise compared to November 2023. November new home sales are up 2.4% on a year-to-date basis.

A new home sale occurs when a sales contract is signed, or a deposit is accepted. The home can be in any stage of construction: not yet started, under construction or completed. In addition to adjusting for seasonal effects, the November reading of 664,000 units is the number of homes that would sell if this pace continued for the next 12 months.

New single-family home inventory in November remained elevated at a level of 490,000, up 8.9% compared to a year earlier. This represents an 8.9 months’ supply at the current building pace. A measure near a six months’ supply is considered balanced.

While an 8.9 months’ supply may be considered elevated in normal market conditions, there is currently only a 3.8 months’ supply of existing single-family homes on the market. Combined, new and existing total months’ supply remains below historic norms at approximately 4.5 months, although this measure is expected to increase as more home sellers test the market in the months ahead.

A year ago, there were 79,000 completed, ready-to-occupy homes available for sale (not seasonally adjusted). By the end of November 2024, that number increased 57% to 124,000. However, completed, ready-to-occupy inventory remains just 25% of total inventory, while homes under construction account for 54% of the inventory. The remaining 21% of new homes sold in November were homes that had not started construction when the sales contract was signed.

The median new home sale price in November edged down 5.4% to $402,600 and is down 6.3% from a year ago. In terms of affordability, the share of entry-level homes priced below $300,000 has been steadily falling in recent years. Only 25% of the homes were priced in this entry-level affordable range, while 31% of the homes were priced above $500,000. Most of the homes were priced between $300,000-$500,000.

Regionally, on a year-over-year basis, new home sales are up 13.6% in the South and 10.0% in the Midwest. New home sales are down 1.4% in the West and 11.5% in the Northeast.

Discover more from Eye On Housing

Subscribe to get the latest posts sent to your email.


This article was originally published by a eyeonhousing.org . Read the Original article here. .

Nonfarm payroll employment increased in 38 states and the District of Columbia in November compared to the previous month, while it decreased in 12 states. According to the Bureau of Labor Statistics, nationwide total nonfarm payroll employment increased by 227,000 in November, following a meager gain of 32,000 jobs in October.

On a month-over-month basis, employment data was most favorable in Florida, which added 61,500 jobs, rebounding from the hurricanes that hit the sunshine state in October. Washington came in second (+30,900), followed by North Carolina (+15,000). A total of 20,300 jobs were lost across 12 states, with Colorado reporting the steepest job losses at 3,900. In percentage terms, employment increased the highest in Washington at 0.9%, while Vermont saw the biggest decline at 0.3% between October and November.

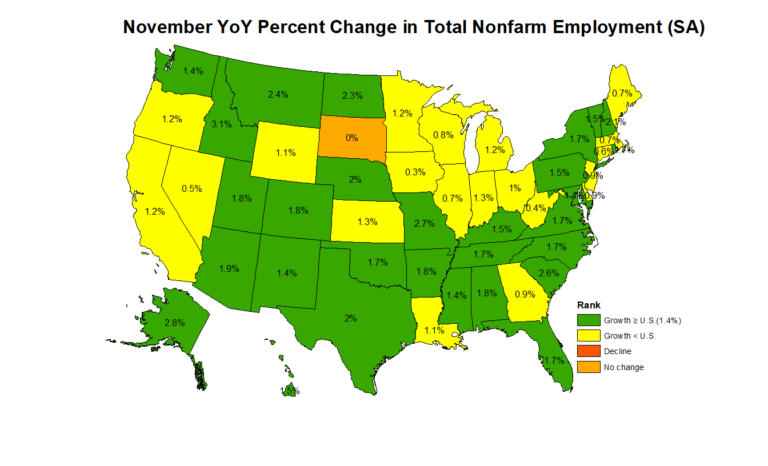
Year-over-year ending in November, 2.3 million jobs have been added to the labor market across 49 states and the District of Columbia. This is a 1.4% increase compared to November 2023 level. South Dakota reported no change. The range of job gains spanned from 2,900 jobs in West Virginia to 274,300 jobs in Texas. In percentage terms, the range of job growth spanned 3.1% in Idaho to 0.3% in Iowa.

Across the nation, construction sector jobs data —which includes both residential and non-residential construction—showed that 23 states and the District of Columbia reported an increase in November compared to October, while 23 states lost construction sector jobs. The four remaining states reported no change on a month-over-month basis. Florida, with the highest increase, added 7,600 construction jobs, while Indiana, on the other end of the spectrum, lost 3,400 jobs. Overall, the construction industry added a net 10,000 jobs in November compared to the previous month. In percentage terms, Minnesota reported the highest increase at 2.1% and Indiana reported the largest decline at 2.0%.

Year-over-year, construction sector jobs in the U.S. increased by 211,000, which is a 2.6% increase compared to the November 2023 level. Texas added 32,200 jobs, which was the largest gain of any state, while California lost 11,500 construction sector jobs. In percentage terms, Alaska had the highest annual growth rate in the construction sector at 20.3%. Over this period, Maryland reported the largest decline of 2.3%.

Discover more from Eye On Housing

Subscribe to get the latest posts sent to your email.


This article was originally published by a eyeonhousing.org . Read the Original article here. .

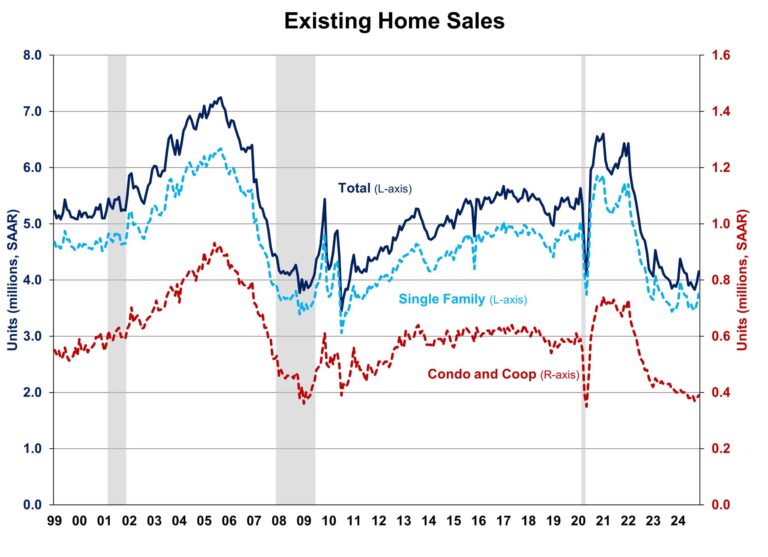
Despite higher mortgage rates and elevated home prices, existing home sales jumped to an 8-month high in November, marking the second month of annual increase in more than three years, according to the National Association of Realtors (NAR).

While inventory improves and the Fed continues lowering rates, the market faces headwinds as mortgage rates are expected to stay above 6% for longer due to an anticipated slower easing pace in 2025. The prolonged rates may continue to discourage homeowners from trading existing mortgages for new ones with higher rates, keeping supply tight and prices elevated. However, as mortgage rates continue trending lower, the gradual improvement in inventory should help slow home price growth and enhance affordability. As such, the recent gains for existing home sales may give way in the coming months of data.

Total existing home sales, including single-family homes, townhomes, condominiums, and co-ops, rose 4.8% to a seasonally adjusted annual rate of 4.15 million in November, the highest level since March 2024. On a year-over-year basis, sales were 6.1% higher than a year ago, the largest annual gain since June 2021.

The first-time buyer share rose to 30% in November, up from 27% in October but down from 31% in November 2023.

The existing home inventory level fell from 1.37 million in October to 1.33 million units in November but is up 17.7% from a year ago. At the current sales rate, November unsold inventory sits at a 3.8-months supply, down from 4.2-months last month but up 3.5-months a year ago. This inventory level remains low compared to balanced market conditions (4.5 to 6 months’ supply) and illustrates the long-run need for more home construction.

Homes stayed on the market for an average of 32 days in November, up from 29 days in October and 25 days in November 2023.

The November all-cash sales share was 25% of transactions, down from 27% experienced in both October 2024 and November 2023. All-cash buyers are less affected by changes in interest rates.

The November median sales price of all existing homes was $406,100, up 4.7% from last year. This marked the 17th consecutive month of year-over-year increases. The median condominium/co-op price in November was up 2.8% from a year ago at $359,800. This rate of price growth will slow as inventory increases.

Geographically, three of four regions saw an increase in existing home sales in November, ranging from 5.3% in the Midwest to 8.5% in the Northeast. Sales in the West stayed unchanged in November. On a year-over-year basis, sales grew in all four regions, ranging from 3.3% in the South to 14.9% in the West.

The Pending Home Sales Index (PHSI) is a forward-looking indicator based on signed contracts. The PHSI rose from 75.9 to 77.4 in October due to improved inventory. On a year-over-year basis, pending sales were 5.4% higher than a year ago per National Association of Realtors data.

Discover more from Eye On Housing

Subscribe to get the latest posts sent to your email.


This article was originally published by a eyeonhousing.org . Read the Original article here. .

The Market Composite Index, a measure of mortgage loan application volume by the Mortgage Bankers Association’s (MBA) weekly survey, decreased 14.5%, month-over-month, in November on a seasonally adjusted (SA) basis. The slowdown in mortgage activity can be attributed to higher mortgage rates as the ten-year Treasury yield increased in November, reflecting uncertainties surrounding the elections.

The market decline was reflected primarily in the Refinance Index (SA), which decreased by 33.2% month-over-month. Meanwhile, the Purchase Index (SA) showed a modest increase of 2.7% over the same period. However, compared to October 2023, the Market Composite Index is up by 16.4%, with the Purchase Index seeing a slight 4.8% increase and the Refinance Index higher by 45.9%.

The average contract rate for 30-year fixed mortgage rate per the MBA survey for November averaged at 6.8%, 29 basis points (bps) higher month-over-month in response to a higher ten-year Treasury rate.

Loan size metrics also reflected market adjustments. The average loan size for the total market (including purchases and refinances) shrank 2.9% month-over-month on a non-seasonally adjusted (NSA) basis, decreasing from $389,800 to $378,400. Loan sizes for purchasing and refinancing decreased. Purchase loans averaged $436,200, down 2.7% from $448,300, while refinance loans saw a sharper 9.9% decrease, with the average loan size falling from $322,500 to $290,600. Adjustable-rate mortgages (ARMs) also declined 6.0%, from $1.15 million to $1.08 million.

Discover more from Eye On Housing

Subscribe to get the latest posts sent to your email.


This article was originally published by a eyeonhousing.org . Read the Original article here. .


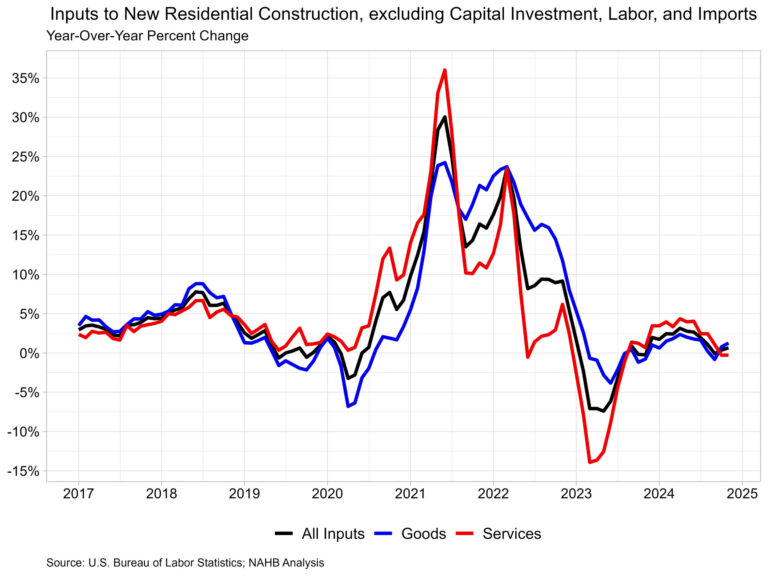
Prices for inputs to new residential construction—excluding capital investment, labor, and imports—were unchanged in November according to the most recent Producer Price Index (PPI) report published by the U.S. Bureau of Labor Statistics. Compared to a year ago, this index was up 0.7% in November after rising 0.3% in October.

The inputs to the new residential construction price index can be broken into two components­—one for goods and another for services. The goods component increased 1.2% over the year, while services decreased 0.3%. For comparison, the total final demand index increased 3.0% over the year in November, with final demand with respect to goods up 1.1% and final demand for services up 3.9% over the year.

Goods

The goods component has a larger importance to the total residential construction inputs price index, representing around 60%. The price of input goods to new residential construction was unchanged in November from October. The input goods to residential construction index can be further broken down into two separate components, one measuring energy inputs with the other measuring goods less energy inputs. The latter of these two components simply represents building materials used in residential construction, which makes up around 93% of the goods index.

Prices for inputs to residential construction, goods less energy, were up 2.3% in November compared to a year ago. This year-over-year increase was larger than in October (2.0%) and was the largest year-over-year increase since June earlier this year. The growth rate in November 2023 was 1.2%. The index for inputs to residential construction for energy fell 10.9% year-over-year in November, the fourth straight yearly decline in input energy prices.  

The graph below focuses on the data since the start of 2023 for residential goods inputs. Energy prices have continued to fall over the past year, with only two periods of growth in 2024.

At the individual commodity level, excluding energy, the five commodities with the highest importance for building materials to the new residential construction index were as follows: ready-mix concrete, general millwork, paving mixtures/ blocks, sheet metal products, and wood office furniture/store fixtures. Across these commodities, there was price growth across the board compared to last year. Ready-mix concrete was up 3.9%, wood office furniture/store fixtures up 3.4%, general millwork up 2.8%, paving mixtures/blocks up 1.6% and sheet metal products up 0.5%. Unsurprisingly, given how energy prices have trended this year, the input commodity that had the largest fall in price over the year was No. 2 diesel, which was down 20.6%.

Among lumber and wood products, the commodities with the highest importance to new residential construction were general millwork, prefabricated structural members, softwood veneer/plywood, softwood lumber (not edge worked) and hardwood veneer/plywood. The input commodity in residential construction that had the highest year-over-year percent change (across all input goods) in November was softwood lumber (not edge worked), which was 13.7% higher than November 2023. This is of particular note because none of the other top wood commodities had a year-over-year change above 3% in November. Lumber supplies have been driving prices higher over the past month as the sawmill industry continues to adjust to the mill closures that occurred earlier this year. Higher lumber demand as residential construction rebounds due to lower interest rates is likely to continue to increase lumber prices.

Services

Prices of inputs to residential construction for services, were unchanged in November from October. The price index for service inputs to residential construction can be broken out into three separate components: a trade services component, a transportation and warehousing services component, and a services excluding trade, transportation and warehousing component. The most significant component is trade services (around 60%), followed by services less trade, transportation and warehousing (around 29%), and finally transportation and warehousing services (around 11%). The largest component, trade services, compared to last year was down 1.2% in November after declining 1.5% in October.

Discover more from Eye On Housing

Subscribe to get the latest posts sent to your email.


This article was originally published by a eyeonhousing.org . Read the Original article here. .

Mortgage rates climbed in November, driven by market volatility and a surge in Treasury yields following the recent elections. On the day after the election results, the 10-year Treasury yield spiked by 14 basis points (bps), setting the stage for further rate increases throughout the month.

According to Freddie Mac, the average rate for a 30-year fixed-rate mortgage increased 38 basis points from October, reaching 6.81%. Meanwhile, the 15-year fixed-rate mortgage saw an even steeper increase of 43 bps to land at 6.03%.

The 10-year Treasury yield, a key benchmark for mortgage rates, averaged 4.37% in November—38 bps higher than October’s average. This increase reflected heightened market uncertainty and persistent volatility. Looking ahead, the Federal Reserve is set to meet on December 17-18 to evaluate the possibility of another rate cut. Since the federal funds rate influences interest rates, a rate cut could potentially ease long-term mortgage rates, but this decision will hinge on the latest employment and inflation data, and other macroeconomic factors that could have an upward pressure on inflation including larger government deficits and higher tariffs. NAHB forecasts additional declines to the federal funds rate into a range below 4%.

Discover more from Eye On Housing

Subscribe to get the latest posts sent to your email.


This article was originally published by a eyeonhousing.org . Read the Original article here. .


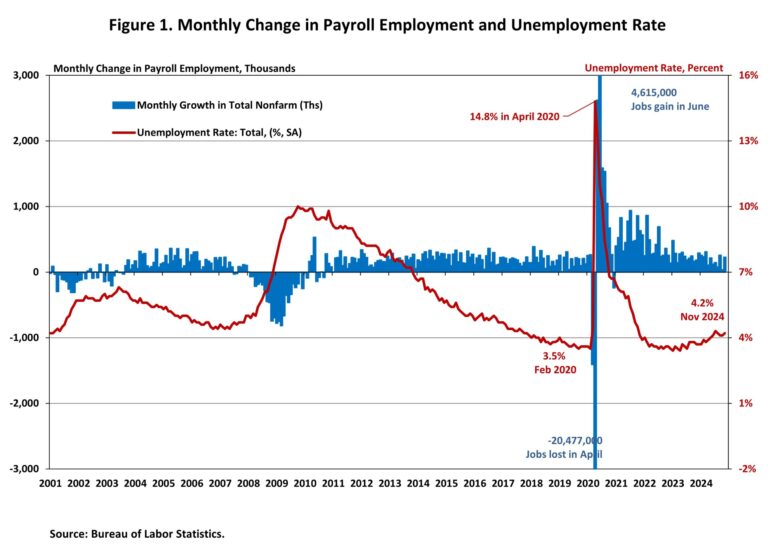
Employment rebounded sharply in November after strike- and hurricane-related disruptions in October. The unemployment rate rose one percentage point to 4.2% after holding at 4.1% for two months in a row.

In November, wage growth remained unchanged from the previous month. Wages grew at a 4.0% year-over-year (YOY) growth rate, down 0.2 percentage points from a year ago. Wage growth is outpacing inflation, which typically occurs as productivity increases.

National Employment

According to the Employment Situation Summary reported by the Bureau of Labor Statistics (BLS), total nonfarm payroll employment rose by 227,000 in November, a sharp rebound from an upwardly revised increase of 36,000 jobs in October. Since January 2021, the U.S. job market has added jobs for 47 consecutive months, making it the third-longest period of employment expansion on record.

The estimates for the previous two months were revised higher. The monthly change in total nonfarm payroll employment for September was revised up by 32,000, from +223,000 to +255,000, while the change for October was revised up by 24,000 from +12,000 to +36,000. Combined, the revisions were 56,000 higher than previously reported.

In the first eleven months of 2024, 1,984,000 jobs were created. Additionally, monthly employment growth averaged 180,000 per month, compared to the 251,000 monthly average gain for 2023. The U.S. economy has created more than 8 million jobs since March 2022, when the Fed enacted the first interest rate hike of this cycle.

The unemployment rate ticked up to 4.2% in November, marking the seventh month that the unemployment rate has been at or above 4.0%. While the number of employed persons decreased by 355,000, the number of unemployed persons rose by 161,000.

Meanwhile, the labor force participation rate—the proportion of the population either looking for a job or already holding a job—decreased by one percentage point to 62.5%. However, for people aged between 25 and 54, the participation rate remained at 83.5% for the second straight month. While the overall labor force participation rate remains below its pre-pandemic levels of 63.3% at the beginning of 2020, the rate for people aged between 25 and 54 exceeds the pre-pandemic level of 83.1%.

In November, employment continued to trend up in health care (+54,000), leisure and hospitality (+53,000), government (+33,000), and social assistance (+19,000). Employment in transportation equipment manufacturing increased in November as workers who were on strike returned to work. Meanwhile, retail trade lost 28,000 jobs.

Construction Employment

Employment in the overall construction sector increased by 10,000 in November, after 2,000 gains in October. While residential construction gained 3,100 jobs, non-residential construction employment added 6,800 jobs for the month.

Residential construction employment now stands at 3.4 million in November, broken down as 958,000 builders and 2.4 million residential specialty trade contractors. The 6-month moving average of job gains for residential construction was 2,983 a month. Over the last 12 months, home builders and remodelers added 52,400 jobs on a net basis. Since the low point following the Great Recession, residential construction has gained 1,391,400 positions.

In November, the unemployment rate for construction workers remained at 5.3% on a seasonally adjusted basis. The unemployment rate for construction workers has remained at a relatively lower level, after reaching 15.3% in April 2020 due to the housing demand impact of the COVID-19 pandemic.

Discover more from Eye On Housing

Subscribe to get the latest posts sent to your email.


This article was originally published by a eyeonhousing.org . Read the Original article here. .
Pin It