Tag

multifamily

Browsing


According to NAHB analysis of quarterly Census data, the count of multifamily, for-rent housing starts declined significantly during the second quarter of 2024. For the quarter, 88,000 multifamily residences started construction. Of this total, 83,000 were built-for-rent. This marks a notable 37% decline from the second quarter of 2023 for the multifamily built-for-rent category.

The market share of rental units of multifamily construction starts was flat at a still elevated 94% for the second quarter as the small condo market remained held back due to higher interest rates. In contrast, the historical low share of 47% was set during the third quarter of 2005, during the condo building boom. An average share of 80% was registered during the 1980-2002 period.

For the second quarter, there were just 5,000 multifamily condo unit construction starts.

An elevated rental share of multifamily construction is holding typical apartment size below levels seen during the pre-Great Recession period. According to second quarter 2024 data, the average square footage of multifamily construction starts was relatively unchanged at 1,034 square feet. The median declined to 955 square feet. These estimates are near multidecade lows.

Discover more from Eye On Housing

Subscribe to get the latest posts sent to your email.


This article was originally published by a eyeonhousing.org . Read the Original article here. .

High interest rates for construction and development loans as well as ongoing challenges regarding labor shortages and higher prices for many building materials continued to slow the building market this summer.

Overall housing starts decreased 6.8% in July to a seasonally adjusted annual rate of 1.24 million units, according to a report from the U.S. Department of Housing and Urban Development and the U.S. Census Bureau. This is the lowest pace since May 2020.

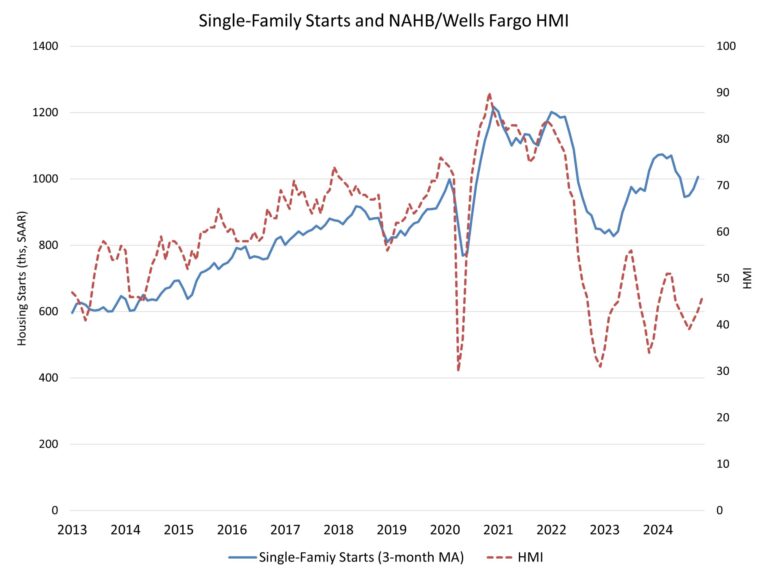
The July reading of 1.24 million starts is the number of housing units builders would begin if development kept this pace for the next 12 months. Within this overall number, single-family starts decreased 14.1% from an upwardly revised June figure to an 851,000 seasonally adjusted annual rate. However, on a year-to-date basis, single-family starts are up 11.4%.

The multifamily sector, which includes apartment buildings and condos, increased 14.5% to an annualized 387,000 pace.

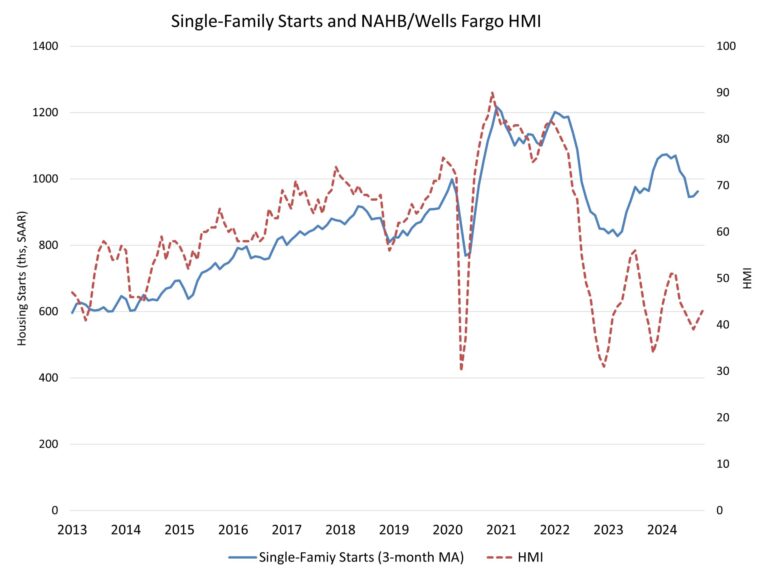
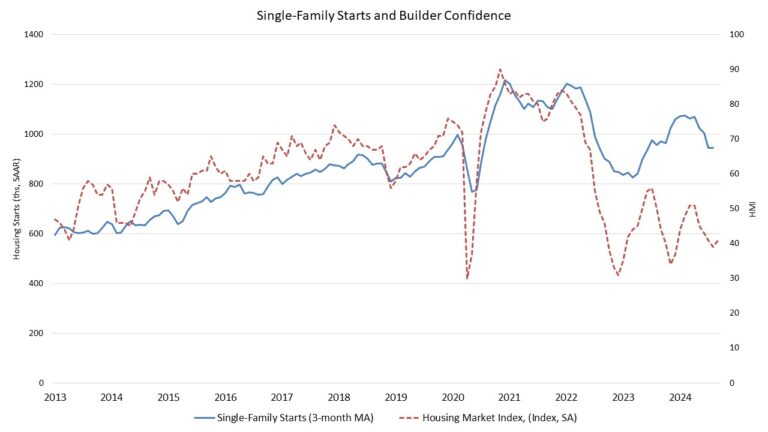
The decline in new home construction mirrors our latest builder surveys (the NAHB/Wells Fargo HMI), which show that buyers remain concerned about challenging affordability conditions and builders are grappling with elevated rates for builder loans, a shortage of workers and lots, and supply chain concerns for some building materials.

Better inflation data points to the Federal Reserve moving to cut interest rates possibly as early as September, and with interest rates expected to moderate in the months ahead, this will help both buyers and builders who are dealing with tight lending conditions.

On a regional and year-to-date basis, combined single-family and multifamily starts are 1.3% lower in the Northeast, 5.1% lower in the Midwest, 5.4% lower in the South and 5.1% lower in the West.

Overall permits decreased 4.0% to a 1.40 million unit annualized rate in July. Single-family permits decreased 0.1% to a 938,000 unit rate. Multifamily permits decreased 11.1% to an annualized 458,000 pace.

Looking at regional data on a year-to-date basis, permits are 1.1% higher in the Northeast, 3.2% higher in the Midwest, 0.3% lower in the South and 4.1% lower in the West.

Single-family homes under construction fell back to a count of 653,000—down 4.1% compared to a year ago. The number of multifamily units under construction fell to an 886,000 count—down 13.2% compared to a year ago. The number of multifamily units under construction is now the lowest since July 2022.

Discover more from Eye On Housing

Subscribe to get the latest posts sent to your email.


This article was originally published by a eyeonhousing.org . Read the Original article here. .
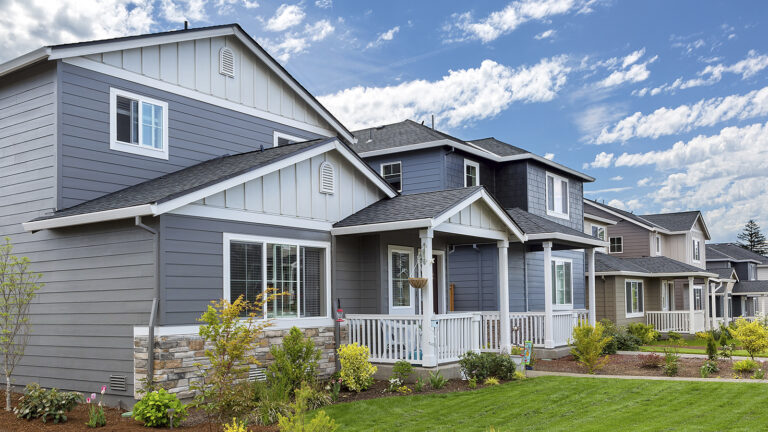

Confidence in the market for new multifamily housing declined year-over-year in the second quarter of 2024, according to results from the Multifamily Market Survey (MMS) released today by the National Association of Home Builders (NAHB).  The MMS produces two separate indices:  The Multifamily Production Index (MPI) had a reading of 44, a decrease of 12 points year-over-year, while the Multifamily Occupancy Index (MOI) had a reading of 81, falling eight points year-over-year.

Multifamily developers are less optimistic than they were at this time last year, given high interest rates and limited financing availability to develop multifamily properties.  However, financial markets may become more stable later in the year, as recent weak economic data make it more likely that the Federal Reserve will cut interest rates.

Multifamily Production Index (MPI)

The MPI is a weighted average of four key market segments: three in the built-for-rent market (garden/low-rise, mid/high-rise, and subsidized) and the built-for-sale (or condominium) market.  The survey asks multifamily builders to rate the current conditions as “good”, “fair”, or “poor” for multifamily starts in markets where they are active.  The index and all its components are scaled so that a number above 50 indicates that more respondents report conditions as good rather than poor.

Even though all four of the components posted year-over-year declines in the second quarter, sentiment about production of garden/low-rise apartments and subsidized apartments remained in positive territory above 50. The component measuring garden/low-rise fell 11 points to 53, the component measuring subsidized units decreased four points to 51, the component measuring built-for-sale units posted a seven-point decline to 38, and the component measuring mid/high-rise units dropped 18 points to 29 (Figure 1).

Multifamily Occupancy Index (MOI)

The MOI is a weighted average of the three built-for-rent market segments (garden/low-rise, mid/high-rise and subsidized).  The survey asks multifamily builders to rate the current conditions for occupancy of existing rental apartments, in markets where they are active, as “good”, “fair”, or “poor”.  Similar in nature to MPI, the index and all its components are scaled so that a number above 50 indicates more respondents report that occupancy is good than report it as poor. 

Although still well above 50, all three components for the MOI experienced year-over-year declines.  The component measuring garden/low-rise fell nine points to 82, mid/high-rise units decreased seven points to 76, and subsidized units decreased six points to 85 (Figure 2).

The MMS was re-designed last year to produce results that are easier to interpret and consistent with the proven format of other NAHB industry sentiment surveys.  Until there is enough data to seasonally adjust the series, changes in the MMS indices should only be evaluated on a year-over-year basis.

Please visit NAHB’s MMS web page for the full report.

Discover more from Eye On Housing

Subscribe to get the latest posts sent to your email.


This article was originally published by a eyeonhousing.org . Read the Original article here. .

Pin It