Tag

Mortgage

Browsing


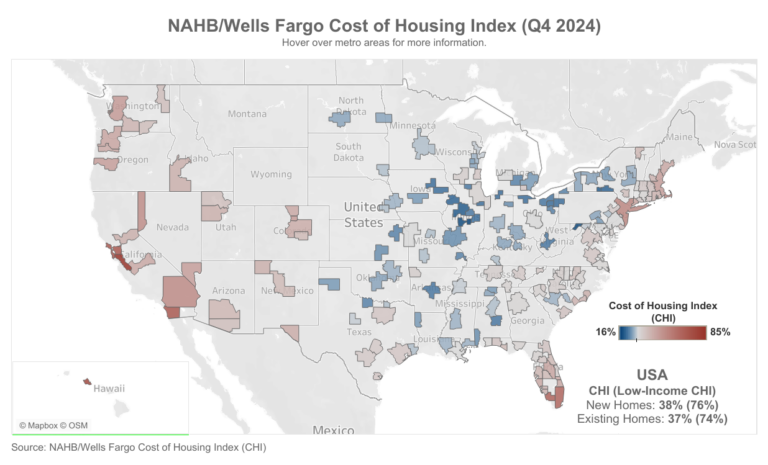
In a clear sign illustrating the housing affordability challenges facing Americans, the National Association of Home Builders (NAHB)/Wells Fargo Cost of Housing Index (CHI) found that in the fourth quarter of 2024, a family earning the nation’s median income of $97,800 needed 38% of its income to cover the mortgage payment on a median-priced new home. Low-income families, defined as those earning only 50% of the median income, would have to spend 76% of their earnings to pay for the same new home.

The figures track closely for the purchase of existing homes in the U.S. as well. A typical family would have to pay 37% of their income for a median-priced existing home, while a low-income family would need to pay 74% of their earnings to make the same mortgage payment.

There was no change in the percentage of a family’s income needed to purchase a new home (38%) between the third and fourth quarters of 2024. However, the cost burden did increase slightly for low-income families, rising from 75% to 76% of their income.

Meanwhile, the cost burden of existing homes edged lower for both median- and low-income families between the third and fourth quarter. The CHI indices were 37% and 74%, respectively, in the fourth quarter, down from 38% and 75% in the third quarter. The slight uptick in affordability was due to median existing home prices falling 2% from the third quarter to the fourth quarter of 2024.

CHI is also available for 176 metropolitan areas, calculating the percentage of a family’s income needed to make the mortgage payment on an existing home based on the local median home price and median income in those markets.

In 10 out of 176 markets in the fourth quarter, the typical family is severely cost-burdened (must pay more than 50% of their income on a median-priced existing home). In 85 other markets, such families are cost-burdened (need to pay between 31% and 50%). There are 81 markets where the CHI is 30% of earnings or lower.

The Top 5 Severely Cost-Burdened Markets

San Jose-Sunnyvale-Santa Clara, Calif., was the most severely cost-burdened market on the CHI, where 87% of a typical family’s income is needed to make a mortgage payment on an existing home. This was followed by:

Urban Honolulu, Hawaii (74%)

San Diego-Chula Vista-Carlsbad, Calif. (69%)

San Francisco-Oakland-Berkeley, Calif. (69%)

Naples-Marco Island, Fla. (65%)

Low-income families would have to pay between 129% and 174% of their income in all five of the above markets to cover a mortgage.

The Top 5 Least Cost-Burdened Markets

By contrast, Decatur, Ill., was the least cost-burdened market in the CHI, where typical families needed to spend just 16% of their income to pay for a mortgage on an existing home. Rounding out the least burdened markets are:

Cumberland, Md.-W.Va (17%)

Springfield, Ill. (17%)

Elmira, N.Y. (19%)

Peoria, Ill. (19%)

Low-income families in these markets would have to pay between 31% and 39% of their income to cover the mortgage payment for a median-priced existing home.

Visit nahb.org/chi for tables and details.

Discover more from Eye On Housing

Subscribe to get the latest posts sent to your email.


This article was originally published by a eyeonhousing.org . Read the Original article here. .


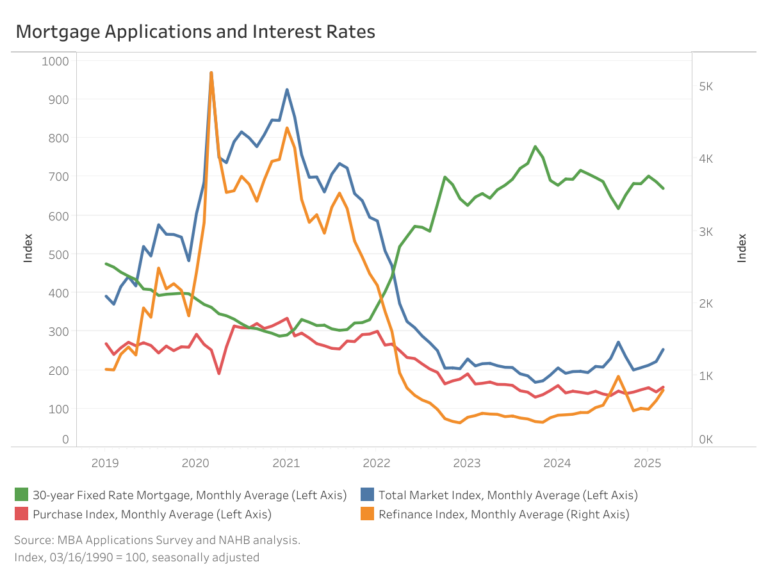
The Market Composite Index, a measure of mortgage loan application volume from the Mortgage Bankers Association’s (MBA) weekly survey, increased by 3.1% month-over-month on a seasonally adjusted (SA) basis, primarily driven by purchasing activity. Compared to January last year, the index is higher by 3.4%. The Market Composite Index which includes the Purchase and Refinance Indices: purchasing experienced a monthly gain of 3.8%, while refinancing decreased 2.3% (SA). On a year-over-year basis, however, the Purchase Index is lower by 3.4%, while the Refinance Index remains higher at 18.6%.

The average 30-year fixed rate mortgage reported in the MBA survey for January ticked up 20 basis points (bps) to 7.02% (index level 702). This rate is 24 basis points higher than the same period last year.

Average loan size (purchases and refinances combined) increased slightly by 0.8% on a non-seasonally adjusted (NSA) basis from December to $373,200. For purchase loans, the average size increased by 1.8% to $429,400, while refinance loans experienced a 5.4% decrease, reaching an average of $288,200. Adjustable-rate mortgages (ARMs) saw a continued decline in average loan size for three consecutive months, down 0.6% from $1.074 million to $1.068 million.

Discover more from Eye On Housing

Subscribe to get the latest posts sent to your email.


This article was originally published by a eyeonhousing.org . Read the Original article here. .


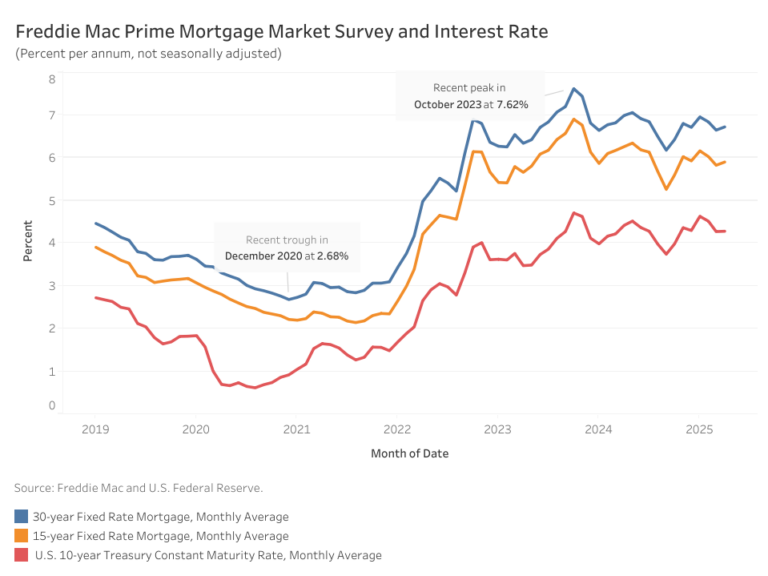
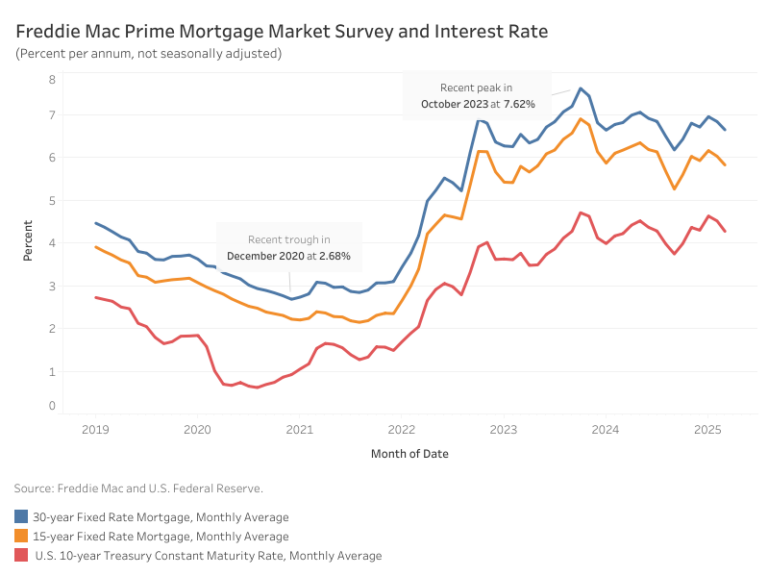
Mortgage rates edged higher in January, with the average 30-year fixed-rate mortgage reaching 6.96%. Rates had been climbing steadily since mid-December—even surpassing 7%—before easing in recent weeks as the bond market stabilized following news that President Donald Trump postponed tariffs plans to February 1.

According to Freddie Mac, the average rate for a 30-year fixed-rate mortgage rose 24 basis points (bps) from December, extending a two-year trend of fluctuations between 6% and 7%. Meanwhile, the 15-year fixed-rate mortgage increased 23 bps to land at 6.13%.

The 10-year Treasury yield, a key benchmark for mortgage rates, averaged 4.63% in November—33 basis points higher than December’s average. A strong economy, coupled with ongoing uncertainty over inflation due to tax cuts and tariffs, continues to put upward pressure on yields. This uncertainty is also reflected in the increased range for the projected 2025 core PCE inflation in the December FOMC economic projections, now estimated between 2.1% and 3.2%, compared to a narrower 2.1% to 2.5% range in September.

Discover more from Eye On Housing

Subscribe to get the latest posts sent to your email.


This article was originally published by a eyeonhousing.org . Read the Original article here. .


The Market Composite Index, a measure of mortgage loan application volume from the Mortgage Bankers Association’s (MBA) weekly survey, increase marginally by 2.9% month-over-month on a seasonally adjusted (SA) basis. Compared to December 2023, the index is higher by 10.2%. The Market Composite Index includes the Purchase and Refinance Indices, which saw monthly gains of 4.1% and 6.7% (SA), respectively. On a year-over-year basis, the Purchase Index showed a modest increase of 1.1%, while the Refinance Index is 31.7% higher.

The average 30-year fixed rate mortgage reported in the MBA survey for December remained relatively stable at 6.82% (index level 682), reflecting a minor decline of 0.4 basis points. This rate is 9 basis points lower than the same period last year.

Average loan sizes, excluding refinance loans, saw slight declines in December. On a non-seasonally adjusted (NSA) basis, the average loan size (purchases and refinances combined) fell by 2.1% from November to $370,300. For purchase loans, the average size decreased by 3.3% to $421,800, while refinance loans experienced a 4.8% increase, reaching an average of $304,500. Adjustable-rate mortgages (ARMs) also saw a marginal decline in loan size, down 0.8% from $1.08 million to $1.07 million.

Discover more from Eye On Housing

Subscribe to get the latest posts sent to your email.


This article was originally published by a eyeonhousing.org . Read the Original article here. .


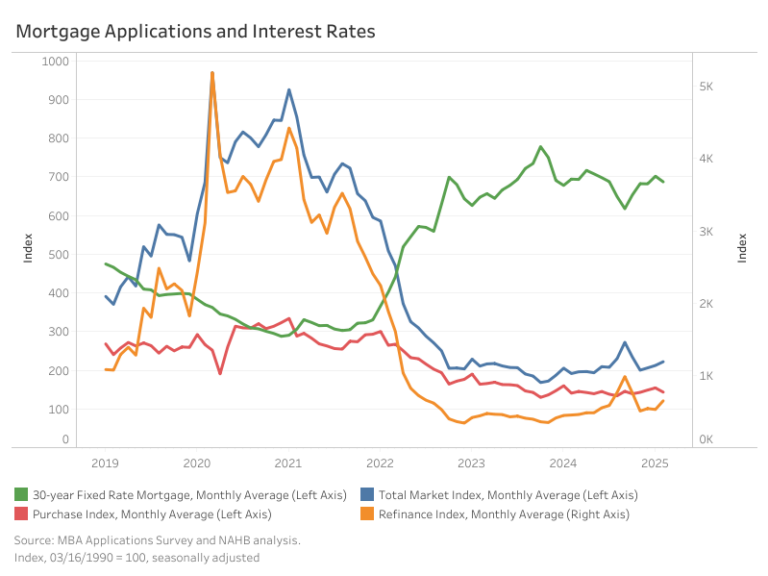
The Market Composite Index, a measure of mortgage loan application volume by the Mortgage Bankers Association’s (MBA) weekly survey, decreased 14.5%, month-over-month, in November on a seasonally adjusted (SA) basis. The slowdown in mortgage activity can be attributed to higher mortgage rates as the ten-year Treasury yield increased in November, reflecting uncertainties surrounding the elections.

The market decline was reflected primarily in the Refinance Index (SA), which decreased by 33.2% month-over-month. Meanwhile, the Purchase Index (SA) showed a modest increase of 2.7% over the same period. However, compared to October 2023, the Market Composite Index is up by 16.4%, with the Purchase Index seeing a slight 4.8% increase and the Refinance Index higher by 45.9%.

The average contract rate for 30-year fixed mortgage rate per the MBA survey for November averaged at 6.8%, 29 basis points (bps) higher month-over-month in response to a higher ten-year Treasury rate.

Loan size metrics also reflected market adjustments. The average loan size for the total market (including purchases and refinances) shrank 2.9% month-over-month on a non-seasonally adjusted (NSA) basis, decreasing from $389,800 to $378,400. Loan sizes for purchasing and refinancing decreased. Purchase loans averaged $436,200, down 2.7% from $448,300, while refinance loans saw a sharper 9.9% decrease, with the average loan size falling from $322,500 to $290,600. Adjustable-rate mortgages (ARMs) also declined 6.0%, from $1.15 million to $1.08 million.

Discover more from Eye On Housing

Subscribe to get the latest posts sent to your email.


This article was originally published by a eyeonhousing.org . Read the Original article here. .


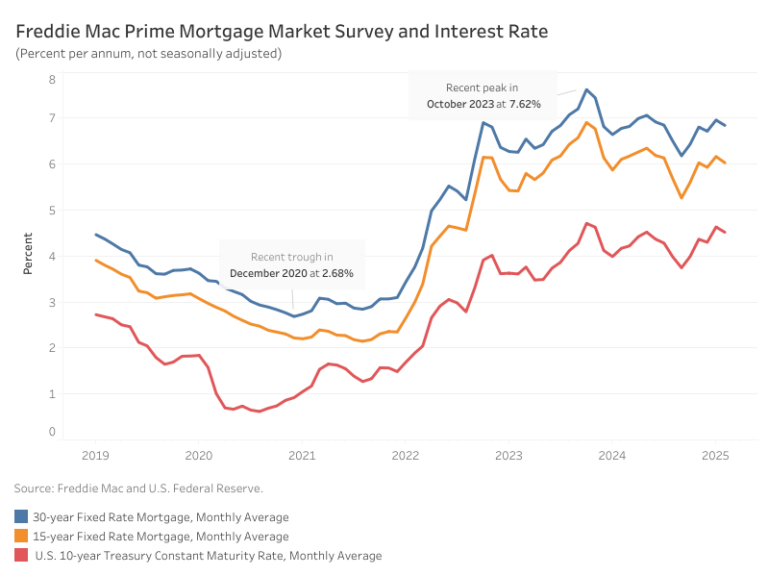
Mortgage rates climbed in November, driven by market volatility and a surge in Treasury yields following the recent elections. On the day after the election results, the 10-year Treasury yield spiked by 14 basis points (bps), setting the stage for further rate increases throughout the month.

According to Freddie Mac, the average rate for a 30-year fixed-rate mortgage increased 38 basis points from October, reaching 6.81%. Meanwhile, the 15-year fixed-rate mortgage saw an even steeper increase of 43 bps to land at 6.03%.

The 10-year Treasury yield, a key benchmark for mortgage rates, averaged 4.37% in November—38 bps higher than October’s average. This increase reflected heightened market uncertainty and persistent volatility. Looking ahead, the Federal Reserve is set to meet on December 17-18 to evaluate the possibility of another rate cut. Since the federal funds rate influences interest rates, a rate cut could potentially ease long-term mortgage rates, but this decision will hinge on the latest employment and inflation data, and other macroeconomic factors that could have an upward pressure on inflation including larger government deficits and higher tariffs. NAHB forecasts additional declines to the federal funds rate into a range below 4%.

Discover more from Eye On Housing

Subscribe to get the latest posts sent to your email.


This article was originally published by a eyeonhousing.org . Read the Original article here. .


Housing starts edged lower last month as average monthly mortgage rates increased a quarter-point from 6.18% to 6.43% between September and October, according to Freddie Mac.

Overall housing starts decreased 3.1% in October to a seasonally adjusted annual rate of 1.31 million units, according to a report from the U.S. Department of Housing and Urban Development and the U.S. Census Bureau.

The October reading of 1.31 million starts is the number of housing units builders would begin if development kept this pace for the next 12 months. Within this overall number, single-family starts decreased 6.9% to a 970,000 seasonally adjusted annual rate. On a year-to-date basis, single-family construction is up 9.3%. The volatile multifamily sector, which includes apartment buildings and condos, increased 9.6% to an annualized 341,000 pace but are down 29.3% on a year-to-date basis.

Although housing starts declined in October, builder sentiment improved for a third straight month in November as builders anticipate an improved regulatory environment in 2025 that will allow the industry to increase housing supply. Further interest rate cuts from the Federal Reserve through 2025 should result in lower interest rates for construction and development loans, helping to lead to a stabilization for apartment construction and expansion for single-family home building.

While multifamily starts increased in October, the number of apartments under construction is down to 821,000, the lowest count since March 2022 and down 18.9% from a year ago. In October, there were 1.8 apartments that completed construction for every one apartment that started construction. The three-month moving average reached a ratio of 2 in October.

There were 644,000 single-family homes under construction in October, down 3.6% from a year ago and down 22% from the peak count in the Spring of 2022.

On a regional and year-to-date basis, combined single-family and multifamily starts are 10.4% higher in the Northeast, 1.7% lower in the Midwest, 5.0% lower in the South due to hurricane effects, and 4.4% lower in the West.

Overall permits decreased 0.6% to a 1.42 million unit annualized rate in October. Single-family permits increased 0.5% to a 968,000 unit rate and are up 9.4% on a year-to-date basis. Multifamily permits decreased 3.0% to an annualized 448,000 pace.

Looking at regional data on a year-to-date basis, permits are 0.9% higher in the Northeast, 3.9% higher in the Midwest, 2.4% lower in the South and 4.8% lower in the West.

Discover more from Eye On Housing

Subscribe to get the latest posts sent to your email.


This article was originally published by a eyeonhousing.org . Read the Original article here. .


In October, mortgage rates reversed their recent downward trajectory, returning to levels two months earlier. According to Freddie Mac, the average rate for a 30-year fixed-rate mortgage increased 25 basis points (bps) from September to 6.18%. The 15-year fixed-rate mortgage saw an even steeper increase of 34 bps to land at 5.60%.

These increases coincided with heightened volatility in the 10-year Treasury yield, which jumped 38 bps over the month, moving from 3.72% in September to 4.10%. This spike followed a weaker-than-expected labor report driven by the disruptions from two hurricanes, as well as the Boeing strike, and the 2024 election.

However, the largest part of the increase for interest rates is due to growing, post-election concerns over budget deficits. NAHB will be revising its interest rate outlook as the final election results are determined and the fiscal policy position comes into focus. Nonetheless, long-term interest rates have increased since September due to election developments.

Discover more from Eye On Housing

Subscribe to get the latest posts sent to your email.


This article was originally published by a eyeonhousing.org . Read the Original article here. .


The Market Composite Index, a measure of mortgage loan application volume by the Mortgage Bankers Association’s (MBA) weekly survey, decreased 13.9% month-over-month on a seasonally adjusted (SA) basis due to higher mortgage rates. This decline was reflected in both the Purchase and Refinance Indices, which fell by 4.4% and 23%, respectively. However, compared to October 2023, the Market Composite Index is up by 39%, with the Purchase Index seeing a slight 1.9% increase and the Refinance Index higher by 149.9%.

The average 30-year fixed mortgage rate reversed its downward trajectory with an increase of 36 basis points (bps), following volatility in the ten-year Treasury yield. This brought the rate back to around the same level as it was in August at 6.53%. However, compared to its peak last October, the current rate is 125 bps lower.

The average loan size for the total market (including purchases and refinances) was $390,225 on a non-seasonally adjusted (NSA) basis, a decrease of 2.6% from September. Purchase loans grew by 2.1% to an average of $448,675, while refinance loans declined by 11.3% to $323,750. Adjustable-rate mortgages (ARMs) saw a modest decrease of 3.4% in average loan size from $1.19 million to $1.15 million.

Discover more from Eye On Housing

Subscribe to get the latest posts sent to your email.


This article was originally published by a eyeonhousing.org . Read the Original article here. .


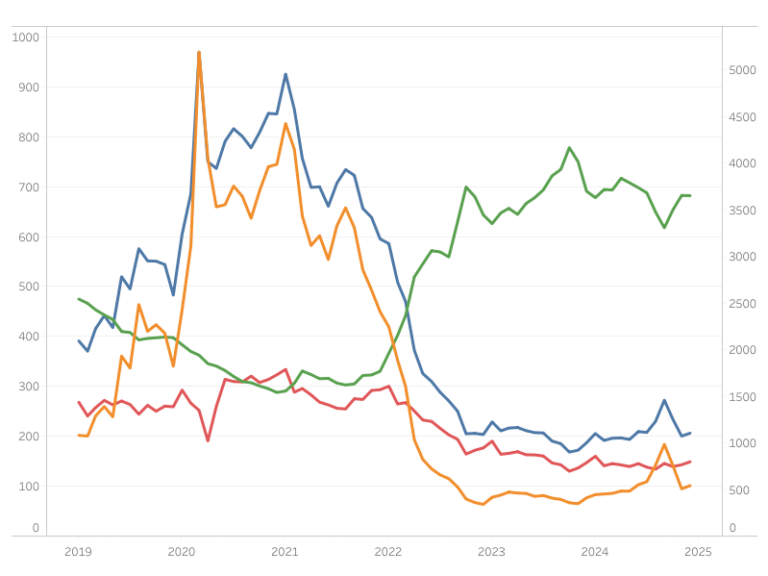
In September, mortgage rates maintained their downward trajectory, returning to levels last seen two years ago. According to Freddie Mac, the average rate for a 30-year fixed-rate mortgage fell to 6.18%, a decline of 32 basis points (bps) from August. The 15-year fixed-rate mortgage saw an even steeper decline, decreasing by 42 bps from August to 5.26%. Additionally, the 10-year Treasury rate declined by 23 bps, falling from 3.98% in August to 3.75%.

According to the NAHB forecast, the 30-year mortgage rate is expected to near 6% on a sustained basis by the end of 2024, with a further decline to just below 6% during 2025. NAHB also predicts furthering easing by the Federal Reserve before the end of 2024.

Discover more from Eye On Housing

Subscribe to get the latest posts sent to your email.


This article was originally published by a eyeonhousing.org . Read the Original article here. .

Pin It