Tag

Market

Browsing


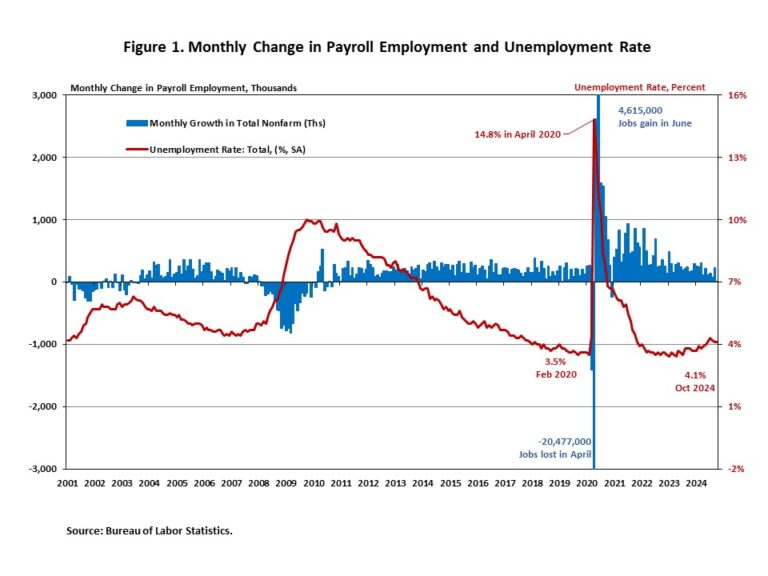
Job growth decelerated significantly in October, driven by the effects of strikes and hurricanes. As stated in this month’s job report, October data are “the first collected since Hurricanes Helene and Milton struck the United States”. Despite lower monthly job gains, the unemployment rate held steady at 4.1%, indicating the labor market remains solid.

In October, wage growth remained unchanged. Wages grew at a 4.0% year-over-year (YOY) growth rate, down 0.3 percentage points from a year ago. Wage growth is outpacing inflation, which typically occurs as productivity increases.

National Employment

According to the Employment Situation Summary reported by the Bureau of Labor Statistics (BLS), total nonfarm payroll employment rose by 12,000 in October, down sharply from a downwardly revised increase of 223,000 jobs in September, marking the smallest monthly job gain in years. The estimates for the previous two months were revised lower. The monthly change in total nonfarm payroll employment for August was revised down by 81,000, from +159,000 to +78,000, while the change for September was revised down by 31,000 from +254,000 to +223,000. Combined, the revisions were 112,000 lower than previously reported.

In the first ten months of 2024, 1,701,000 jobs were created. Additionally, monthly employment growth averaged 170,000 per month, compared to the 251,000 monthly average gain for 2023. The Fed’s easing cycle began on September 18, marking the end of a period of restrictive monetary policy. The U.S. economy has created about 8 million jobs since March 2022, when the Fed enacted the first interest rate hike of this cycle.

The unemployment rate was unchanged at 4.1% in October. While the number of employed persons decreased by 368,000, the number of unemployed persons rose by 150,000.

Meanwhile, the labor force participation rate—the proportion of the population either looking for a job or already holding a job—decreased by one percentage point to 62.6%. However, for people aged between 25 and 54, the participation rate declined for the third straight month to 83.5%. This rate still exceeds the pre-pandemic level of 83.1%. Meanwhile, the overall labor force participation rate remains below its pre-pandemic levels of 63.3% at the beginning of 2020.

In October, employment continued to trend up in health care (+52,000) and government (+40,000). Temporary help for business and professional services lost 49,000 jobs. Manufacturing employment fell by 46,000 in October. The BLS noted that a decline of 44,000 in transportation equipment manufacturing was “largely due to strike activity.”

Construction Employment

Employment in the overall construction sector increased by 8,000 in October, after 27,000 gains in September. While residential construction shed 5,300 jobs, non-residential construction employment added 13,500 jobs for the month.

Residential construction employment now stands at 3.4 million in October, broken down as 957,000 builders and 2.4 million residential specialty trade contractors. The 6-month moving average of job gains for residential construction was 3,000 a month. Over the last 12 months, home builders and remodelers added 44,500 jobs on a net basis. Since the low point following the Great Recession, residential construction has gained 1,388,200 positions.

In October, the unemployment rate for construction workers rose to 5.3% on a seasonally adjusted basis. The unemployment rate for construction workers has remained at a relatively lower level, after reaching 15.3% in April 2020 due to the housing demand impact of the COVID-19 pandemic.

Discover more from Eye On Housing

Subscribe to get the latest posts sent to your email.


This article was originally published by a eyeonhousing.org . Read the Original article here. .


The NAHB/Westlake Royal Remodeling Market Index (RMI) for the third quarter of 2024 posted a reading of 63, down two points compared to the previous quarter.

Remodelers remain optimistic about the market even though the overall RMI edged down for the third consecutive quarter. Some have potential customers citing the upcoming election as a reason for putting large projects on hold. Remodelers also continue to face various headwinds such as difficulty finding skilled construction labor and higher interest rates. Nevertheless, the overall RMI reading of 63 is consistent with NAHB’s forecast for steady 2% growth in remodeling spending over the next two years.

The RMI is based on a survey that asks remodelers to rate various aspects of the residential remodeling market “good”, “fair” or “poor.”  Responses from each question are converted to an index that lies on a scale from 0 to 100. An index number above 50 indicates a higher proportion of respondents view conditions as good rather than poor.

Current Conditions

The Remodeling Market Index (RMI) is an average of two major component indices: the Current Conditions Index and the Future Indicators Index. 

The Current Conditions Index is an average of three subcomponents: the current market for large remodeling projects ($50,000 or more), moderately sized projects ($20,000 to $49,999), and small projects (under $20,000). In the third quarter of 2024, the Current Conditions Index averaged 72, declining one point from the previous quarter.  All three components remained well above 50 in positive territory: the component measuring small-sized remodeling projects (under $20,000) rose two points to 77, while both the component measuring moderate remodeling projects (at least $20,000 but less than $50,000) and the component measuring large remodeling projects ($50,000 or more) fell three points to 71 and 67, respectively.

Future Indicators

The Future Indicators Index is an average of two subcomponents: the current rate at which leads and inquiries are coming in and the current backlog of remodeling projects. 

In the third quarter of 2024, the Future Indicators Index was 55, down three points from the previous quarter.  Quarter-over-quarter, the component measuring the backlog of remodeling jobs fell three points to 57 and the component measuring the current rate at which leads and inquiries are coming in dropped two points to 53.

For the full set of RMI tables, including regional indices and a complete history for each RMI component, please visit NAHB’s RMI web page.

Discover more from Eye On Housing

Subscribe to get the latest posts sent to your email.


This article was originally published by a eyeonhousing.org . Read the Original article here. .


The September jobs report indicates that the U.S. labor market remains strong. Job growth accelerated, and the unemployment rate fell to a three-month low of 4.1%.  Meanwhile, job growth for the previous two months (July and August) was upwardly revised.

In September, wage growth accelerated for the second straight month. Wages grew at a 4.0% year-over-year (YOY) growth rate in September, down 0.5 percentage points from a year ago. Wage growth is outpacing inflation, which typically occurs as productivity increases.

National Employment

Total nonfarm payroll employment increased by 254,000 in September, following an upwardly revised increase of 159,000 jobs in August, as reported in the Employment Situation Summary. It marks the largest monthly job gain in the past six months. The estimates for the previous two months were revised higher. The monthly change in total nonfarm payroll employment for July was revised up by 55,000, from +89,000 to +144,000, while the change for August was revised up by 17,000 from +142,000 to +159,000. Combined, the revisions were 72,000 higher than previously reported.

In the first nine months of 2024, 1,801,000 jobs were created. Additionally, monthly employment growth averaged 200,000 per month, compared with the 251,000 monthly average gain for 2023. The Fed’s easing cycle began on September 18, marking the end of a period of restrictive monetary policy. The U.S. economy has created roughly 8 million jobs since March 2022, when the Fed enacted the first interest rate hike of this cycle.

The unemployment rate fell slightly to 4.1% in September, from 4.2% in August. The September decrease in the unemployment rate reflected the decrease in the number of persons unemployed (-281,000) and the increase in the number of persons employed (+430,000).

Meanwhile, the labor force participation rate—the proportion of the population either looking for a job or already holding a job—was 62.7% for the third consecutive month. However, for people aged between 25 and 54, the participation rate dipped slightly to 83.8%. This rate exceeds the pre-pandemic level of 83.1%. Meanwhile, the overall labor force participation rate is still below its pre-pandemic levels when it stood at 63.3% at the beginning of 2020.

In September, employment continued to trend up in food services and drinking places (+69,000), health care (+45,000), government (+31,000), social assistance (+27,000), and construction (+25,000).

Construction Employment

Job gains in the overall construction sector continued in September, averaging 20,000 per month over the past 12 months. While residential construction gained 7,800 jobs, non-residential construction employment added 17,900 jobs for the month.

Residential construction employment now stands at 3.4 million in September, broken down as 952,000 builders and 2.4 million residential specialty trade contractors. The 6-month moving average of job gains for residential construction was 3,450 a month. Over the last 12 months, home builders and remodelers added 60,500 jobs on a net basis. Since the low point following the Great Recession, residential construction has gained 1,393,800 positions.

In September, the unemployment rate for construction workers rose to 4.9% on a seasonally adjusted basis. The unemployment rate for construction workers has remained at a relatively lower level, after reaching 15.3% in April 2020 due to the housing demand impact of the COVID-19 pandemic.

Discover more from Eye On Housing

Subscribe to get the latest posts sent to your email.


This article was originally published by a eyeonhousing.org . Read the Original article here. .


Consumer confidence fell to a 3-month low in September due to growing concerns about the job market, despite the labor market remaining healthy. Recent job growth revisions showed fewer jobs were added in 2023 than initially reported. However, the unemployment rate remained at a relatively low level and wage growth continued to outpace inflation. This suggests the labor market is cooling from its red-hot pace but remains steady. 

The Consumer Confidence Index, reported by the Conference Board, is a survey measuring how optimistic or pessimistic consumers feel about their financial situation. This index fell from 105.6 to 98.7 in September, the largest monthly decline since August 2021. The Consumer Confidence Index consists of two components: how consumers feel about their present situation and about their expected situation. The Present Situation Index decreased 10.3 points from 134.6 to 124.3, and the Expectation Situation Index fell 4.6 points from 86.3 to 81.7, but still remained above the 80 threshold. Historically, an Expectation Index reading below 80 often signals a recession within a year.

Consumers’ assessment of current business conditions turned negative in September. The share of respondents rating business conditions “good” decreased by 2.3 percentage points to 18.8%, while those claiming business conditions as “bad” rose by 2.9 percentage points to 20.2%. Consumers’ assessments of the labor market worsened as well. The share of respondents reporting that jobs were “plentiful” decreased by 1.8 percentage points to 30.9%, while those who saw jobs as “hard to get” increased by 1.5 percentage points to 18.3%.

Consumers were also less optimistic about the short-term outlook. The share of respondents expecting business conditions to improve fell from 19.1% to 18.5%, while those expecting business conditions to deteriorate rose from 14.5% to 16.6%. Similarly, expectations of employment over the next six months were less positive. The share of respondents expecting “more jobs” increased by 0.1 percentage points to 16.4%, and those anticipating “fewer jobs” climbed by 1.3 percentage points to 18.3%.

The Conference Board also reported the share of respondents planning to buy a home within six months. The share of respondents planning to buy a home rose to 5.7% in September. Of those, respondents planning to buy a newly constructed home increased slightly to 0.7%, while those planning to buy an existing home decreased to 2.4%.

Discover more from Eye On Housing

Subscribe to get the latest posts sent to your email.


This article was originally published by a eyeonhousing.org . Read the Original article here. .


The total market share of non-site built single-family homes (modular and panelized) was just 3% of single-family homes in 2023, according to completion data from the Census Bureau Survey of Construction data and NAHB analysis. This is a slight increase from the 2% share in 2022. This share has been steadily declining since the early-2000s despite the high-level of interest for non-site built construction. This low market share in fact runs counter to some media commentary on off-site construction suggesting recent gains. Nonetheless, there exists potential for market share gains in the years ahead due to the need to increase productivity in the residential construction sector.

In 2023, there were 27,000 total single-family units built using modular (12,000) and panelized/pre-cut (15,000) construction methods, out of a total of 999,000 single-family homes completed. It is worth noting that the Census definitions of off-site construction are relatively narrow. In a separate survey, the Home Innovation Research Labs Survey of U.S. Home Builders has a higher share for panelized construction (5-12%) due to a wider definition of “panelized” construction.

While the Census-measured market share is small, there exists potential for expansion. This 3% market share for 2023 represents a decline from years prior to the Great Recession. In 1998, 7% of single-family completions were modular (4%) or panelized (3%). This marked the largest share for the 1992-2023 period.

One notable regional concentration is found in the Northeast and Midwest. These two regions tie for the highest market share of homes built using non-site build construction methods. In the Northeast, 5% (4,000 homes) of the region’s 61,000 housing units were completed using non-site built construction methods. At the same time, in the Midwest, 5% market share (6,000 homes) of the region’s 126,000 housing units were completed using non-site build construction methods.

With respect to multifamily construction, approximately 7% of multifamily buildings (properties, not units) were built using modular and panelized methods, marking the highest level in the last two decades. This is significantly higher than the 2% share in 2022 and 1% share in 2018-2021. It is notable that modular construction methods accounted for 5% of this share, whereas in previous years it was only panelized construction methods that made up the small share of non-site build methods in multifamily construction.  Prior to last year, the highest levels of modular and panelized methods share in multifamily construction was in 2000 and 2011, where 5% of multifamily buildings were constructed with modular (1%) or panelized construction methods (4%).

Discover more from Eye On Housing

Subscribe to get the latest posts sent to your email.


This article was originally published by a eyeonhousing.org . Read the Original article here. .


NAHB’s featured topic for the second quarter HBGI reveals that 17.5% of single-family and 8.6% of multifamily construction takes place in second home areas. Recent NAHB analysis found that the total count of second homes across the US was 6.5 million, which accounts for 4.6% of the total housing stock. For this analysis, a second home area is a county that has a second home share greater than 10.3% of the county’s total housing stock (these counties fall within the 75th and above percentile of the second home stock share distribution).  There are 788 counties that are considered a second home area based on this definition.

Single-family

Single-family permit data shows that the market share for construction in second home areas has grown by over four percentage points in the past nine years. The earliest data, which is the fourth quarter of 2015, shows that second home areas had a market share of 13.2%. As of the second quarter of 2024, the market share for this geography increased to 17.5%. However, this latest reading is down from a peak of 18.3% in the first quarter of 2023.  

The peak growth rate in construction for second homes areas was at 38.5% in the third quarter of 2021. The first recorded decline in the growth rate occurred in the third quarter of 2022. This downward growth rate was followed by five quarters of declines until the first quarter of 2024.   Second home areas have averaged a growth rate of 9.1% between the fourth quarter of 2015 and the second quarter of 2024, while non-second home areas averaged single-family a growth rate of 5.1% over the same period.  

Multifamily

Although smaller, the market share for second home areas has also grown for multifamily construction. The market share was 5.5% in the fourth quarter of 2015 and is now 8.6%, a 3.1 percentage point increase. This increase in market share has been more volatile than single-family, as growth in construction has not been as consistent for multifamily in second home areas. 

There have been three periods where construction growth for multifamily experienced declines in these areas, such as in 2017 and early 2021. The third period of decline is ongoing, as there have been two consecutive quarters where the growth rate has been negative to start 2024. The latest growth rate is a11.8% decline. This is down from a peak of 53.1% in the third quarter of 2022, as multifamily construction has slowed nationwide. 

Discover more from Eye On Housing

Subscribe to get the latest posts sent to your email.


This article was originally published by a eyeonhousing.org . Read the Original article here. .

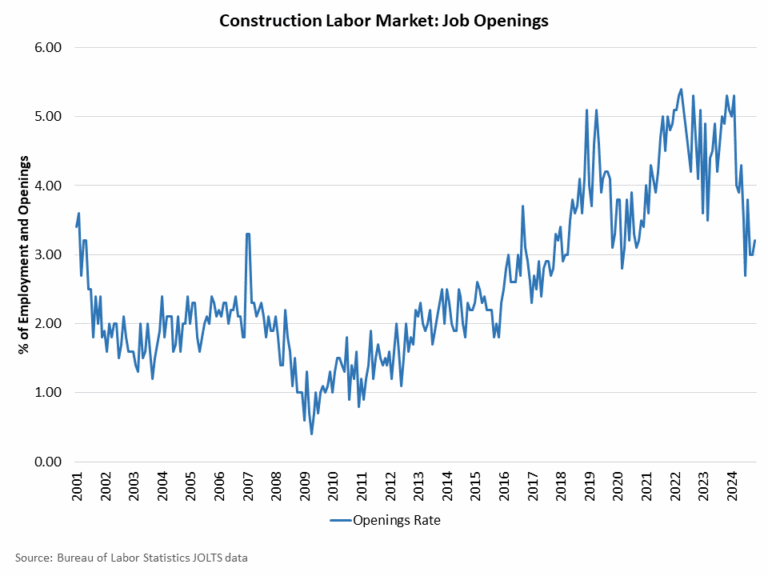
Due to slowing home construction and elevated interest rates, the count of open construction sector jobs continued to decline in July, per the Bureau of Labor Statistics’ Job Openings and Labor Turnover Survey (JOLTS). However, this shift lower is also consistent with a cooler overall labor market, which is a positive sign for future inflation readings and the interest rate outlook.

In July, after revisions, the number of open jobs for the overall economy decreased slightly from 7.91 million to 7.67 million. This is notably smaller than the 8.81 million estimate reported a year ago. Previous NAHB analysis indicated that this number had to fall below 8 million on a sustained basis for the Federal Reserve to feel more comfortable about labor market conditions and their potential impacts on inflation. With estimates now measurably below 8 million, interest rate cuts from the Federal Reserve are at hand (Indeed, the yield curve reversed its inversion for the first time since June 2022 today, although this reversion can also be a bond market signal for some concern for future macro data).

As the Fed eases monetary policy, the demand for new construction will expand. Thus, a reversal for the current soft readings for construction labor will occur in the quarters ahead. This means the underlying skilled labor shortage is likely to persist during the coming years.

In July, the number of open construction sector jobs shifted notably lower from 299,000 in June to 248,000. Elements of the construction sector have slowed as elevated interest rates held, most notably multifamily development. This slowing has somewhat reduced demand for construction workers, lowering the job opening count for the construction industry. The open job count was 351,000 a year ago.

The construction job openings rate fell to 2.9% in July, the lowest rate since March 2020. The job openings rate has trended lower as the number of single-family and multifamily residences under construction has declined. This is a cyclical effect that will likely reverse later in 2025.

The layoff rate in construction increased to 2.1% in July from 1.3% in June as the labor market slows. The quits rate in construction increased to 2.1% in July from 1.6% in June. The rise in the layoff rate is consistent with a slowing construction labor market.

Discover more from Eye On Housing

Subscribe to get the latest posts sent to your email.


This article was originally published by a eyeonhousing.org . Read the Original article here. .

NORTHVILLE, Mich. (FOX 2) – In Michigan alone there are an estimated 66,000 licensed real estate agents, making it an extremely competitive industry.

But there are ways to set yourself apart from the crowd – one agent from Metro Detroit who has really taken his profession to new heights.

Dylan Tent calls himself the heli-realtor – a helicopter pilot who also sells houses. Tent uses his passion to literally and figuratively elevate his sales game.

While his situation is unique, his story provides lessons for anyone looking to set themselves apart.

His videos are outrageous combining daring stunts with unique stories – all to get eyeballs on the properties he represents.

“I did jump a motorcycle pretty far over someone’s house and that’s when people saw, (and said) ‘Wow this video got 30,000 views. I want to hire that guy.'”

And so far, so good.

“An average real estate video might get 500 to 1,000 views, and we have stuff that goes into the hundreds of thousands and millions,” Tent said.

But his path to get there, wasn’t exactly a straight line.

“I quit college after watching a snowboarding movie called ‘The Art of Flight.’ I wanted to be a heli-ski pilot.”

That career choice was short-lived after he says it was more dangerous and less profitable than he thought.

“I started taking pictures of people’s houses from the air and selling them door to door,” he said. “One of the customers said if I got my real estate licenseI could sell his house.

“It was a beautiful lake house. I started adding up in my head, it was a little more profitable to sell real estate and then I could actually purchase and own a helicopter myself.”

Dylan turned 2,000 pictures from above into three real estate sales – and was off from there.

Having a helicopter offers certain advantages including travel for one, which broadens your sales area.

“Lapeer, Metamora, Detroit, Howell,” he said. “I have gone to all of those locations in two hours rather than six or seven hours of driving.”

And it potentially separates you from the competition.

“It really is a resource for video content,” he said. “If I post a video of a house we might get so many thousands of views. If I take off, or land in their front yard or back yard, or lake lot, we’ll get it to go viral almost every time.”

He wouldn’t do it if it didn’t work. but that’s not to say this sales tactic is for everyone.

FOX 2: “You have taken a lot of risks that have seemingly paid off?”

“For example, I had a property that had a gun range and we did some exploding targets that were blowing up stuffed animals on the gun range,” he said. “We were in an area where everyone has guns in that area. Other real estate agents were like, ‘I don’t think we should do that, that is unprofessional.’ I said I’m going to sell that property to a gun owner, I’m probably not going to sell it to someone who doesn’t have that.

“I don’t care if that makes someone angry.”

Tent says the real reason behind his success incorporates passion into his craft, something anyone can do.

“If I was a scratch golfer, I would probably focus on selling houses on golf courses,” he said. “If I was a yoga instructor, I would offer free yoga classes in the park. I have built more relationships through my hobbies than I have, anything else.”

In addition to selling houses, Dylan also offers helicopter tours of the Detroit areas. You can find him and contact him with social media by searching for Dylan Tent, Heli Realitor.

You can find Dylan Tent on social media below:


This article was originally published by a www.fox2detroit.com . Read the Original article here. .


NAHB analyzed the national market share data released by BUILDER Magazine in a previous blog post.  Last month, BUILDER Magazine released new data on the top 10 home builders within each of the 50 largest new home markets in the U.S. (ranked by single-family permits) (Figure 1).  It is important to note that this post is not specifically analyzing the top 10 largest home builders nationally and each market can differ in its respective top 10 home builder composition.

The top 10 home builders accounted for varying shares, ranging from 40.1% of single-family permits in the Kansas City area to 98.8% in Columbia, SC.  In 11 metro areas, the top 10 builders’ market share exceeded 90%. Across the 50 largest metro areas, the average market share of the top 10 builders was 78.2%, up from 73.3% in 2022.

Looking at results on a map reveals that Florida, South Carolina, Virginia, and southern California have multiple highly concentrated markets.  Texas and the Northwest include markets with lower levels of concentration.

D.R. Horton made the top 10 builder list in 47 markets, the most among all builders.  Lennar and PulteGroup followed, present in the top 10 builder list of 45 and 35 different metro markets, respectively.

From 2022 to 2023, 34 metro areas saw an increase with their top 10 builders’ market share while nine metro areas saw decreases.  The top 5 metro areas with the biggest increases were:

Los Angeles-Long Beach-Anaheim, CA (90.3%, +26 percentage points)

Myrtle Beach-Conway-North Myrtle Beach, SC-NC (92.3%, +16.4 percentage points)

Riverside-San Bernadino-Ontario, CA (94.9%, +16.1 percentage points)

Cape Coral-Fort Myers, FL (96.2%, +15.3 percentage points)

New York-Newark-New Jersey City, NY-NJ-PA (62.6%, +14.9 percentage points)

Of the nine metro markets that saw decreases in the single-family permit share controlled by their top 10 builders, the five largest decreases were seen in:

Portland-Vancouver-Hillsboro, OR-WA (66%, -8.7 percentage points)

North Port-Sarasota-Bradenton, FL (79.1%, -7.4 percentage points)

Deltona-Daytona Beach-Ormond Beach, FL (72.4%, -7.2 percentage points)

Seattle-Tacoma-Bellevue, WA (59.4%, -5.5 percentage points)

Salt Lake City, UT (59.3%, -4.3 percentage points)

Discover more from Eye On Housing

Subscribe to get the latest posts sent to your email.


This article was originally published by a eyeonhousing.org . Read the Original article here. .

Sunshine, sandy beaches, and a booming tourism industry have always placed Florida’s housing market in the spotlight. This influx of visitors translates to a constantly evolving real estate market, with opportunities and challenges for potential buyers. Home values continue to rise, though slower than in the recent past. This article explores everything you need to know about Florida’s housing market, from pricing trends to valuable insights for buyers and sellers.

Key Takeaways

Sales Surge: Closed sales of existing single-family homes surged by 5.2% year-over-year in July 2024.
Inventory Growth: Both new listings and inventory rose significantly in July 2024 compared to the previous year.
Median Prices: The median sales price for single-family homes saw a slight increase of 0.5%, while condo prices dropped by 1.3%.
Market Variation: Market behaviors vary by region within Florida, indicating diverse conditions.
Interest Rates Impact: Lower mortgage rates are boosting homebuyer demand, enhancing purchasing power.

How is the Florida Housing Market Doing Currently?
Home Sales

In July 2024, Florida’s housing market reported a total of 23,353 closed sales of existing single-family homes, representing a 5.2% increase from the same month last year. Conversely, condo-townhouse sales experienced a slight decline of 1.2%, totaling 8,364 units sold. This differentiator highlights changing preferences among buyers, with single-family homes gaining popularity amidst evolving market conditions.

According to the data from Florida Realtors®, these closed sales serve as a crucial indicator of market health. While sales for single-family homes have risen, the slight fall in condo sales indicates that different segments are behaving variably and buyers are perhaps gravitating towards larger properties that offer more living space.

Home Prices

Analyzing the median sales prices reveals crucial insights into affordability and market dynamics. The statewide median price for single-family existing homes reached $416,990, essentially unchanged with a 0.5% increase from July 2023. Meanwhile, the median price for condo-townhouse units was reported at $315,000—a 1.3% decline year-over-year.

Dr. Brad O’Connor, Chief Economist for Florida Realtors®, emphasized that these price shifts reflect a stabilization that could mitigate affordability challenges. The slight rise in single-family home prices, coupled with the decrease in condo prices, may indicate a normalization of the market as more inventory becomes available.

Housing Supply

The housing supply in Florida is undergoing a transformation, predominantly marked by increased inventory levels. In July 2024, new listings of single-family homes rose by 10.7% compared to the previous year. The condo and townhouse market saw a even steeper increase of 13.8% for new listings.

As reported by Florida Realtors®, single-family homes currently represent a 4.6-month supply, while the supply for condo-townhouse properties sits at 7.4 months. This developing supply landscape indicates a potential shift towards a buyer’s market, easing some of the price pressures that have dominated recent years.

Market Trends

Market trends in Florida are increasingly reflecting a more balanced approach, influenced heavily by rising inventory and changing sales dynamics. There is a marked difference in how various regions within Florida are faring. Urban centers, such as Miami and Orlando, might display robust demand due to economic drivers, while less-populated areas may see moderate activity.

The data suggests that buyers are beginning to have more options, which ultimately leads to more informed purchasing decisions. Lower mortgage rates are also contributing positively, granting buyers greater purchasing power and encouraging first-time homebuyers to enter the market.

According to Florida Realtors® President Gia Arvin, these trends showcase a promising evolution in the marketplace aimed at addressing ongoing affordability challenges. As inventory continues to expand, buyers may find themselves in a more favorable environment for negotiation, potentially leading to longer-term market stability.

In summary, the Florida housing market is showing resilience and adaptability amid fluctuating conditions. With significant increases in inventory and new listings, along with a modest uptick in single-family home sales, state dynamics are making room for potential growth and stability.

Florida Real Estate Forecast for Next 5 Years

Florida home values have risen by about 80% over the past 5 years and a positive trend is forecasted for the next 5 years. With the recent spike in mortgage payments as a result of rising interest rates, analysts are watching the Florida housing market closely to see what effect this will have. It is likely to restrict house price increases, but to what amount is unclear because there is still a “fear of losing out” attitude among purchasers, which is fueling the market, although slowly.

It’s no surprise that Zillow ranked Tampa, Florida, as the top real estate market in the United States in 2022. Florida housing prices have witnessed some of the most dramatic increases in the country, with Miami and Tampa at the forefront of the upswing. Due to a variety of variables, the housing market in Tampa has outpaced many others, including a large number of potential buyers, a scarcity of supply, strong property sales, and an active employment market in the area.

Overall, the Florida housing market is strong and is predicted to remain so in the next five years. If you’re a seller, this is wonderful news since it implies property values are rising and there isn’t much selling competition, giving you the luxury of selecting from the best offers on your schedule. Higher mortgage rates may cause unprepared house buyers to postpone their purchases.

If this reduces buyer demand sufficiently in some Florida areas, price appreciation may decrease. The lower price increase may provide remaining buyers who can afford higher interest rates more confidence in locating a home they can afford. And that leads to fewer home sales. If you’re selling a home in Florida this year, the odds are good that you’ll come out ahead financially. Real estate prices and mortgage rates are rising, and the few affordable houses that remain are being snapped up like sardines. If you want to buy in this market, now’s not the time to buy.

Whether or not the country enters a recession, the housing market appears to be in good shape for the foreseeable future. Perhaps not at the same rate that the United States has lately seen, but growth nevertheless. This is an excellent moment for real estate investors, particularly those interested in Florida, to capitalize on market possibilities.

Florida Real Estate Appreciation Rates For 10 Years

Florida’s real estate market has seen unprecedented price rises during the last few years, as a result of a lack of supply and high demand. Most of the emphasis is focused on the prices and the possibility of a housing bubble. While Florida’s mild temperature, cheap taxes, and natural attractions have historically enticed newcomers to the state, if affordable housing challenges continue to prevail across the state, these enticing elements may go away.

A post-pandemic world necessitates that the state of Florida deal with the fact that pricey housing can in certain respects impede economic growth and have an unequal impact on critical segments of the population. Florida has had some of the strongest housing appreciation rates in the country over the past decade.

Real estate appreciation rates in Florida have shown significant growth over various time periods, making it an attractive market for investors and homeowners alike. Here’s a breakdown of the appreciation rates based on data from NeighborhoodScout:

Latest Quarter (2022 Q4 – 2023 Q1)

During the latest quarter, spanning from the fourth quarter of 2022 to the first quarter of 2023, Florida’s real estate market experienced a modest appreciation rate of 0.02%. While this figure may seem relatively low, it’s essential to note that it outperformed the national average by 0.08%, indicating a resilient housing market in the face of economic fluctuations.

Last 12 Months (2022 Q1 – 2023 Q1)

Over the past year, from the first quarter of 2022 to the first quarter of 2023, Florida’s real estate market saw a substantial appreciation rate of 13.07%. This robust growth mirrored the average annual rate, once again highlighting the state’s resilience and attractiveness to investors, with a remarkable performance ranking of 10 compared to the rest of the country.

Last 2 Years (2021 Q1 – 2023 Q1)

Examining a slightly longer timeframe, from the first quarter of 2021 to the first quarter of 2023, the appreciation rate in Florida stood at an impressive 44.36%. This growth far exceeded the national average, by 20.15%, reinforcing Florida’s reputation as a thriving real estate market.

Last 5 Years (2018 Q1 – 2023 Q1)

Over the past five years, from the first quarter of 2018 to the first quarter of 2023, Florida’s real estate market exhibited substantial appreciation, boasting a rate of 77.01%. This rate exceeded the national average by 12.10%, signifying Florida’s consistent and strong real estate performance.

Last 10 Years (2013 Q1 – 2023 Q1)

When considering the last decade, from the first quarter of 2013 to the first quarter of 2023, Florida’s real estate market recorded remarkable appreciation of 174.83%. This growth, which surpassed the national average by 10.64%, demonstrates the state’s enduring appeal to real estate investors.

Since 2000 (2000 Q1 – 2023 Q1)

Finally, when looking at the broader picture from the first quarter of 2000 to the first quarter of 2023, Florida’s real estate market experienced exceptional appreciation, amounting to 281.81%. Even over this extended period, Florida outperformed the national average by 6.00%, reaffirming its status as a top choice for real estate investment over the years.

These appreciation rates indicate the dynamic and resilient nature of Florida’s real estate market, making it an attractive destination for those looking to invest in property.

Within Florida, Tampa Bay has one of the most overpriced housing markets in the nation, according to new research from Florida Atlantic University. Extremely low mortgage rates drove our red-hot housing market, particularly during the epidemic, and intensified bidding wars. Lakeland ranks 12th nationally, and second in the state, with homes overvalued by more than 53.2%. North Port-Sarasota-Bradenton is No. 17 nationally, fourth in the state at 48.9%.

What’s Affecting the Florida Housing Market in 2024?

Florida’s housing market, once a whirlwind of bidding wars and record-breaking sales, has entered a new phase in 2024. Let’s delve deeper into the key factors shaping this evolving landscape:

The Interest Rate Effect: The most impactful change is the significant rise in mortgage rates. Rates that hovered around 3% in early 2023 have climbed to over 7%, significantly affecting affordability and dampening buyer fervor. This translates to buyers having more breathing room to negotiate and explore options, a stark contrast to the recent past.
Inventory In Flux: With the sales frenzy subsiding, the number of homes on the market is gradually increasing. This rise in inventory benefits buyers by providing more choices and alleviating the intense competition that characterized the market in prior years. While some sellers may still experience bidding wars, particularly for highly desirable properties, buyers are no longer pressured into hasty decisions fueled by a lack of options.
Price Growth in Check: Fueled by low inventory and high demand, home prices in Florida have enjoyed steady appreciation for years. However, with rising interest rates squeezing affordability, the pace of appreciation is expected to slow down considerably in 2024. Experts even predict price stability or slight corrections in some areas, particularly those that experienced the most dramatic price hikes. This could present a potential buying opportunity for those who were previously priced out of the market.
Sellers Re-entering the Fray: Many homeowners who opted to hold off on selling during the seller’s market frenzy may decide to re-enter the market in 2024. This influx of listings will further contribute to the rise in available inventory, potentially tipping the scales further in favor of buyers. However, it’s important to note that Florida’s enduring appeal as a retirement destination and tax haven will continue to attract new residents, putting pressure on housing supply despite the market shift.
Demographic Shifts Continue: Florida’s sunshine, sandy beaches, and reputation for a relaxed lifestyle continue to be a magnet for retirees and those seeking a lower tax burden. This steady influx of new residents will undoubtedly put pressure on housing supply, even with the anticipated rise in inventory. This means that while affordability may improve in the short term, long-term price appreciation is still a possibility due to these strong demographic tailwinds.
New Construction on the Horizon: The persistent demand for housing, coupled with the ongoing shortage of existing inventory, may incentivize an increase in new home construction in 2024. This could help alleviate some of the pressure on housing supply, particularly in high-demand areas. However, rising construction costs and ongoing supply chain issues could pose challenges for builders, potentially limiting the pace of new development.

Will the Housing Market Crash in Florida?

Population growth, and particularly growth in the number of households, lead to a growth in housing demand. Real estate is subject to the law of supply and demand: when there are more purchasers than available homes, prices rise.  Since the 1940s, Florida’s population has increased year after year, often outperforming the national average. However, like the rest of the United States, growth plummeted to historic lows during the initial years of the pandemic until rebounding last year.

Florida is now America’s fastest-growing state. According to recent census data, the Sunshine State added over 400,000 additional people between July 2021 to July 2022. It was a growth of 1.9%, bringing the total population to 22,244,823. That makes it faster-growing than Texas, which has the second-largest population in the United States, trailing only California.

According to experts, the national housing market or the market in Florida is nowhere near the crash that occurred during the Great Recession of 2008. This is partially due to tighter lending laws coming from the financial crisis. Borrowers are in considerably better shape, as seen by their improved credit scores. And as a result of rising home values, homeowners have a record amount of equity.

The current situation is a fairly complex web, but it’s nothing compared to the 2008-2009 market crisis, which took years to unravel. The Fed’s pandemic actions fueled a housing boom. As it tries to withdraw that support, it could be bad news for housing but will it lead to a crash? The Fed will continue to play a crucial role in the future of the housing market.

Back in February 2020, the Fed owned $1.4 trillion in mortgage-backed securities, and the number was falling rapidly. As the pandemic took root, however, the central bank initiated a new round of bond purchases (known as “quantitative easing”), bringing the number to $2.7 trillion.

Fed seeks to tighten monetary policy to combat inflation Although it wants to shrink that portfolio it is quite improbable that the Fed can unwind its balance sheet. It might simply accept the fact that it will continue to play a disproportionate role in the housing market and have a larger balance sheet than it would prefer. Prepare for a collapse, not a correction, in the housing market during the next 18 to 24 months if they do.

How is the Florida Housing Market for Investors?

Florida’s strong population growth, diverse job market, tourist attractions, affordable property prices, tax benefits, and diversified economy all contribute to making it a hot spot for real estate investment.

Strong Population Growth and Job Market:

Florida has strong population growth, particularly in cities like Miami, Orlando, and Tampa. The population has grown consistently and positively over the years, and in 2023, it increased by 1.6%. This makes Florida the third most populated state in the US, with a population of over 22.6 million people.

In 2022, Florida was the fastest-growing state in the country for the first time since the 1950s, increasing by 1.9%. This leads to an increased demand for housing, making it a prime location for real estate investment.

Additionally, Florida’s job market is diverse and growing, which attracts new residents and supports the demand for housing. According to FloridaCommerce, Florida’s private sector job growth rate increased by 2.1% in March 2024, which is faster than the national rate of 1.7%. In January 2024, Florida’s labor force grew by 2.2%, which is faster than the national rate of 0.8%.

Tourist Attraction:

Florida is a booming real estate market due to tourism. Florida attracts millions of tourists annually. In 2023, Florida’s market share of domestic tourists increased to 14.8%, up from 13.8% in 2022. This surge in market share represents the largest increase of any state, underscoring Florida’s appeal to travelers from across the country.2 days ago

In tourist-heavy areas like Miami, Orlando, and others, vacation rental properties are in high demand. Vacation rentals offer greater space, privacy, and facilities than hotels for Florida tourists. Investors can earn rental income and gain property value via vacation rentals.

Vacation rental properties are more reliable and profitable than typical rental properties due to high demand. Tourists pay extra for comfortable vacation rentals. Tourist demand can remain consistent throughout economic downturns, making vacation rental properties more market-resilient. Florida’s great tourist draw can offer real estate investors looking for vacation rental properties a reliable and successful revenue stream and property value appreciation.

Realtively Affordable Property Prices:

Compared to other states like California, property prices in Florida are relatively affordable, which can make it an attractive option for real estate investors. This can lead to strong returns on investment and can make it easier for investors to purchase multiple properties. It’s important to note that property prices can vary widely depending on location and property type. While some areas of Florida may have lower property prices, other areas, such as beachfront or tourist-friendly areas, may have higher property prices.

Tax Benefits:

Florida’s lack of state income tax holds significant advantages for real estate investors. This translates to higher net profits, as rental income isn’t taxed by the state. This frees up more cash flow that can be used for reinvestment, debt repayment, or simply boosting financial security. Additionally, the absence of state income tax directly improves the return on investment (ROI). With less money going towards taxes, the overall return becomes more attractive.

Compared to real estate markets in states with high income tax rates, Florida offers a competitive edge. Investors looking to maximize their returns are naturally drawn to Florida’s tax benefits. There’s also a tax deferral advantage. Capital gains taxes on selling an investment property are typically deferred until the sale occurs. This allows investors to accumulate wealth and potentially benefit from lower tax rates in the future.

For seasonal residents who rent out their properties during off-seasons, Florida’s tax structure is particularly attractive. The lack of state income tax on rental income can be a major draw, making Florida a compelling option for this investor group.

It’s important to remember that while there’s no state income tax, Florida does have other taxes that can impact real estate investors. Property taxes and sales taxes on renovations are important factors to consider. Consulting with a tax advisor is crucial to fully understand the tax implications of real estate investment in Florida.

Diversified Economy:

Florida’s real estate market benefits from the state’s diverse economic landscape. Unlike regions reliant on a single industry, Florida’s economic engine is powered by a mix of sectors like agriculture, tourism, aerospace, and technology. This diversification acts as a buffer during economic downturns.

Florida’s economy grew 9.3% in 2023, the fastest rate in the country, and is expected to continue to grow at a faster pace than any other state. However, some expect growth to decelerate to 2.8% and 1.1% over the current and next fiscal years as businesses and consumers transition from a high inflation environment to a high interest rate environment.

Even if one industry slumps, the others can help maintain stability, which translates to a more predictable market for real estate investors. However, this advantage shouldn’t overshadow the importance of thorough research. Understanding the specific market, the property itself, and developing a risk management plan are all crucial steps before investing in Florida real estate.


This article was originally published by a www.noradarealestate.com . Read the Original article here. .

Pin It