Tag

March

Browsing


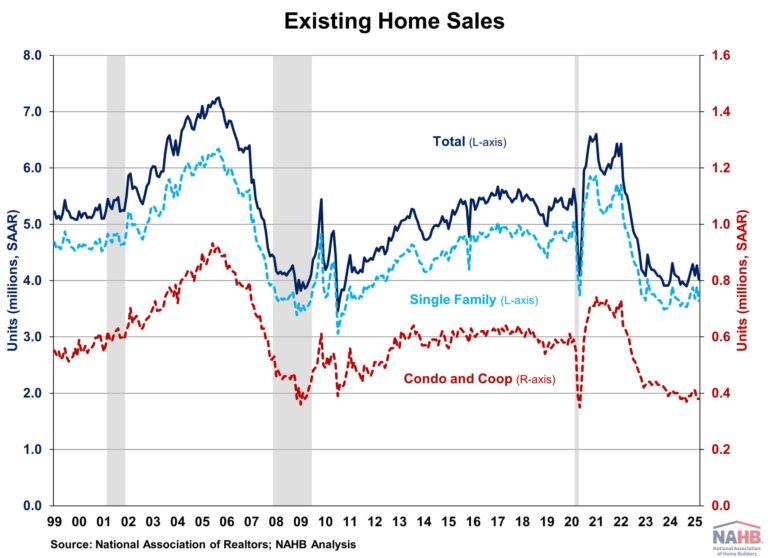
Existing home sales declined in March, according to the National Association of Realtors (NAR), as affordability challenges continued to weigh on the market. For the first time, the median home price surpassed $400,000 for the month of March, underscoring the ongoing pressure on prospective buyers. While mortgage rates have eased slightly, persistent economic uncertainty may continue to limit buyer activity in the near term.

While existing home inventory improves and the Fed continues lowering rates, the market faces headwinds as mortgage rates are expected to stay above 6% for longer due to an anticipated slower easing pace in 2025. These prolonged rates may continue to discourage homeowners from trading existing mortgages for new ones with higher rates, keeping supply tight and prices elevated. As such, sales are likely to remain limited in the coming months due to elevated mortgage rates and home prices.

Total existing home sales, including single-family homes, townhomes, condominiums, and co-ops, declined 5.9% to a seasonally adjusted annual rate of 4.02 million in March. On a year-over-year basis, sales were 2.4% lower than a year ago.

The share of first-time buyers rose to 32% in March, up from 31% in February and unchanged from March 2024.

The existing home inventory level was 1.33 million units in March, up 8.1% from February and 19.8% from a year ago. At the current sales rate, March unsold inventory sits at a 4.0-months’ supply, up from 3.5 months in February and 3.2 months in March 2024. This inventory level remains low compared to balanced market conditions (4.5 to 6 months’ supply) and illustrates the long-run need for more home construction.

Homes stayed on the market for an average of 36 days in March, down from 42 days in February but up from 33 days in March 2024.

The March all-cash sales share was 26% of transactions, down from 32% in February and 28% a year ago.

The March median sales price of all existing homes was $403,700, up 2.7% from last year. This marked the 21st consecutive month of year-over-year increases. The median condominium/co-op price in March was up 1.5% from a year ago at $363,000. This rate of price growth will slow as inventory increases.

In March, existing home sales declined across all four major U.S. regions. The West experienced the steepest drop, with sales falling 9.4%, followed by the South (-5.7%), the Midwest (-5.0%), and the Northeast (-2.0%). On a year-over-year basis, sales rose slightly in the West by 1.3%, declined in the South and Midwest by 4.2% and 3.1% respectively, and remained unchanged in the Northeast.

The Pending Home Sales Index (PHSI) is a forward-looking indicator based on signed contracts. The PHSI fell from 70.6 to an all-time low of 67.3 in February. This decline suggests elevated home prices and higher mortgage rates continue to constrain affordability. On a year-over-year basis, pending sales were 9.9% lower than a year ago, per National Association of Realtors data.

Discover more from Eye On Housing

Subscribe to get the latest posts sent to your email.


This article was originally published by a eyeonhousing.org . Read the Original article here. .

A modest decline in mortgage rates and lean existing inventory helped boost new home sales in March even as builders and consumers contend with uncertain market conditions.

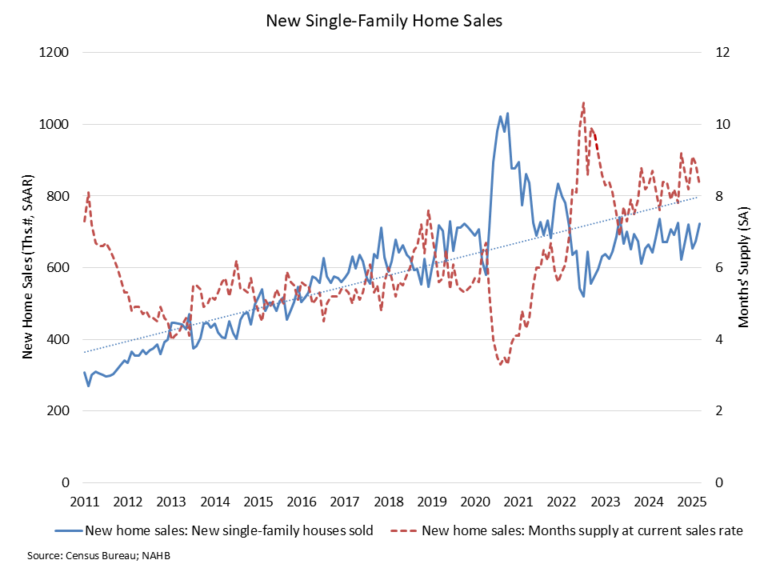
Sales of newly built, single-family homes in March increased 7.4% to a 724,000 seasonally adjusted annual rate from a revised January number, according to newly released data from the U.S. Department of Housing and Urban Development and the U.S. Census Bureau. The pace of new home sales in March was up 6.0% compared to a year earlier.

The March new home sales data shows that demand continues to be present in the market, provided affordability conditions permit a purchase. An increase in economic certainty would be a big boost to future sales conditions. Lower mortgage interest rates helped boost the pace of new home sales in March. In February, the average 30-year fixed rate mortgage was 6.84%, while in March it fell to 6.65%.

A new home sale occurs when a sales contract is signed, or a deposit is accepted. The home can be in any stage of construction: not yet started, under construction or completed. In addition to adjusting for seasonal effects, the March reading of 724,000 units is the number of homes that would sell if this pace continued for the next 12 months.

New single-family home inventory in March continued to rise to a level of 503,000, up 7.9% compared to a year earlier. This represents an 8.3 months’ supply at the current building pace. This level of supply continues to be reasonable given that the resale, single-family months’ supply remains lean at just 3.4. The count of completed, ready-to-occupy homes available for sale increased to 119,000, up 34% from a year ago.

However, the March data also is showing signs that the total amount of inventory in the new construction space has slowed given soft housing conditions at the start of 2025. For example, the count of new homes available for sale that are under construction (263,000 in March) is down 5% year-over-year and 6% lower than the non-seasonally adjusted peak count set in October 2024.

The median new home sale price in March was $403,600, down 7.5% from a year ago. Sales were particularly strong at lower price levels. Compared to March 2024, new homes sales were 33% higher for homes priced below $300,000 and 28% higher for new homes priced between $300,000 and $400,000.

Regionally, on a year-to-date basis, new home sales are up 12.9% in the South, but are down 32% in the Northeast, 18.3% in the Midwest and 6% in the West.

Discover more from Eye On Housing

Subscribe to get the latest posts sent to your email.


This article was originally published by a eyeonhousing.org . Read the Original article here. .

Nonfarm payroll employment increased in 37 states and the District of Columbia in March compared to the previous month, while it decreased in 12 states. Wyoming reported no change during this time. According to the Bureau of Labor Statistics, nationwide total nonfarm payroll employment increased by 228,000 in March following a gain of 117,000 jobs in February.

On a month-over-month basis, employment data was most favorable in Texas, which added 26,500 jobs. Pennsylvania came in second (+20,900), followed by Florida (+18,100). Meanwhile, a total of 33,900 jobs were lost across 12 states, with California reporting the steepest job losses at 11,600. In percentage terms, employment increased the highest in Missouri at 0.5%, while Connecticut saw the biggest decline at 0.3% between February and March.

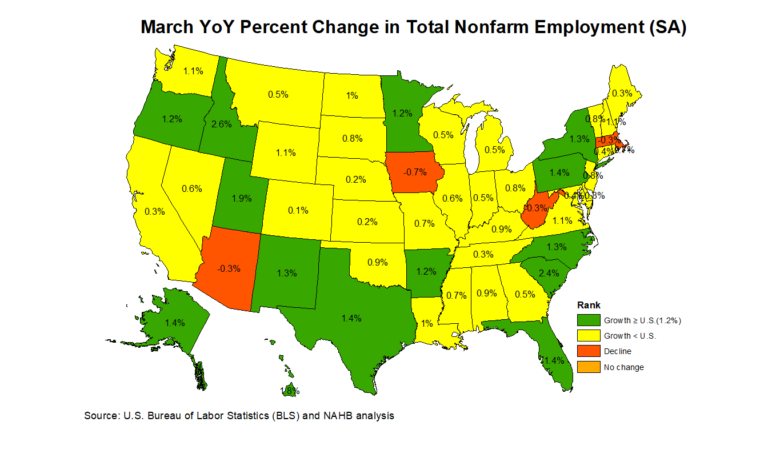
Year-over-year ending in March, 1.9 million jobs have been added to the labor market, which is a 1.2% increase compared to the March 2024 level. The range of job gains spanned from 300 jobs in the District of Columbia to 192,100 jobs in Texas. Four states lost a total of 34,700 jobs in the past 12 months, with Iowa reporting the steepest job losses at 11,800. In percentage terms, the range of job growth spanned 2.6% in Idaho to 0.1% in Colorado. The District of Columbia was unchanged while West Virginia, Massachusetts, Arizona, and Iowa declined by 0.3%, 0.3%, 0.3%, and 0.7% respectively.

Construction Employment

Across the nation, construction sector jobs data —which includes both residential and non-residential construction—showed that 30 states reported an increase in March compared to February, while 17 states and the District of Columbia lost construction sector jobs. The three remaining states reported no change on a month-over-month basis. Texas, with the highest increase, added 8,500 construction jobs, while California, on the other end of the spectrum, lost 3,700 jobs. Overall, the construction industry added a net 13,000 jobs in March compared to the previous month. In percentage terms, Kentucky reported the highest increase at 3.6% and Mississippi reported the largest decline at 3.4%.

Year-over-year, construction sector jobs in the U.S. increased by 143,000, which is a 1.8% increase compared to the March 2024 level. Texas added 28,700 jobs, which was the largest gain of any state, while California lost 23,400 construction sector jobs. In percentage terms, New Mexico had the highest annual growth rate in the construction sector at 12.0%. Over this period, Washington reported the largest decline of 5.3%.

Discover more from Eye On Housing

Subscribe to get the latest posts sent to your email.


This article was originally published by a eyeonhousing.org . Read the Original article here. .

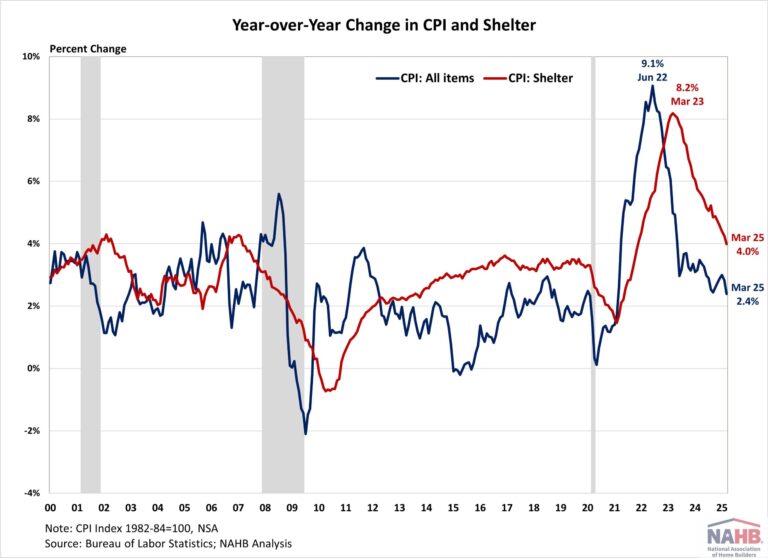
Inflation slowed to a 6-month low in March, largely driven by lower energy costs, especially in gasoline prices. Despite the easing, the report likely only captures part of the first wave of global tariffs announcement. The inflationary pressure from tariffs and escalating trade war continues to threaten the economic growth and complicate the Fed’s path to its 2% target. Meanwhile, while housing inflation remains elevated, it continues to show signs of cooling – the year-over-year change in the shelter index remained below 5% for a seven straight month and posted its lowest annual gain since November 2021.

While the Fed’s interest rate cuts could help ease some pressure on the housing market, its ability to address rising housing costs is limited, as these increases are driven by a lack of affordable supply and increasing development costs. In fact, tight monetary policy hurts housing supply because it increases the cost of AD&C financing. This can be seen on the graph below, as shelter costs continue to rise at an elevated pace despite Fed policy tightening. Additional housing supply is the primary solution to tame housing inflation and with it, overall inflation. This emphasizes why the cost of construction, including the cost of building materials, matters not just for housing but also the inflation outlook and the path of future monetary policy.

Consequently, the election result has put inflation back in the spotlight and added additional upside and downside risks to the economic outlook. Proposed tax cuts and tariffs could increase inflationary pressures, suggesting a more gradual easing cycle with a slightly higher terminal federal funds rate. However, economic growth could also be higher with lower regulatory burdens. Given the housing market’s sensitivity to interest rates, a higher inflation path could extend the affordability crisis and constrain housing supply as builders continue to grapple with lingering supply chain challenges.

During the past twelve months, on a non-seasonally adjusted basis, the Consumer Price Index rose by 2.4% in March, according to the Bureau of Labor Statistics’ report. This followed a 2.8% year-over-year increase in February. Excluding the volatile food and energy components, the “core” CPI increased by 2.8% over the past twelve months, the smallest increase since March 2021. A large portion of the “core” CPI is the housing shelter index, which increased 4.0% over the year, the smallest year-over-year increase since November 2021.  Meanwhile, the component index of food rose by 3.0%, and the energy component index fell by 3.3%.

On a monthly basis, the CPI fell by 0.1% in March (seasonally-adjusted), after a 0.2% increase in February. This was the first time the monthly CPI has fallen since May 2020. The “core” CPI increased by 0.1% in March.

The price index for a broad set of energy sources fell by 2.4% in March, with declines in gasoline (-6.3%) offset by increases in electricity (+0.9%) andnatural gas (+3.6%). Meanwhile, the food index rose 0.4%, after a 0.2% increase in February. The index for food away from home increased by 0.4% and the index for food at home rose by 0.5%.

Despite the overall monthly CPI decline, several indexes increased in March including personal care (+1.0%), medical care (+0.2%), education (+0.4%), apparel (+0.4%), as well as new vehicles (+0.1%). Meanwhile, the index for airline fares (-5.3%), used cars and trucks (-0.7%) and recreation (-0.3%) were among the major indexes that decreased over the month.

The index for shelter makes up more than 40% of the “core” CPI, rose by 0.2% in March, following an increase of 0.3% in February. The index for owners’ equivalent rent (OER) rose by 0.4% and index for rent of primary residence (RPR) increased by 0.3% over the month. Despite the moderation, shelter costs remained the largest contributors to headline inflation. 

NAHB constructs a “real” rent index to indicate whether inflation in rents is faster or slower than core inflation. It provides insight into the supply and demand conditions for rental housing. When inflation in rents is rising faster than core inflation, the real rent index rises and vice versa. The real rent index is calculated by dividing the price index for rent by the core CPI (to exclude the volatile food and energy components).

In March, the Real Rent Index rose by 0.3%. Over the first three months of 2025, the monthly growth rate of the Real Rent Index averaged at 0.1%, higher than 0.0% from the same period in 2024.

Discover more from Eye On Housing

Subscribe to get the latest posts sent to your email.


This article was originally published by a eyeonhousing.org . Read the Original article here. .


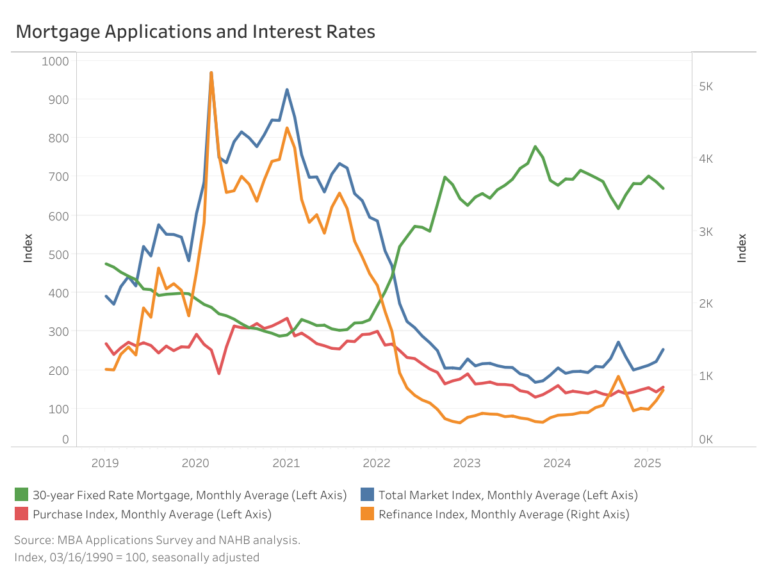
The Market Composite Index, which measures mortgage loan application volume based on the Mortgage Bankers Association (MBA) weekly survey, rose 14.0% month-over-month on a seasonally adjusted (SA) basis, driven primarily by a surge in refinancing activity. Year-over-year, the index is up 29.2% compared to March 2024.

The Purchase Index rebounded 8.3% (SA) from the previous month as mortgage rates declined. Meanwhile, the Refinance Index surged 22.2% (SA), continuing its strong upward trend. Compared to a year ago, purchase applications are up 7.6%, while refinance activity has jumped 72.9%.

Economic uncertainty continues to drive treasury yield volatility, impacting mortgage rates. In March, the average 30-year fixed-rate mortgage reported in the MBA survey fell 17 basis points (bps) to 6.7%, marking a 23 bps decline from a year ago.

Loan sizes have continued to rise since the start of the year. In March, the average loan size across the total market (including purchases and refinances) increased 3.5% month-over-month (NSA) to $403,300. For purchase loans, the average size edged up 0.9% to $450,000, while refinance loans saw a sharper increase of 10.4%, reaching $337,500. Meanwhile, the average loan size for adjustable-rate mortgages (ARMs) rose slightly by 1.1%, from $1.13 million to $1.14 million.

Discover more from Eye On Housing

Subscribe to get the latest posts sent to your email.


This article was originally published by a eyeonhousing.org . Read the Original article here. .


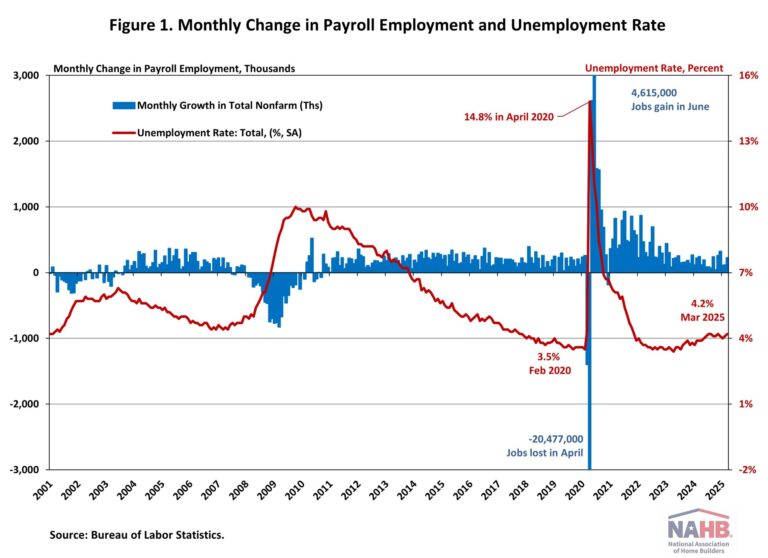
The U.S. job market unexpectedly accelerated in March, while the figures for January and February were revised downward substantially. The unemployment rate ticked up slightly to 4.2% in March, from 4.1% the previous month. This month’s jobs report highlights the continued resilience of the labor market despite sticky inflation, a drop in consumer confidence, mass federal government layoffs, and growing economic uncertainty.

Noticeably, residential construction employment has shown signs of weakness in recent months. In March, the six-month moving average of job gains for residential construction turned negative for the first time since August 2020. It reflects three significant drops in employment: 8,400 jobs in October 2024, 6,700 jobs in January 2025, and 9,800 jobs in March 2025. Additionally, the construction job openings rate has returned to 2019 levels, driven by a slowdown in construction activity.

In March, wage growth slowed. Year-over-year, wages grew at a 3.8% rate, down 0.3 percentage points from a year ago. Wage growth has been outpacing inflation for nearly two years, which typically occurs as productivity increases.

National Employment

According to the Employment Situation Summary reported by the Bureau of Labor Statistics (BLS), total nonfarm payroll employment rose by 228,000 in March, following a downwardly revised increase of 117,000 jobs in February. Since January 2021, the U.S. job market has added jobs for 51 consecutive months, making it the third-longest period of employment expansion on record.

The estimates for the previous two months were revised down. The monthly change in total nonfarm payroll employment for January was revised down by 14,000 from +125,000 to +111,000, while the change for February was revised down by 34,000 from +151,000 to +117,000. Combined, the revisions were 48,000 lower than previously reported.

The unemployment rate rose to 4.2% in March. While the number of employed persons increased by 201,000, the number of unemployed persons increased by 31,000.

Meanwhile, the labor force participation rate—the proportion of the population either looking for a job or already holding a job—rose one percentage point to 62.5%. For people aged between 25 and 54, the participation rate decreased two percentage points to 83.3%. While the overall labor force participation rate remains below its pre-pandemic levels of 63.3% at the beginning of 2020, the rate for people aged between 25 and 54 has been trending down since it peaked at 83.9% last summer.

In March, employment rose in health care (+54,000), social assistance (+24,000), and transportation and warehousing (+23,000). Employment in retail trade also added 24,000 jobs in March, partially reflecting the return of workers from a strike. However, within the government sector, federal government employment saw a decline of 4,000, following a loss of 11,000 jobs in February. The BLS notes that “employees on paid leave or receiving ongoing severance pay are counted as employed in the establishment survey.”

Construction Employment

Employment in the overall construction sector increased by 13,000 in March, following a gain of 14,000 in February. While residential construction saw a decline of 9,800 jobs, non-residential construction employment added 22,300 jobs for the month.

Residential construction employment now stands at 3.4 million in March, broken down as 958,000 builders and 2.4 million residential specialty trade contractors. The six-month moving average of job gains for residential construction was -2,883 a month, mainly reflecting the three months’ job loss over the past six months (October 2024, January 2025 and March 2025). Over the last 12 months, home builders and remodelers added 14,000 jobs on a net basis. Since the low point following the Great Recession, residential construction has gained 1,367,600 positions.

In March, the unemployment rate for construction workers declined to 4.3% on a seasonally adjusted basis. The unemployment rate for construction workers has remained at a relatively lower level, after reaching 15.3% in April 2020 due to the housing demand impact of the COVID-19 pandemic.

Discover more from Eye On Housing

Subscribe to get the latest posts sent to your email.


This article was originally published by a eyeonhousing.org . Read the Original article here. .


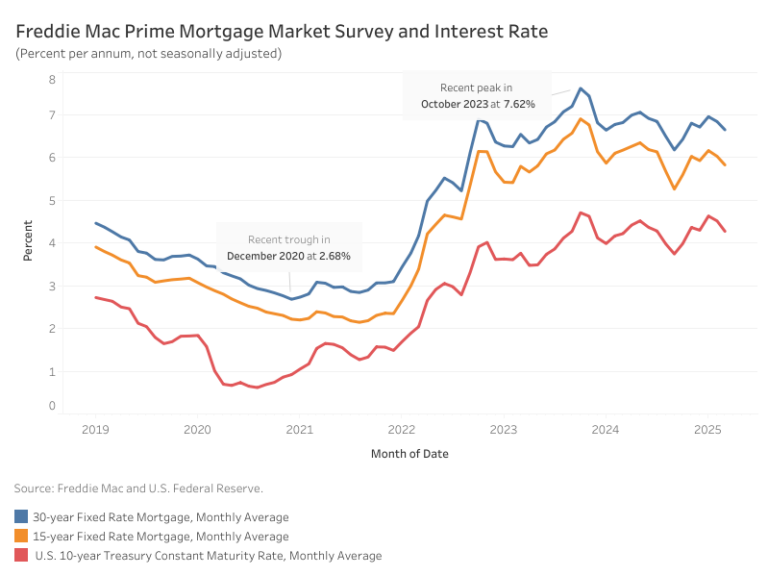
Mortgage rates dropped significantly at the start of March before stabilizing, with the average 30-year fixed-rate mortgage settling at 6.65%, according to Freddie Mac. This marks a 19-basis-point (bps) decline from February. Meanwhile, the 15-year fixed-rate mortgage fell by 20 bps to 5.83%.

The drop in long-term borrowing costs was driven by a 24-bps decline in the 10-year Treasury yield, which averaged 4.28% in March. This decline provided a boost to the housing market—new home sales increased 5.1% year-over-year in February, while the participation of first-time homebuyer of existing homes rose 26% over the same period. However, existing home sales saw a slight dip from last February.

The decrease in Treasury yields reflects growing concerns about an economic slowdown, particularly as shifts in tariff policy weaken consumer confidence. Despite this, the labor market remained resilient in February, posting steady job gains even as the unemployment rate ticked up slightly. The strength of upcoming jobs reports will be critical in assessing whether recession risks are intensifying.

At the latest FOMC meeting, the Federal Reserve held interest rates steady but revised its 2025 economic projections: expected GDP growth was lowered to 1.7% (down from 2.1% in December 2024) and the projected unemployment rate was raised to 4.4%, up 0.1 percentage point from previous estimates.

Discover more from Eye On Housing

Subscribe to get the latest posts sent to your email.


This article was originally published by a eyeonhousing.org . Read the Original article here. .


Design Bar, LLCSave Photo
14. Plant a tree. Spring and fall are the best times to plant trees because wet weather and cooler temperatures make it easier for root systems to get established. Be sure to check with a nursery to determine which species will do best in your microclimate and to get detailed planting instructions. If your area has a late date of last frost, you may need to wait until all threat has passed before planting.

15. Inspect your home’s exterior for winter damage and make repairs as needed. Once winter storms have passed, carefully inspect the exterior of your home. If you had an ice dam on your roof during the winter, now is the time to repair any damage it caused. Ice dams form when the edges of a home’s roof are colder than the upper regions (where more insulation sits below the roof), causing ice to form around the eaves. The best way to prevent them is by upgrading insulation and ventilation in the attic.

Share: What’s on your home to-do list this March? Tell us in the Comments.

More on Houzz
Choose Your Own Spring Cleaning Plan
Find a pro for your next home project
Shop for home products


This article was originally published by a
www.houzz.com . Read the Original article here. .
Pin It