Tag

Level

Browsing


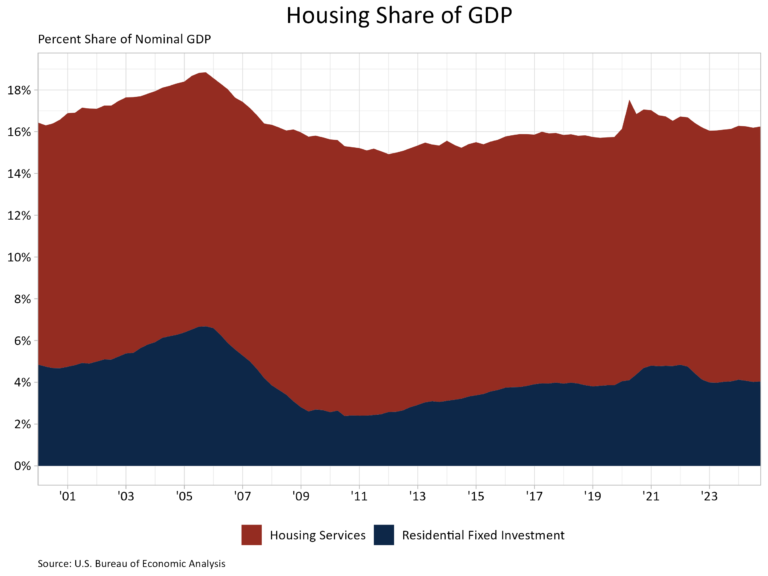
Housing’s share of the economy remained unchanged at 16.2% in the fourth quarter of 2024, according to the advance estimate of GDP produced by the Bureau of Economic Analysis. For the year, housing’s share of the economy was 16.2%, up from 16.0% in 2023 and down from 16.5% in 2022.

The more cyclical home building and remodeling component – residential fixed investment (RFI) – was 4.0% of GDP, level with the previous quarter. The second component – housing services – was 12.2% of GDP, also level with the previous quarter. The graph below stacks the nominal shares for housing services and RFI, resulting in housing’s total share of the economy.

Housing service growth is much less volatile when compared to RFI due to the cyclical nature of RFI. Historically, RFI has averaged roughly 5% of GDP while housing services have averaged between 12% and 13%, for a combined 17% to 18% of GDP. These shares tend to vary over the business cycle. However, the housing share of GDP lagged during the post-Great Recession period due to underbuilding, particularly for the single-family sector.

In the fourth quarter, RFI added 21 basis points from the headline GDP growth rate in the fourth quarter of 2024, a welcomed result as RFI previously had two consecutive quarters of negative contributions to GDP. The Federal Reserve, while keeping unchanged this month, lowered the federal funds rate by 100 basis points in September and December of 2024. This likely improved financing conditions for many builders, leading to RFI’s growth in the fourth quarter. A notable observation from the fourth quarter release was nonresidential fixed investment (similar to RFI, but for nonresidential structures) negatively contributed 31 basis points to GDP growth, the first negative effect on the economy for nonresidential fixed investment in over three years.

Housing services added 17 basis points (bps) to GDP growth.  Among household expenditures for services, housing services contributions were the fourth-highest contributor to headline GDP growth behind health care (46 bps), other services (31 bps) and financial services and insurance (18 bps).

Overall GDP increased at a 2.3% annual rate, down from a 3.1% increase in the third quarter of 2024, and down from a 3.0% increase in the second quarter of 2024. Headline GDP growth in 2024 was 2.8%, down slightly from 2.9% in 2023 but up from 2.5% in 2022.

Housing-related activities contribute to GDP in two basic ways:

The first is through residential fixed investment (RFI). RFI is effectively the measure of home building, multifamily development, and remodeling contributions to GDP. RFI consists of two specific types of investment, the first is residential structures. This investment includes construction of new single-family and multifamily structures, residential remodeling, production of manufactured homes, brokers’ fees and some types of equipment that are built into the structure. RFI’s second component, residential equipment, includes investment such as furniture or household appliances that are purchased by landlords for rental to tenants.

For the fourth quarter, RFI was 4.0% of the economy, recording a $1.200 trillion seasonally adjusted annual pace. RFI grew 5.3% at an annual rate in the fourth quarter after falling 4.4% in the third. Among the two types of RFI, real investment in residential structures rose 5.3% while for residential equipment it rose 4.9%. Investment in residential structures stood at a seasonally adjusted annual pace of $1.178 trillion, making its share of residential investment far greater than that of residential equipment, which was at seasonally adjusted annual pace of $21.5 billion.

The second impact of housing on GDP is the measure of housing services. Similar to the RFI, housing services consumption can be broken out into two components. The first component, housing, includes gross rents paid by renters, owners’ imputed rent (an estimate of how much it would cost to rent owner-occupied units), rental value of farm dwellings, and group housing. The inclusion of owners’ imputed rent is necessary from a national income accounting approach, because without this measure, increases in homeownership would result in declines in GDP. The second component, household utilities, is composed of consumption expenditures on water supply, sanitation, electricity, and gas.

For the fourth quarter, housing services represented 12.2% of the economy or $3.625 trillion on a seasonally adjusted annual basis. Housing services grew 1.4% at an annual rate in the fourth quarter. Real person consumption expenditures for housing also grew 1.4%, while household utilities expenditures grew 1.6%. At the seasonally adjusted annual pace, housing expenditures was $3.166 trillion and household utility expenditures stood at $458.9 billion in seasonally adjusted annual rates.

Discover more from Eye On Housing

Subscribe to get the latest posts sent to your email.


This article was originally published by a eyeonhousing.org . Read the Original article here. .

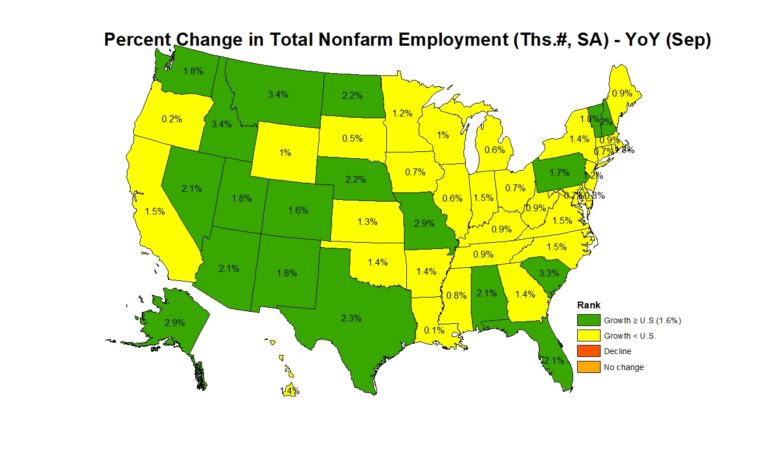
Nonfarm payroll employment increased in 41 states and the District of Columbia in September compared to the previous month, while eight states saw a decrease. Nevada reported no change. According to the Bureau of Labor Statistics, nationwide total nonfarm payroll employment increased by 254,000 in September, following a gain of 159,000 jobs in August.

On a month-over-month basis, employment data was most favorable in Texas, which added 29,200 jobs. New Jersey came in second (+19,200), followed by Florida (+17,000). A total of 17,400 jobs were lost across eight states, with Iowa reporting the steepest job losses at 4,800. In percentage terms, employment increased the highest in Idaho at 0.7%, while Iowa saw the biggest decline at 0.3% between August and September.

Year-over-year ending in September, 2.4 million jobs have been added to the labor market across all 50 states and the District of Columbia. The range of job gains spanned from 2,000 jobs in Louisiana to 327,400 jobs in Texas. In percentage terms, the range of job growth spanned 3.4% in Idaho to 0.1% in Louisiana.

Across the nation, construction sector jobs data   —which includes both residential and non-residential construction—showed that 24 states and the District of Columbia reported an increase in September compared to August, while 23 states lost construction sector jobs. The three remaining states reported no change on a month-over-month basis. Texas, with the highest increase, added 8,100 construction jobs, while Tennessee, on the other end of the spectrum, lost 1,600 jobs. Overall, the construction industry added a net 25,000 jobs in September compared to the previous month. In percentage terms, Ohio reported the highest increase at 2.7% and North Dakota reported the largest decline at 2.1%.

Year-over-year, construction sector jobs in the U.S. increased by 238,000, which is a 3.0% increase compared to the September 2023 level. Texas added 42,300 jobs, which was the largest gain of any state, while New York lost 6,900 construction sector jobs. In percentage terms, Alaska had the highest annual growth rate in the construction sector at 21.1%. Over this period, Oregon reported the largest decline of 4.1%.

Discover more from Eye On Housing

Subscribe to get the latest posts sent to your email.


This article was originally published by a eyeonhousing.org . Read the Original article here. .

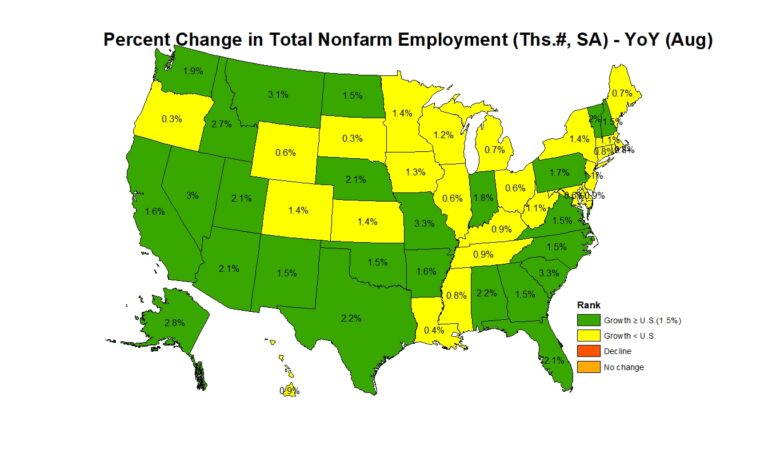
Nonfarm payroll employment increased in 32 states in August compared to the previous month, while 17 states and the District of Columbia saw a decrease. Kansas reported no change. According to the Bureau of Labor Statistics, nationwide total nonfarm payroll employment increased by 142,000 in August, following a gain of 89,000 jobs in July.

On a month-over-month basis, employment data was most favorable in Texas, which added 78,000 jobs. Texas accounted for more than half the jobs created nationwide in August. Indiana came in second (+19,800), followed by Minnesota (+14,400). A total of 42,400 jobs were lost across the 17 states and the District of Columbia, with New York reporting the steepest job losses at 7,400. In percentage terms, employment increased the highest in Texas and Indiana at 0.6%, while South Dakota saw the biggest decline at 0.7% between July and August.

Year-over-year ending in August, 2.4 million jobs have been added to the labor market across all 50 states and the District of Columbia. The range of job gains spanned from 1,500 jobs in South Dakota to 302,400 jobs in Texas. In percentage terms, the range of job growth spanned 3.3% in Missouri to 0.3% in South Dakota.

Across the nation, construction sector jobs data1 —which includes both residential and non-residential construction—showed that 27 states and the District of Columbia reported an increase in August compared to July, while 20 states lost construction sector jobs. The three remaining states reported no change on a month-over-month basis. Texas, with the highest increase, added 8,300 construction jobs, while California, on the other end of the spectrum, lost 3,300 jobs. Overall, the construction industry added a net 34,000 jobs in August compared to the previous month. In percentage terms, Wyoming reported the highest increase at 2.3% and Tennessee reported the largest decline at 1.6%.

Year-over-year, construction sector jobs in the U.S. increased by 228,000, which is a 2.8% increase compared to the August 2023 level. Texas added 36,600 jobs, which was the largest gain of any state, while Maryland lost 4,800 construction sector jobs. In percentage terms, Alaska had the highest annual growth rate in the construction sector at 17.8%. Over this period, Maine reported the largest decline of 4.7%.

Discover more from Eye On Housing

Subscribe to get the latest posts sent to your email.


This article was originally published by a eyeonhousing.org . Read the Original article here. .

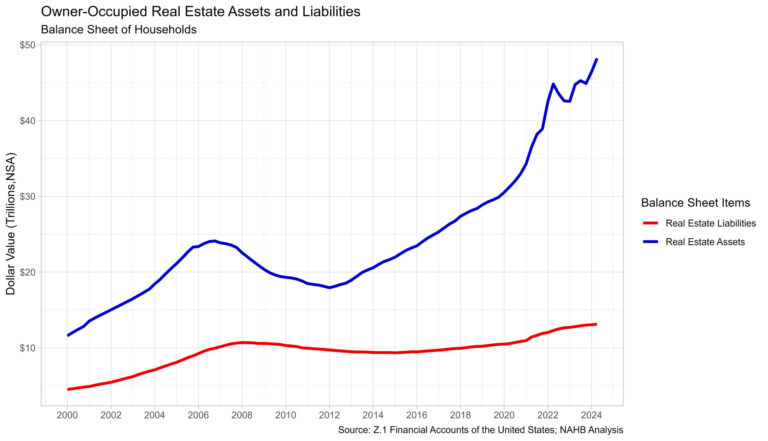
Owners’ equity share of household real estate assets remained above 70% for the tenth straight quarter, continuing to mark the highest levels of this share since the late 1950s. The share in the second quarter of 2024 was 72.7%, up from a year ago when it stood at 71.4%. Notably, this is the highest reading of owners’ equity share since the fourth quarter of 1958, when it was 73.3%.

Household real estate assets represent all types of owner-occupied housing including farm houses and mobile homes, as well as second homes that are not rented, vacant homes for sale, and vacant land at current market value. Household real estate liabilities represent all outstanding residential mortgages as well as loans made under home equity lines of credit and home equity loans secured by junior liens. Owners’ equity is the difference between the current market value of the household’s property and the existing debt secured by the property (assets – liabilities).

The market value of household real estate assets rose from $46.4 trillion to $48.2 trillion in the second quarter of 2024 according to the most recent release of U.S. Federal Reserve Z.1 Financial Accounts. Over the year, household real estate assets were 7.7% higher in the second quarter following a 9.2% increase in the first quarter.

Household real estate secured liabilities, i.e. mortgages, home equity loans, and HELOCs, increased 0.8% over the second quarter to $13.1 trillion. This level is 2.6% higher than the second quarter of 2023, the same as the increase in the first quarter of 2.6%.

Discover more from Eye On Housing

Subscribe to get the latest posts sent to your email.


This article was originally published by a eyeonhousing.org . Read the Original article here. .

Nonfarm payroll employment increased in 28 states in July compared to the previous month, while 22 states saw a decrease. The District of Columbia reported no change. According to the Bureau of Labor Statistics, nationwide total nonfarm payroll employment increased by 114,000 in July, following a gain of 179,000 jobs in June.

On a month-over-month basis, employment data was most favorable in New York, which added 41,400 jobs, followed by Florida (+21,800), and then California (+21,100). A total of 81,700 jobs were lost across the 22 states, with Missouri reporting the steepest job losses at 22,400. In percentage terms, employment increased the highest in Vermont at 0.5%, while Missouri saw the biggest decline at 0.7% between June and July.

Year-over-year ending in July, 2.5 million jobs have been added to the labor market across all 50 states and the District of Columbia. The range of job gains spanned from 1,900 jobs in Wyoming to 284,400 jobs in California. In percentage terms, the range of job growth spanned 3.7% in South Carolina to 0.4% in Oregon.

Across the nation, construction sector jobs data[1]—which includes both residential and non-residential construction—showed that 29 states and the District of Columbia reported an increase in July compared to June, while 16 states lost construction sector jobs. The five remaining states reported no change on a month-over-month basis. Florida, with the highest increase, added 6,300 construction jobs, while New York, on the other end of the spectrum, lost 3,800 jobs. Overall, the construction industry added a net 25,000 jobs in July compared to the previous month. In percentage terms, Tennessee reported the highest increase at 3.3% and Arkansas reported the largest decline at 1.2%.

Year-over-year, construction sector jobs in the U.S. increased by 239,000, which is a 3.0% increase compared to the July 2023 level. Florida added 36,700 jobs, which was the largest gain of any state, while New York lost 8,100 construction sector jobs. In percentage terms, Alaska had the highest annual growth rate in the construction sector at 19.9%. Over this period, Maine reported the largest decline of 4.1%.

[1] For this analysis, BLS combined employment totals for mining, logging, and construction are treated as construction employment for the District of Columbia, Delaware, and Hawaii.

Discover more from Eye On Housing

Subscribe to get the latest posts sent to your email.


This article was originally published by a eyeonhousing.org . Read the Original article here. .

Pin It