Tag

Labor

Browsing


According to the U.S. Bureau of Labor Statistics (BLS), people who are neither working nor looking for work are counted as “not in the labor force”. Understanding the size and characteristics of individuals not in the labor force is crucial for a comprehensive assessment of the job market and overall economic health, as it provides insights into potential labor supply and demand issues.

Size

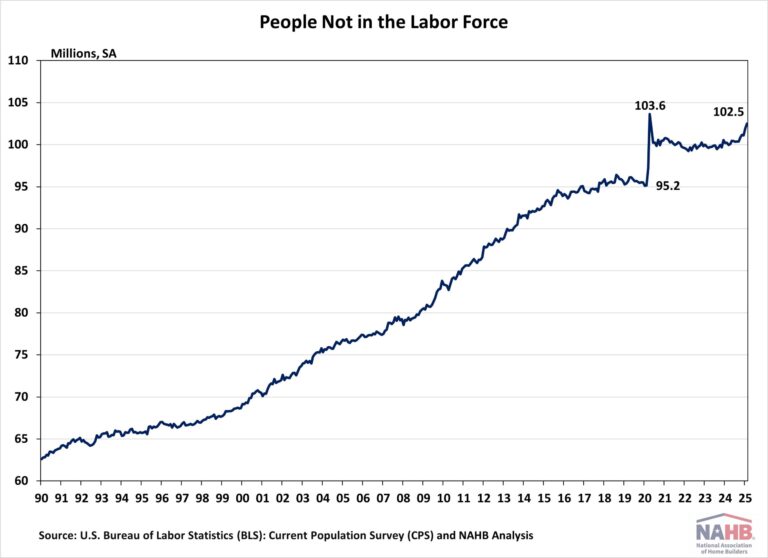
The number of people not in the labor force has been steadily increasing. As of February 2025, data from the BLS indicates that 102.5 million people, aged 16 or older, were not in the labor force. During the COVID-19 pandemic, this figure surged sharply, rising from 95.2 million in February 2020 to a historically high 103.6 million in April 2020. Since then, the number has remained around 100 million, with a noticeable upward trend over the past year.

Characteristics

Data from the 2024 Current Population Survey (CPS) and the Annual Social and Economic Supplement (ASEC) offer valuable insights into why individuals are not in the labor force. The ASEC gathers information on employment and unemployment experienced during the previous calendar year. The data used in this article focus on individuals aged 16 years and older who neither worked nor looked for a job in 2023.

According to the analysis of the data from the 2024 CPS and ASEC, approximately 93.6 million people aged 16 or older were not in the labor force in 2023. Among this group, nearly 39 million (42%) were men, and 54.6 million (58%) were women.

In terms of age distribution, about 49% of those not in the labor force were aged 65 years or older. Additionally, 13% were between the ages of 55 and 64, 21% were between the ages of 25 and 54, and the remaining 17% were aged 24 or younger. Intuitively, people aged 65 years and older represented the largest share of individuals who were not in the labor force.

Regarding educational attainment, 51% of individuals not in the labor force had a high school diploma or lower. Those with some college education made up 24%, while individuals with a bachelor’s degree or higher accounted for 25%.

The racial breakdown of those not in the labor force is as follows: 58.2 million were non-Hispanic white, 15.4 million were Hispanic, 11.7 million were Black, 5.9 million were Asian, and the remaining 2.5 million identified as other races.

Main Reason for Not Working

The group of people not in the labor force is diverse, and the reasons why individuals are not in the labor force vary widely.

In the CPS and ASEC data, the respondents were asked the main reason for not working. The reasons included: ill or disabled, retired, taking care of home or family, going to school, could not find work and other.

In 2023, a total of 93.6 million individuals aged 16 and older neither worked nor looked for work at any time during the year. Among this group, 48.6 million people reported retirement as their main reason for not working. Approximately 14.9 million individuals stated that they were attending school, while 14.7 million cited illness or disability as the main factor. Additionally, 12.7 million people indicated that taking care of home or family was the main reason for not working in 2023. Nearly 1.8 million individuals selected “other reasons,” and roughly 1.0 million cited “could not find work.”

Retirement is the main reason for not working for about half of the individuals not in the labor force in 2023. Among those aged 65 years and older, 91% of individuals in this group cited retirement as the main reason for not working. Overall, about 44% of individuals not in the labor force were due to the self-reported reason of retirement and aged 65 years and older. Individuals in this 44% share are unlikely to return to the labor force.

While an aging population is a major driver behind the growth of individuals not participating in the labor force, other reasons people give for not engaging in the workforce also play an important role.

For individuals aged 16 to 24, the majority cited going to school as the main reason not working in 2023. In other words, for those citing going to school, 87% were between the ages of 16 and 24. Overall, about 14% of the not-in-labor-force population was due to the self-reported reason of going to school and aged 16 to 24. This group is likely to enter the labor force after graduation, although younger individuals will likely replace them in education settings.

Prime-age workers, aged 25 to 54, historically represent a larger share of the labor force compared to other age groups. However, men and women in this age group have different reasons for not working in 2023. More than half of women (62%) reported taking care of home or family as the main reason for not working, while 48% of men cited illness or disability as their primary reason.

Among prime-age individuals, those with less education were more likely to be out of the labor force than their more educated counterparts. In 2023, 15% of prime-age men with a high school diploma or less were not in the labor force, compared to 10% of those with some college and 5% of those with a bachelor’s degree or higher. The trend was similar among prime-age women, with 33% of those with a high school diploma or less not in the labor force, compared to 20% of those with some college and 13% of those with a bachelor’s degree or more.

It is difficult to predict with certainty whether prime-age individuals currently not in the labor force will enter it. However, several factors could encourage individuals to enter or return to the labor market, including improved economic conditions, the availability of remote work, workplace policies, and retraining opportunities.

Last, based on the CPS and ASEC data, only a small proportion of the remaining population reported the main reasons for not working were that they could not find work and other reasons.

Conclusion

These numbers highlight both challenges and opportunities in expanding the labor force to support construction employment. According to the BLS’s monthly job report, approximately 6% of individuals currently not in the labor force and aged 16 to 64 could potentially be recruited into the workforce. Furthermore, the construction labor force is aging. The building industry must recruit the next generation of workers as industry activity grows in the years ahead, given the growth in population not in the labor force.

Discover more from Eye On Housing

Subscribe to get the latest posts sent to your email.


This article was originally published by a eyeonhousing.org . Read the Original article here. .

After a period of slowing associated with declines for some elements of the residential construction industry, the count of open construction sector jobs remained lower than a year ago, per the December Bureau of Labor Statistics Job Openings and Labor Turnover Survey (JOLTS).

The number of open jobs for the overall economy decreased from 8.16 million in November to 7.6 million in December. This is notably smaller than the 8.89 million estimate reported a year ago and reflects a softened aggregate labor market. Previous NAHB analysis indicated that this number had to fall below 8 million on a sustained basis for the Federal Reserve to feel more comfortable about labor market conditions and their potential impacts on inflation. With estimates remaining below 8 million for national job openings, the Fed in theory should be able to cut further despite a recent pause.

The number of open construction sector jobs decreased from a revised 272,000 in November to just 217,000 in December. This marks a significant reduction of open, unfilled construction jobs than that registered a year ago (434,000) due to a slowing of construction activity because of elevated interest rates.

The construction job openings rate moved lower to 2.5% in December, significantly down year-over-year from 5.1%. This is the lowest open rate for the construction sector since 2017.

The layoff rate in construction stayed low (1.8%) in December. The quits rate moved lower to 1.4% in December. This is the lowest quits rate for construction since the third quarter of 2020.

Discover more from Eye On Housing

Subscribe to get the latest posts sent to your email.


This article was originally published by a eyeonhousing.org . Read the Original article here. .


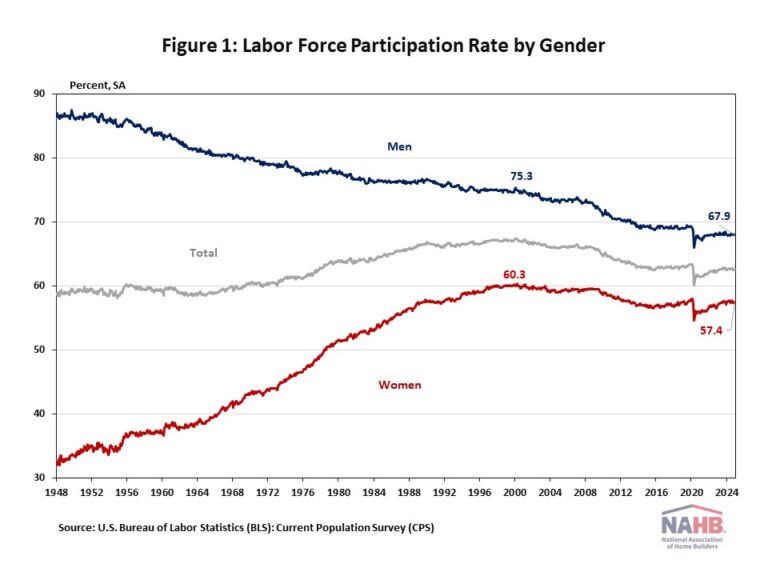
A key indicator of the labor market is the labor force participation rate. This rate is the percentage of working-age adults in a population who are working or looking for work. The rate is a critical measure connected to both housing demand and housing supply (via the construction labor force).

According to the Employment Situation Summary reported by the Bureau of Labor Statistics (BLS), the labor force participation rate remained at 62.5% for the third month in December 2024. After the labor force participation rate reached 67.3% at the beginning of 2000, it has been trending lower. When COVID-19 hit the labor market, the labor force participation rate dropped dramatically from 63.3% in February 2020 to 60.1% in April 2020. The latest labor force participation rate remains below its pre-pandemic levels of 63.3% at the beginning of 2020.

The participation rate is directly connected to the supply of labor. Labor supply varies across different demographic groups, such as age, gender, race, and educational attainment.

Gender

Over time, labor force participation changed dramatically by gender due to evolving societal norms around gender roles. Historically, women experienced a significant increase in labor force participation while men’s participation rates declined. However, over the past 20 years both genders’ labor force participation rates have moved in parallel and been trending downwards. Women’s labor force participation rate is 2.9 percentage points below the peak level in 2000 of 60.3%, while men’s labor force participation rate is 7.4 percentage points lower than the level in 2000 of 75.3%.

According to the latest data from the Current Population Survey (CPS), women currently make up roughly half of the U.S. labor force, representing about 47% of the labor force market. By industry, women accounted for more than half of all workers within several sectors in 2023, such as education and health services (74.4%), other services (53.3%), financial activities (51.1%), and leisure and hospitality (50.8%). Comparably, women were substantially underrepresented (relative to their share of total employment) in manufacturing (29.5%), agriculture (29.3%), transportation and utilities (24.3%), mining (15.3%), and construction (10.8%).

Men tend to have a higher labor force participation rate than women historically, even though this gap has narrowed from 54.7 percentage points in January 1948 to a difference of 10.5 percentage points in December 2024.

Age

The labor force participation rate differs across age groups as well. People ages 65 and older had the lowest labor force participation rate of 19.2%, followed by the youngest age group (16-19 years old) with a participation rate of 36.9%.

Among all age groups, workers aged 25-54, also known as prime-age workers, have the highest labor force participation rate of 83% in 2023. They form the core of the U.S. labor force, accounting for nearly two-thirds (63.8%) of the total labor force. Prime-age workers’ labor force participation rate has fully recovered from the COVID-19 pandemic, surpassing the prior peak of February 2020. The high labor force participation among prime-age men and the rapid increase in prime-age women’s labor force participation contributed to the increase in the labor force over time. By December 2024, prime-age women’s participation rate had hovered near its highest level of 78.1% on record, and 89.0% of prime-age men stayed in the labor force market.

Race and Ethnicity

Labor force participation varies among the largest race and ethnic groups living in the United States, and each group’s labor participation differs according to their gender as well.

Men had a higher labor force participation rate than women in each racial and ethnic group. Among men ages 16 years and over, Hispanic men were the most likely to be in the labor force, with a participation rate of 75.1%, followed by Asian men (76.8%), White men (68.2%), and Black men (65.6%). Among women ages 16 and over, Black women (61.0%) were most likely to participate in the labor force, followed by Hispanic women (58.7%), Asian women (58.1%), and White women (56.5%).

Educational Attainment

Higher levels of educational attainment are generally associated with higher labor force participation rates and lower unemployment rates. It is true for both men and women, and the four selected racial and ethnic groups that people with higher educational attainment tend to have greater employment opportunities and potentially later retirement ages.

With the same level of educational attainment, men are more likely to work than women. Among men with less than a high school diploma, the labor force participation rate was 59.4%, compared to a 34.3% participation rate for women with the same level of educational attainment. The gap of the labor force participation rate between men and women narrows as people achieve higher educational attainment. Women with the highest broad level of education (a bachelor’s degree or higher) have a 69.6% participation rate, a 7.3 percentage point difference from men with the same level of education (76.9%).

Discover more from Eye On Housing

Subscribe to get the latest posts sent to your email.


This article was originally published by a eyeonhousing.org . Read the Original article here. .

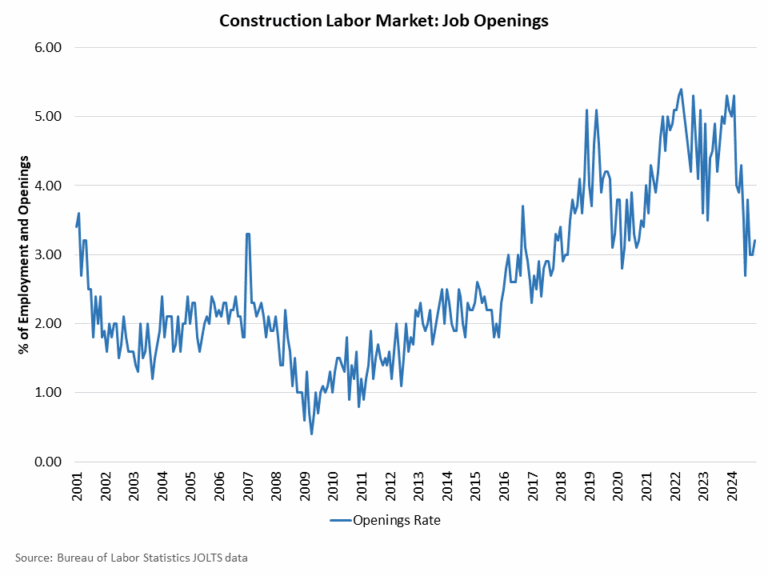
After a period of slowing associated with declines for some elements of the residential construction industry, the count of open construction sector jobs has remained lower than a year ago, per the November Bureau of Labor Statistics’ Job Openings and Labor Turnover Survey (JOLTS). However, the most recent data showed a slight gain for the number of open construction sector jobs.

The number of open jobs for the overall economy increased from 7.84 million to 8.10 million in November. Nonetheless, this is notably smaller than the 8.93 million estimate reported a year ago and reflects a softened aggregate labor market. Previous NAHB analysis indicated that this number had to fall below 8 million on a sustained basis for the Federal Reserve to feel more comfortable about labor market conditions and their potential impacts on inflation. With estimates remaining below 8 million for national job openings, the Fed is continuing a policy of interest rate cuts.

The number of open construction sector jobs increased from a revised 259,000 in October to 276,000 in November. Nonetheless, the November reading of opening, unfilled construction jobs is lower than that registered a year ago (454,000) due to a slowing of construction activity because of elevated interest rates.

The construction job openings rate edged higher to 3.2% in November but remains lower than a year ago, albeit with a fair amount of statistical month-to-month noise in the recent data.

The layoff rate in construction remained in the 2% range in November (2.1%). The quits rate in construction fell to 1.7% in November.

Discover more from Eye On Housing

Subscribe to get the latest posts sent to your email.


This article was originally published by a eyeonhousing.org . Read the Original article here. .

After a period of slowing associated with declines for some elements of the residential construction industry, the count of open construction sector jobs trended lower in the October data, per the Bureau of Labor Statistics’ Job Openings and Labor Turnover Survey (JOLTS). The data indicates the demand for construction labor market remains weaker than a year ago.

In contrast, after revisions, the number of open jobs for the overall economy increased from 7.37 million to 7.74 million in October. Nonetheless, this is notably smaller than the 8.69 million estimate reported a year ago and is a sign of a softening aggregate labor market. Previous NAHB analysis indicated that this number had to fall below 8 million on a sustained basis for the Federal Reserve to feel more comfortable about labor market conditions and their potential impacts on inflation. With estimates remaining below 8 million for national job openings, the Fed is underway easing credit conditions.

The number of open construction sector jobs fell from a revised 258,000 in September to a softer 249,000 in October. Elements of the construction sector slowed in prior months as tight Fed policy persisted. The October reading of opening, unfilled construction jobs is lower than that registered a year ago: 413,000.

The construction job openings rate fell back to 2.9% in October and continues to trend lower, albeit with a fair amount of statistical month-to-month noise in the recent data.

The layoff rate in construction moved lower to 1.2% in October after a 2% rate in September. This was the lowest layoff rate for construction in the data series (going back to late 2000). The quits rate in construction increased to 1.9% in October.

Discover more from Eye On Housing

Subscribe to get the latest posts sent to your email.


This article was originally published by a eyeonhousing.org . Read the Original article here. .


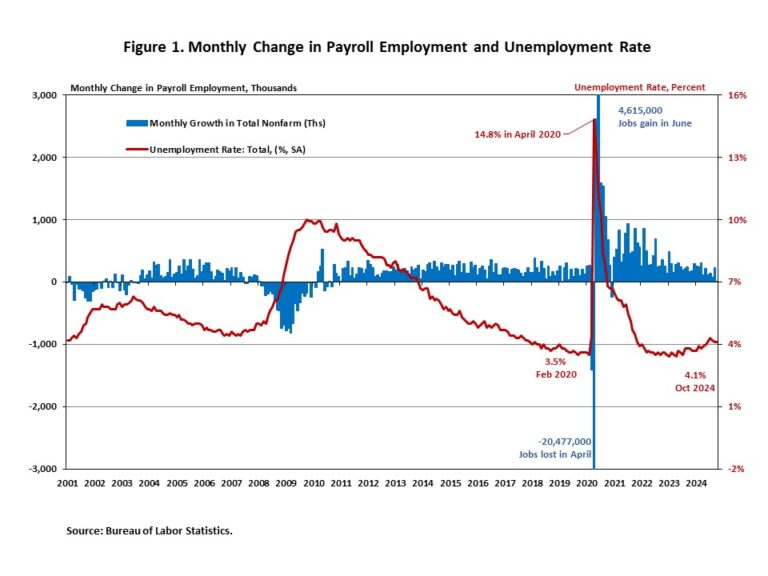
Job growth decelerated significantly in October, driven by the effects of strikes and hurricanes. As stated in this month’s job report, October data are “the first collected since Hurricanes Helene and Milton struck the United States”. Despite lower monthly job gains, the unemployment rate held steady at 4.1%, indicating the labor market remains solid.

In October, wage growth remained unchanged. Wages grew at a 4.0% year-over-year (YOY) growth rate, down 0.3 percentage points from a year ago. Wage growth is outpacing inflation, which typically occurs as productivity increases.

National Employment

According to the Employment Situation Summary reported by the Bureau of Labor Statistics (BLS), total nonfarm payroll employment rose by 12,000 in October, down sharply from a downwardly revised increase of 223,000 jobs in September, marking the smallest monthly job gain in years. The estimates for the previous two months were revised lower. The monthly change in total nonfarm payroll employment for August was revised down by 81,000, from +159,000 to +78,000, while the change for September was revised down by 31,000 from +254,000 to +223,000. Combined, the revisions were 112,000 lower than previously reported.

In the first ten months of 2024, 1,701,000 jobs were created. Additionally, monthly employment growth averaged 170,000 per month, compared to the 251,000 monthly average gain for 2023. The Fed’s easing cycle began on September 18, marking the end of a period of restrictive monetary policy. The U.S. economy has created about 8 million jobs since March 2022, when the Fed enacted the first interest rate hike of this cycle.

The unemployment rate was unchanged at 4.1% in October. While the number of employed persons decreased by 368,000, the number of unemployed persons rose by 150,000.

Meanwhile, the labor force participation rate—the proportion of the population either looking for a job or already holding a job—decreased by one percentage point to 62.6%. However, for people aged between 25 and 54, the participation rate declined for the third straight month to 83.5%. This rate still exceeds the pre-pandemic level of 83.1%. Meanwhile, the overall labor force participation rate remains below its pre-pandemic levels of 63.3% at the beginning of 2020.

In October, employment continued to trend up in health care (+52,000) and government (+40,000). Temporary help for business and professional services lost 49,000 jobs. Manufacturing employment fell by 46,000 in October. The BLS noted that a decline of 44,000 in transportation equipment manufacturing was “largely due to strike activity.”

Construction Employment

Employment in the overall construction sector increased by 8,000 in October, after 27,000 gains in September. While residential construction shed 5,300 jobs, non-residential construction employment added 13,500 jobs for the month.

Residential construction employment now stands at 3.4 million in October, broken down as 957,000 builders and 2.4 million residential specialty trade contractors. The 6-month moving average of job gains for residential construction was 3,000 a month. Over the last 12 months, home builders and remodelers added 44,500 jobs on a net basis. Since the low point following the Great Recession, residential construction has gained 1,388,200 positions.

In October, the unemployment rate for construction workers rose to 5.3% on a seasonally adjusted basis. The unemployment rate for construction workers has remained at a relatively lower level, after reaching 15.3% in April 2020 due to the housing demand impact of the COVID-19 pandemic.

Discover more from Eye On Housing

Subscribe to get the latest posts sent to your email.


This article was originally published by a eyeonhousing.org . Read the Original article here. .

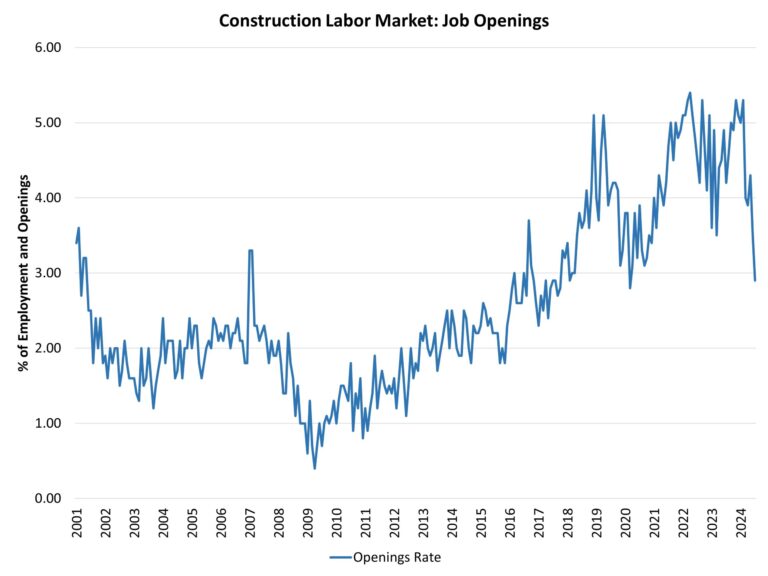
Due to slowing home construction and elevated interest rates, the count of open construction sector jobs continued to decline in July, per the Bureau of Labor Statistics’ Job Openings and Labor Turnover Survey (JOLTS). However, this shift lower is also consistent with a cooler overall labor market, which is a positive sign for future inflation readings and the interest rate outlook.

In July, after revisions, the number of open jobs for the overall economy decreased slightly from 7.91 million to 7.67 million. This is notably smaller than the 8.81 million estimate reported a year ago. Previous NAHB analysis indicated that this number had to fall below 8 million on a sustained basis for the Federal Reserve to feel more comfortable about labor market conditions and their potential impacts on inflation. With estimates now measurably below 8 million, interest rate cuts from the Federal Reserve are at hand (Indeed, the yield curve reversed its inversion for the first time since June 2022 today, although this reversion can also be a bond market signal for some concern for future macro data).

As the Fed eases monetary policy, the demand for new construction will expand. Thus, a reversal for the current soft readings for construction labor will occur in the quarters ahead. This means the underlying skilled labor shortage is likely to persist during the coming years.

In July, the number of open construction sector jobs shifted notably lower from 299,000 in June to 248,000. Elements of the construction sector have slowed as elevated interest rates held, most notably multifamily development. This slowing has somewhat reduced demand for construction workers, lowering the job opening count for the construction industry. The open job count was 351,000 a year ago.

The construction job openings rate fell to 2.9% in July, the lowest rate since March 2020. The job openings rate has trended lower as the number of single-family and multifamily residences under construction has declined. This is a cyclical effect that will likely reverse later in 2025.

The layoff rate in construction increased to 2.1% in July from 1.3% in June as the labor market slows. The quits rate in construction increased to 2.1% in July from 1.6% in June. The rise in the layoff rate is consistent with a slowing construction labor market.

Discover more from Eye On Housing

Subscribe to get the latest posts sent to your email.


This article was originally published by a eyeonhousing.org . Read the Original article here. .

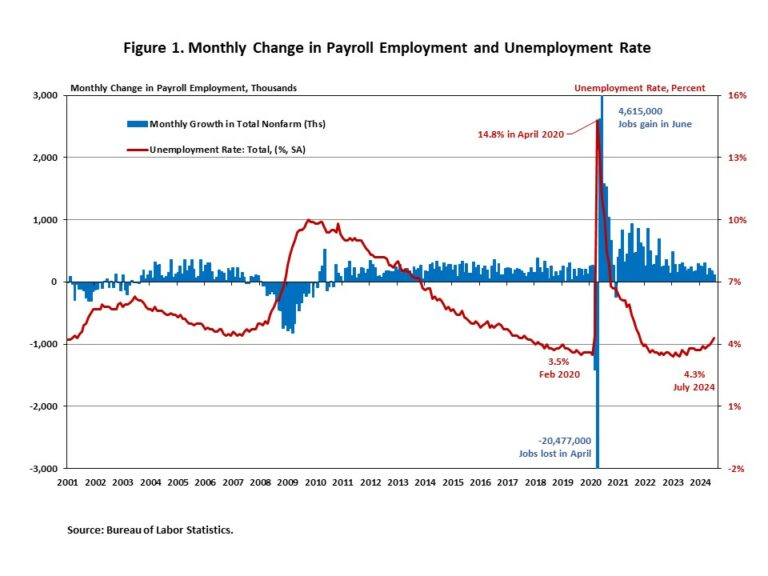
In July, job growth decelerated significantly, and the unemployment rate increased to a nearly three-year high of 4.3%. The July data indicates that the labor market is slowing, which signals monetary policy easing in the months ahead.

Additionally, wage growth slowed for the second month in a row. In July, wages grew at a 3.6% year-over-year (YOY) growth rate, down 1.0 percentage point from a year ago. This marks the lowest YOY wage gain in the past four years.

Total nonfarm payroll employment increased by 114,000 in July, following a downwardly revised increase of 179,000 jobs in June, as reported in the Employment Situation Summary. The estimates for the previous two months were revised down. The monthly change in total nonfarm payroll employment for May was revised down by 2,000, from +218,000 to +216,000, while the change for June was revised down by 27,000 from +206,000 to +179,000. Combined, the revisions were 29,000 lower than the original estimates.

Despite restrictive monetary policy, nearly 7.8 million jobs have been created since March 2022, when the Fed enacted the first interest rate hike of this cycle. In the first seven months of 2024, 1,419,000 jobs were created. Additionally, monthly employment growth averaged 203,000 per month, compared with the 251,000 monthly average gain for 2023.

In July, the unemployment rate rose for the fourth straight month to 4.3%, the highest rate since October 2021. The number of unemployed persons rose by 352,000, while the number of employed persons was barely changed.

Meanwhile, the labor force participation rate, the proportion of the population either looking for a job or already holding a job, rose 1.0 percentage point to 62.7% for July. Moreover, the labor force participation rate for people aged between 25 and 54 ticked up to 84.0%, the highest level since March 2001. While the overall labor force participation rate is still below its pre-pandemic levels at the beginning of 2020, the rate for people aged between 25 and 54 exceeds the pre-pandemic level of 83.1%.

For industry sectors, health care (+55,000), construction (+25,000), and transportation and warehousing (+14,000) have notable job gains in July, while information employment lost 20,000 jobs.

Employment in the overall construction sector increased by 25,000 in July, after 20,000 gains in June. While residential construction gained 9,100 jobs, non-residential construction employment added 16,200 jobs for the month.

Residential construction employment now stands at 3.4 million in July, broken down as 950,000 builders and 2.4 million residential specialty trade contractors. The 6-month moving average of job gains for residential construction was 6,067 a month. Over the last 12 months, home builders and remodelers added 67,600 jobs on a net basis. Since the low point following the Great Recession, residential construction has gained 1,387,400 positions.

In July, the unemployment rate for construction workers rose to 4.4% on a seasonally adjusted basis. The unemployment rate for construction workers remained at a relatively lower level, after reaching 15.3% in April 2020, due to the housing demand impact of the COVID-19 pandemic.

Discover more from Eye On Housing

Subscribe to get the latest posts sent to your email.


This article was originally published by a eyeonhousing.org . Read the Original article here. .
Pin It