Tag

Jobs

Browsing


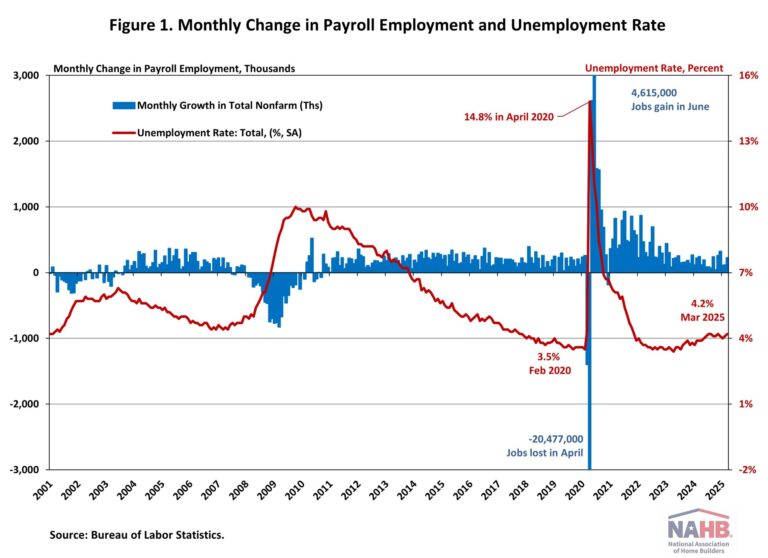
The U.S. job market unexpectedly accelerated in March, while the figures for January and February were revised downward substantially. The unemployment rate ticked up slightly to 4.2% in March, from 4.1% the previous month. This month’s jobs report highlights the continued resilience of the labor market despite sticky inflation, a drop in consumer confidence, mass federal government layoffs, and growing economic uncertainty.

Noticeably, residential construction employment has shown signs of weakness in recent months. In March, the six-month moving average of job gains for residential construction turned negative for the first time since August 2020. It reflects three significant drops in employment: 8,400 jobs in October 2024, 6,700 jobs in January 2025, and 9,800 jobs in March 2025. Additionally, the construction job openings rate has returned to 2019 levels, driven by a slowdown in construction activity.

In March, wage growth slowed. Year-over-year, wages grew at a 3.8% rate, down 0.3 percentage points from a year ago. Wage growth has been outpacing inflation for nearly two years, which typically occurs as productivity increases.

National Employment

According to the Employment Situation Summary reported by the Bureau of Labor Statistics (BLS), total nonfarm payroll employment rose by 228,000 in March, following a downwardly revised increase of 117,000 jobs in February. Since January 2021, the U.S. job market has added jobs for 51 consecutive months, making it the third-longest period of employment expansion on record.

The estimates for the previous two months were revised down. The monthly change in total nonfarm payroll employment for January was revised down by 14,000 from +125,000 to +111,000, while the change for February was revised down by 34,000 from +151,000 to +117,000. Combined, the revisions were 48,000 lower than previously reported.

The unemployment rate rose to 4.2% in March. While the number of employed persons increased by 201,000, the number of unemployed persons increased by 31,000.

Meanwhile, the labor force participation rate—the proportion of the population either looking for a job or already holding a job—rose one percentage point to 62.5%. For people aged between 25 and 54, the participation rate decreased two percentage points to 83.3%. While the overall labor force participation rate remains below its pre-pandemic levels of 63.3% at the beginning of 2020, the rate for people aged between 25 and 54 has been trending down since it peaked at 83.9% last summer.

In March, employment rose in health care (+54,000), social assistance (+24,000), and transportation and warehousing (+23,000). Employment in retail trade also added 24,000 jobs in March, partially reflecting the return of workers from a strike. However, within the government sector, federal government employment saw a decline of 4,000, following a loss of 11,000 jobs in February. The BLS notes that “employees on paid leave or receiving ongoing severance pay are counted as employed in the establishment survey.”

Construction Employment

Employment in the overall construction sector increased by 13,000 in March, following a gain of 14,000 in February. While residential construction saw a decline of 9,800 jobs, non-residential construction employment added 22,300 jobs for the month.

Residential construction employment now stands at 3.4 million in March, broken down as 958,000 builders and 2.4 million residential specialty trade contractors. The six-month moving average of job gains for residential construction was -2,883 a month, mainly reflecting the three months’ job loss over the past six months (October 2024, January 2025 and March 2025). Over the last 12 months, home builders and remodelers added 14,000 jobs on a net basis. Since the low point following the Great Recession, residential construction has gained 1,367,600 positions.

In March, the unemployment rate for construction workers declined to 4.3% on a seasonally adjusted basis. The unemployment rate for construction workers has remained at a relatively lower level, after reaching 15.3% in April 2020 due to the housing demand impact of the COVID-19 pandemic.

Discover more from Eye On Housing

Subscribe to get the latest posts sent to your email.


This article was originally published by a eyeonhousing.org . Read the Original article here. .

The residential construction industry plays a crucial role in driving economic growth and local community development. It has a lasting impact on local communities by creating jobs, improving infrastructure, boosting local businesses, and enhancing property values.

The residential construction industry is more reliant on labor than capital in the United States. As of October 2024, about 3.4 million people work in the residential construction industry in the United States, with 957,000 builders and 2.4 million residential specialty trade contractors.

The NAHB analysis of the Quarterly Census of Employment and Wages (QCEW) data provides an insight into employment and establishment concentration of the residential construction industry across metro areas (MSA).

Location quotients (LQ) are ratios that compare the concentration of the residential construction industry within a metro area to the concentration of the industry nationwide. LQs are used in this article to evaluate the employment and establishment concentration of the residential construction industry in local areas.  

Employment

The March 2024 QCEW data indicates that employment in the residential construction industry, while found throughout the country, was more highly concentrated in some metro areas than others.

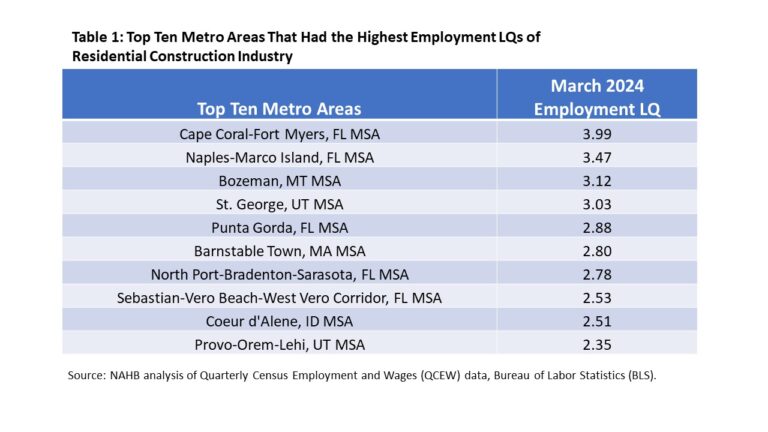
Among 387 metro areas, employment LQs ranged from 0.02 to 3.99. Cape Coral-Fort Myers, FL had the highest employment concentration of the residential construction industry with an LQ of 3.99. It was followed by Naples-Marco Island, FL (LQ: 3.47) and Bozeman, MT (LQ: 3.12).

Florida, experiencing a rapid growth in population, reported a relatively high employment concentration in residential construction. All metro areas in Florida had a higher employment concentration than the nation’s concentration. Moreover, half of the top ten metro areas with the highest employment concentrations of the residential construction industry were in Florida.

Various metro areas in the Mountain Division also have a high reliance on the residential construction industry for employment. Bozeman, MT (LQ: 3.12), St. George, UT (LQ: 3.03), Coeur d’Alene, ID (LQ: 2.51), and Provo-Orem-Lehi, UT (LQ: 2.35) were ranked in the top ten markets with a higher employment concentration of the residential construction industry.

Metro areas in the South reported the three lowest employment LQs of the residential construction industry. The lowest was Owensboro, KY with a LQ of 0.02, followed by Dalton, GA (LQ: 0.03) and Eagle Pass, TX (LQ: 0.05).

Establishment

On aggregate, New York-Newark-Jersey City, NY-NJ, Los Angeles-Long Beach-Anaheim, CA, and Miami-Fort Lauderdale-West Palm Beach, FL were the three metro areas that not only had the most employment in residential construction but also had the largest number of residential construction establishments among all metro areas. However, these three metro areas didn’t have higher establishment concentrations of the residential construction industry than the nation.

Among all the 387 metro areas, 104 of them had a higher establishment concentration of the residential construction industry than the nation. St. George, UT had the highest establishment concentration of the residential construction industry, which was more than three times that of the nation, followed by Barnstable Town, MA (LS: 2.42) and Cape Coral-Fort Myers, FL (LQ: 2.38).

The three metro areas in the South that reported the lowest employment LQs of the residential construction industry also had the lowest establishment LQs of the residential construction industry.

For more information on QCEW, please check the “Handbook of Methods” published by BLS.

Discover more from Eye On Housing

Subscribe to get the latest posts sent to your email.


This article was originally published by a eyeonhousing.org . Read the Original article here. .

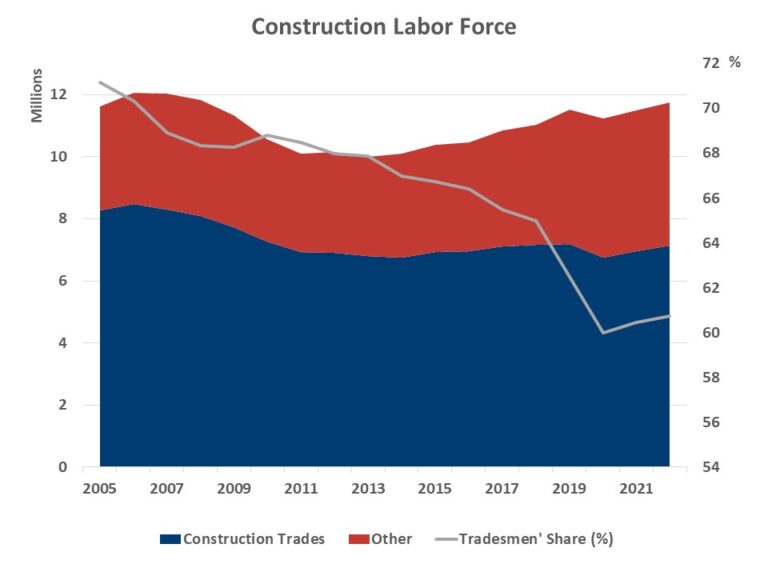
Analysis of the history of data from the American Community Survey (ACS) reveals dramatic shifts in the makeup of the construction labor force over the last two decades. While the overall count of workers in the industry now approaches the historic highs of the housing boom of 2005-2006, the share of tradesmen declined from 71% in 2005 to under 61% in 2022. At the same time, the share of computer, engineering, and science occupations doubled, and the share of management and business occupations increased 60%.

The results are noteworthy, particularly given a recent focus on relatively flat productivity growth in the construction sector. A growing count of engineering/tech workers would, on its face, suggest a boost to productivity. However, a decline for the share of workers associated with the trades could suggest declining productivity. Indeed, more workers in management and business occupations could be another impact of the rising regulatory burden associated with building. These findings and possible impacts deserve additional research attention given the need to supply more attainable housing to the market.

As of 2022, the construction labor force exceeds 11.7 million, just slightly below the housing boom peak of 12 million. Construction trades (such as carpenters, electricians, painters, plumbers, laborers, as well as first-line supervisors) account for 7.1 million workers in the industry, or 60.7%. In contrast, there were 8.5 million construction tradesmen during the peak employment of 2006. The disappearance of more than a million craftsmen helps explain the persistent labor shortages reported by the NAHB/Wells Fargo Housing Market Index Survey.

Over the same period, the construction industry absorbed a rising number of white-collar workers. The management ranks expanded from 1.2 million to 1.9 million workers, and their share increased from 10% to 16%. Business and financial occupations grew at similar rates. The number of engineers, architects and other science occupations doubled; they now account for close to 2.7% of the industry workforce. In contrast, the share of computer, engineering and science occupations was just 1.3% in 2005.

Even though the prevalence of white-collar jobs in construction remains less common than in the US economy overall, their numbers and shares have been rising faster in construction since 2005. For example, while the share of computer, engineering, and science occupations doubled in construction, it increased only 40% in the overall US workforce. Similarly, whereas the management ranks increased 60% in construction, they grew at a slower rate for the US labor force and registered gains of 45% since 2005.

The rising presence of white-collar workers in construction undoubtedly reflects evolving production technologies, an enhanced regulatory environment and more stringent building codes. The changing makeup of the construction workforce also coincides with the declining rates of self-employment in the industry and may reflect a shift towards larger construction firms. Larger building enterprises are better equipped to invest into new technologies and absorb higher overhead costs.

The labor force statistics reported in the post are tabulated using the historic ACS Public Use Microdata Sample (PUMS). The ACS statistics are most comprehensive as they include payroll workers, as well as self-employed. As the common practice dictates, the labor force estimates count employed and those unemployed workers who look for jobs.

Discover more from Eye On Housing

Subscribe to get the latest posts sent to your email.


This article was originally published by a eyeonhousing.org . Read the Original article here. .

The labor market may not be as strong as previously estimated, according to the Bureau of Labor Statistics’ preliminary estimate of the upcoming annual benchmark revision to the establishment survey employment series. Each year, the Current Employment Statistics (CES) survey employment estimates are benchmarked to full population counts of employment for the month of March. It improves the accuracy of the CES all-employee series and provides an early look at adjustments to employment data.

According to the preliminary estimate of the benchmark revision, total payroll employment for the period from April 2023 to March 2024 (12 months) was lowered by 818,000, about 0.5% less than previously estimated. If the final benchmark revision is not far off the preliminary one, this preliminary estimate of the upcoming annual benchmark revision would be the largest downward revision since March of 2009 (the 2009 revision was a reduction of 902,000 estimated jobs).

Additionally, while the CES data show that 2.9 million jobs were added from April 2023 to March 2024, the preliminary estimate of the benchmark revision suggests that job growth was overstated by about 40%. On a monthly basis, there were about 68,000 fewer jobs on average in the 12-month period through March 2024.

Among major industry sectors, five sectors saw an upward revision in employment, led by private education and health services (+87,000) and transportation and warehousing (+56,400). Meanwhile, professional and business services had the largest downward revision of 358,000 jobs, followed by leisure and hospitality shedding 150,000 jobs.

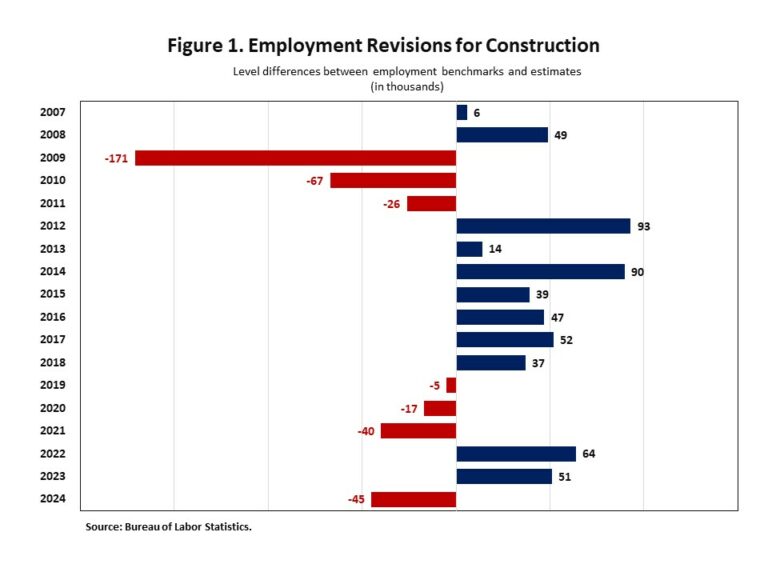
Closer to housing, construction employment was revised down by 45,000, 0.6% less than the initially reported 8.2 million jobs in place. The average monthly job gains for the construction sector were revised down by 17% to 18,000 jobs in the 12-month period through March 2024.

Figure 1 shows the level difference between revised employment data and previous estimates for the construction sector from 2007 to 2024. The red bars mark the downward revisions, while the blue bars present the upward revisions. From top to bottom, there are three consecutive red bars from 2009 to 2011, another three red bars from 2019 to 2021, and the last one in 2024.

During the period of the 2008 recession and the COVID-19 pandemic, construction employment was overestimated for three straight years, respectively. The current preliminary benchmark revision for the construction sector is the largest downward revision since March 2010.

Note: The existing employment data will not be updated with the release of the preliminary benchmark estimate. The data for all CES series will be updated when the final benchmark revision is issued in February 2025.

Discover more from Eye On Housing

Subscribe to get the latest posts sent to your email.


This article was originally published by a eyeonhousing.org . Read the Original article here. .
Pin It