Tag

January

Browsing


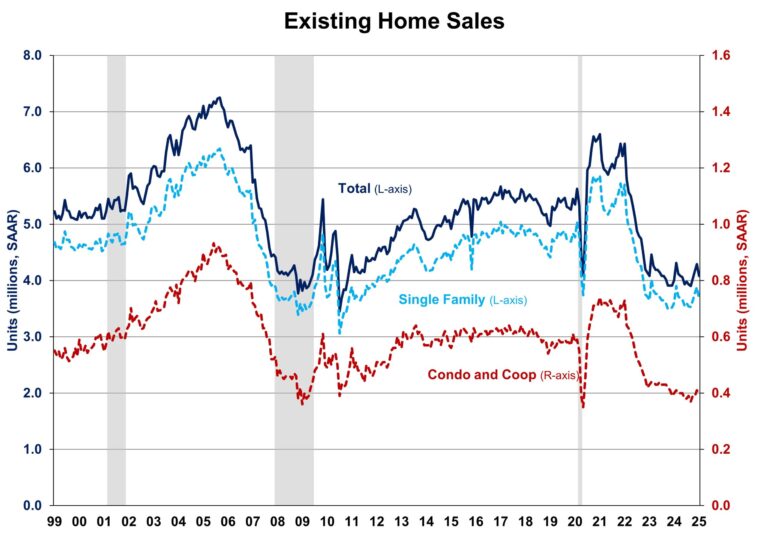
After three months of increases, existing home sales retreated in January from the 10-month high last month, according to the National Association of Realtors (NAR). Sales continued to be suppressed by higher mortgage rates, which remained above 6.5% despite the Fed cutting rates by 100 basis points last year. The persistent high mortgage rates largely reflect policy uncertainty and concerns about future economic growth.

While existing home inventory improves and the Fed continues lowering rates, the market faces headwinds as mortgage rates are expected to stay above 6% for longer due to an anticipated slower easing pace in 2025. The prolonged rates may continue to discourage homeowners from trading existing mortgages for new ones with higher rates, keeping supply tight and prices elevated. As such, sales are likely to remain limited in the coming months due to elevated mortgage rates and home prices.

Total existing home sales, including single-family homes, townhomes, condominiums, and co-ops, fell 4.9% to a seasonally adjusted annual rate of 4.08 million in January. On a year-over-year basis, sales were 2.0% higher than a year ago. This marks the fourth consecutive month of annual increases.

The first-time buyer share was 28% in January, down from 31% in December but unchanged from January 2024.

The existing home inventory level rose from 1.14 million in December to 1.18 million units in January and is up 16.8% from a year ago. At the current sales rate, January unsold inventory sits at a 3.5-months’ supply, up from 3.2-months last month and 3.0-months a year ago. This inventory level remains low compared to balanced market conditions (4.5 to 6 months’ supply) and illustrates the long-run need for more home construction.

Homes stayed on the market for an average of 41 days in January, up from 35 days in December and 36 days in January 2024.

The January all-cash sales share was 29% of transactions, up from 28% in December 2024 but down from 32% in January 2024. All-cash buyers are less affected by changes in interest rates.

The January median sales price of all existing homes was $396,900, up 4.8% from last year. This marked the 19th consecutive month of year-over-year increases. The median condominium/co-op price in December was up 2.9% from a year ago at $349,500. This rate of price growth will slow as inventory increases.

Geographically, three of the four regions saw a decline in existing home sales in January, ranging from 5.7% in the Northeast to 7.4% in the West. Sales in the Midwest remained unchanged. On a year-over-year basis, sales grew in three regions, ranging from 1.4% in the West to 5.3% in the Midwest. Sales were unchanged in the South from a year ago.

The Pending Home Sales Index (PHSI) is a forward-looking indicator based on signed contracts. The PHSI fell from 78.5 to 74.2 in December due to elevated mortgage rates. This marks the first decline since August 2024. On a year-over-year basis, pending sales were 5.0% lower than a year ago, per National Association of Realtors data.

Discover more from Eye On Housing

Subscribe to get the latest posts sent to your email.


This article was originally published by a eyeonhousing.org . Read the Original article here. .

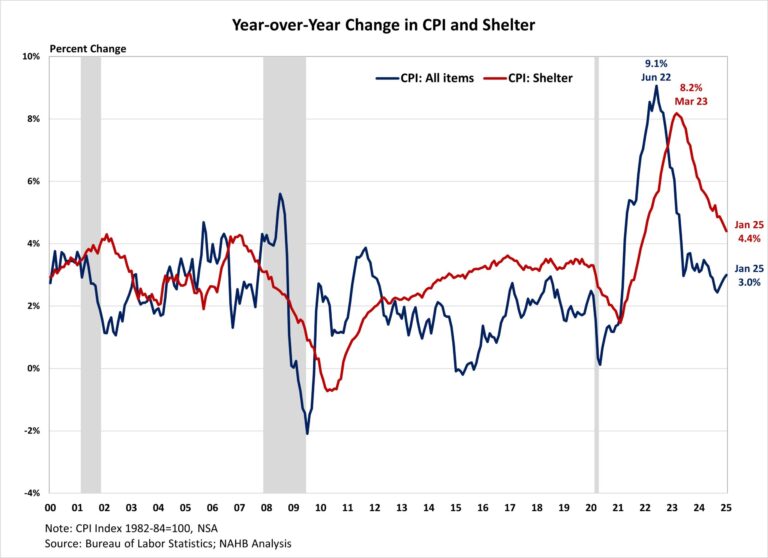
Inflation edged up to a six-month high in January and showed little progress from a year ago. The persistent inflation rate indicates the last mile to the Fed’s 2% target continues to be challenging and is consistent with the Fed’s cautious stance amid solid economic growth and growing uncertainty. While core inflation remained stubborn due to elevated shelter and other service costs, housing costs showed signs of cooling – the year-over-year change in the shelter index remained below 5% for a fifth straight month and posted its lowest annual gain since January 2022, suggesting a continued moderation in housing inflation.

While the Fed’s interest rate cuts could help ease some pressure on the housing market, its ability to address rising housing costs is limited, as these increases are driven by a lack of affordable supply and increasing development costs. In fact, tight monetary policy hurts housing supply because it increases the cost of AD&C financing. This can be seen on the graph below, as shelter costs continue to rise at an elevated pace despite Fed policy tightening. Additional housing supply is the primary solution to tame housing inflation.

Furthermore, the election result has put inflation back in the spotlight and added additional upside and downside risks to the economic outlook. Proposed tax cuts and tariffs could increase inflationary pressures, suggesting a more gradual easing cycle with a slightly higher terminal federal funds rate. However, economic growth could also be higher with lower regulatory burdens. Given the housing market’s sensitivity to interest rates, a higher inflation path could extend the affordability crisis and constrain housing supply as builders continue to grapple with lingering supply chain challenges.

During the past twelve months, on a non-seasonally adjusted basis, the Consumer Price Index rose by 3.0% in January, according to the Bureau of Labor Statistics’ report. This followed a 2.9% year-over-year increase in December. Excluding the volatile food and energy components, the “core” CPI increased by 3.3% over the past twelve months, following a 3.2% increase in December. The “core” CPI has held near 3.3% since May 2024. A large portion of the “core” CPI is the housing shelter index, which increased 4.4% over the year, following a 4.6% increase in December.  Meanwhile, the component index of food rose by 2.5%, and the energy component index increased by 1.0%.

On a monthly basis, the CPI rose by 0.5% in January (seasonally-adjusted), after a 0.4% increase in December. The “core” CPI increased by 0.4% in January, the highest monthly gain since March 2024.

The price index for a broad set of energy sources rose by 1.1% in January, with increases in gasoline (+1.8%), fuel oil (+6.2%), and natural gas (+1.8%), while the electricity index remained flat. Meanwhile, the food index rose 0.4%, after a 0.3% increase in December. The index for food away from home increased by 0.2% and the index for food at home rose by 0.5%.

The index for shelter (+0.4%) was the largest contributor to the monthly increase in all items index, accounting for nearly 30% of the total increase. Other top contributors that rose in January include indexes for motor vehicle insurance (+2.0%), recreation (+1.0%), as well as used cars and trucks, (+2.2%). Meanwhile, the index for apparel (-1.4%), personal care (-0.1%) and household furnishings (-0.2%) and operations were among the few major indexes that decreased over the month.

The index for shelter makes up more than 40% of the “core” CPI, rose by 0.4% in January, following an increase of 0.3% in December. Both indexes for owners’ equivalent rent (OER) and rent of primary residence (RPR) increased by 0.3% over the month. Despite the moderation, shelter costs remained the largest contributors to headline inflation. 

NAHB constructs a “real” rent index to indicate whether inflation in rents is faster or slower than core inflation. It provides insight into the supply and demand conditions for rental housing. When inflation in rents is rising faster than core inflation, the real rent index rises and vice versa. The real rent index is calculated by dividing the price index for rent by the core CPI (to exclude the volatile food and energy components).

In January, the Real Rent Index fell by 0.1%. This marks the first time since December 2021 that rental prices grew slowly than core inflation.

Discover more from Eye On Housing

Subscribe to get the latest posts sent to your email.


This article was originally published by a eyeonhousing.org . Read the Original article here. .

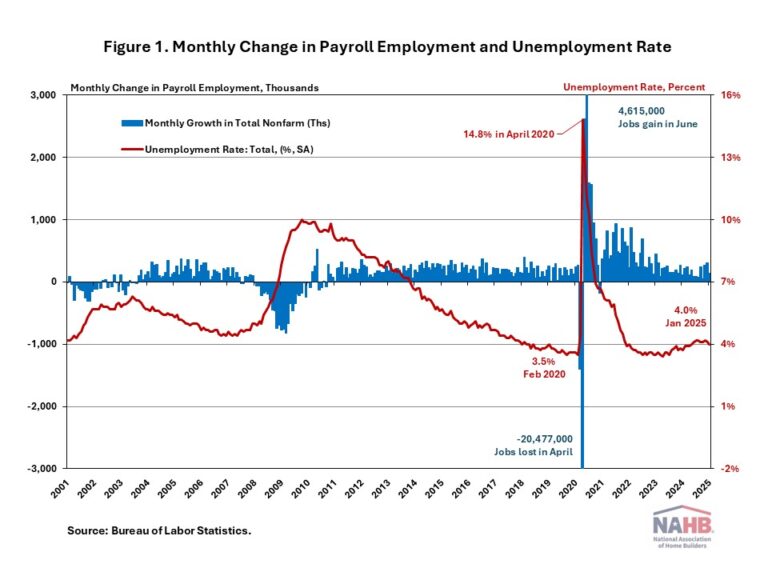
U.S. job growth slowed in January amid Southern California wildfires and severe winter weather across much of the country. Meanwhile, the unemployment rate edged down to 4.0%. This month’s data indicates that the labor market is slowing at the start of 2025 but remains healthy.

In January, wage growth remained unchanged from the previous month. Year-over-year, wages grew at a 4.1% rate, down 0.2 percentage points from a year ago. Wage growth is outpacing inflation, which typically occurs as productivity increases.

On the annual benchmark revision of the Current Employment Statistics (CES), the seasonally adjusted total nonfarm employment for March 2024 was revised down by 589,000. The average monthly pace of job growth for 2024 was revised down from a previous estimate of 186,000 per month to an average of 166,000.

National Employment

According to the Employment Situation Summary reported by the Bureau of Labor Statistics (BLS), total nonfarm payroll employment rose by 143,000 in January, the lowest monthly gain in the past three months. Since January 2021, the U.S. job market has added jobs for 49 consecutive months, making it the third-longest period of employment expansion on record.

The estimates for the previous two months were revised up. The monthly change in total nonfarm payroll employment for November was revised up by 49,000, from +212,000 to +261,000, while the change for December was revised up by 51,000 from +256,000 to +307,000. Combined, the revisions were 100,000 higher than previously reported.

The unemployment rate decreased to 4.0% in January, after accounting for the annual adjustments to the population controls. While the number of employed persons increased by 2,234,000, the number of unemployed persons decreased by 37,000.

Meanwhile, the labor force participation rate—the proportion of the population either looking for a job or already holding a job—increased one percentage point to 62.6%. For people aged between 25 and 54, the participation rate rose one percentage point to 83.5%. While the overall labor force participation rate remains below its pre-pandemic levels of 63.3% at the beginning of 2020, the rate for people aged between 25 and 54 exceeds the pre-pandemic level of 83.1%.

In January, employment in health care (+44,000), retail trade (+34,000), and social assistance (+22,000) increased, while employment declined in the mining, quarrying, and oil and gas extraction industries.

Construction Employment

Employment in the overall construction sector increased by 4,000 in January, after 13,000 gains in December. While residential construction lost 200 jobs, non-residential construction employment added 4,400 jobs for the month.

Residential construction employment now stands at 3.4 million in January, broken down as 956,000 builders and 2.4 million residential specialty trade contractors. The 6-month moving average of job gains for residential construction was 1,350 a month. Over the last 12 months, home builders and remodelers added 40,100 jobs on a net basis. Since the low point following the Great Recession, residential construction has gained 1,376,600 positions.

The unemployment rate for construction workers has remained at a relatively lower level, after reaching 15.3% in April 2020 due to the housing demand impact of the COVID-19 pandemic.

Discover more from Eye On Housing

Subscribe to get the latest posts sent to your email.


This article was originally published by a eyeonhousing.org . Read the Original article here. .


The Market Composite Index, a measure of mortgage loan application volume from the Mortgage Bankers Association’s (MBA) weekly survey, increased by 3.1% month-over-month on a seasonally adjusted (SA) basis, primarily driven by purchasing activity. Compared to January last year, the index is higher by 3.4%. The Market Composite Index which includes the Purchase and Refinance Indices: purchasing experienced a monthly gain of 3.8%, while refinancing decreased 2.3% (SA). On a year-over-year basis, however, the Purchase Index is lower by 3.4%, while the Refinance Index remains higher at 18.6%.

The average 30-year fixed rate mortgage reported in the MBA survey for January ticked up 20 basis points (bps) to 7.02% (index level 702). This rate is 24 basis points higher than the same period last year.

Average loan size (purchases and refinances combined) increased slightly by 0.8% on a non-seasonally adjusted (NSA) basis from December to $373,200. For purchase loans, the average size increased by 1.8% to $429,400, while refinance loans experienced a 5.4% decrease, reaching an average of $288,200. Adjustable-rate mortgages (ARMs) saw a continued decline in average loan size for three consecutive months, down 0.6% from $1.074 million to $1.068 million.

Discover more from Eye On Housing

Subscribe to get the latest posts sent to your email.


This article was originally published by a eyeonhousing.org . Read the Original article here. .

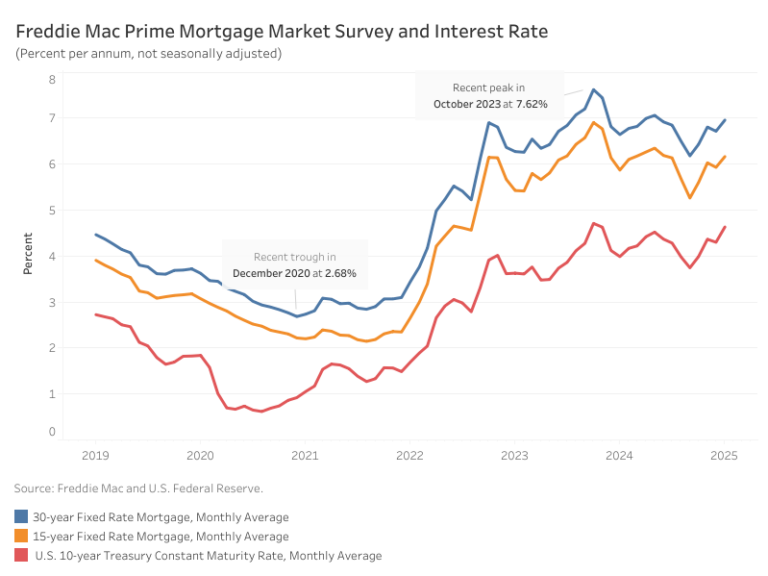
Mortgage rates edged higher in January, with the average 30-year fixed-rate mortgage reaching 6.96%. Rates had been climbing steadily since mid-December—even surpassing 7%—before easing in recent weeks as the bond market stabilized following news that President Donald Trump postponed tariffs plans to February 1.

According to Freddie Mac, the average rate for a 30-year fixed-rate mortgage rose 24 basis points (bps) from December, extending a two-year trend of fluctuations between 6% and 7%. Meanwhile, the 15-year fixed-rate mortgage increased 23 bps to land at 6.13%.

The 10-year Treasury yield, a key benchmark for mortgage rates, averaged 4.63% in November—33 basis points higher than December’s average. A strong economy, coupled with ongoing uncertainty over inflation due to tax cuts and tariffs, continues to put upward pressure on yields. This uncertainty is also reflected in the increased range for the projected 2025 core PCE inflation in the December FOMC economic projections, now estimated between 2.1% and 3.2%, compared to a narrower 2.1% to 2.5% range in September.

Discover more from Eye On Housing

Subscribe to get the latest posts sent to your email.


This article was originally published by a eyeonhousing.org . Read the Original article here. .
Pin It