Tag

Interest

Browsing


Total outstanding U.S. consumer credit stood at $5.15 trillion for the fourth quarter of 2024, increasing at an annualized rate of 4.22% (seasonally adjusted), according to the Federal Reserve’s G.19 Consumer Credit Report. This is an uptick from the third quarter of 2024’s rate of 2.47%. 

The G.19 report excludes mortgage loans, so the data primarily reflects consumer credit in the form of student loans, auto loans, and credit card plans. As consumer spending has outpaced personal income, savings rates have been declining, and consumer credit has increased. Previously, consumer credit growth had slowed, as high inflation and rising interest rates led people to reduce their borrowing. However, in the last two quarters, growth rates have increased, reflecting the rate cuts that took place at the end of the third quarter.  

Nonrevolving Credit  

Nonrevolving credit, largely driven by student and auto loans, reached $3.76 trillion (SA) in the fourth quarter of 2024, marking a 3.11% increase at a seasonally adjusted annual rate (SAAR). This is an uptick from last quarter’s rate of 2.28%, and the highest in two years.  

Student loan debt balances stood at $1.78 trillion (NSA) for the fourth quarter of 2024. Year-over-year, student loan debt rose 2.77%, the largest yearly increase since the second quarter of 2021. This shift partially reflects the expiration of the COVID-19 Emergency Relief for student loans’ 0-interest payment pause that ended September 1, 2023. 

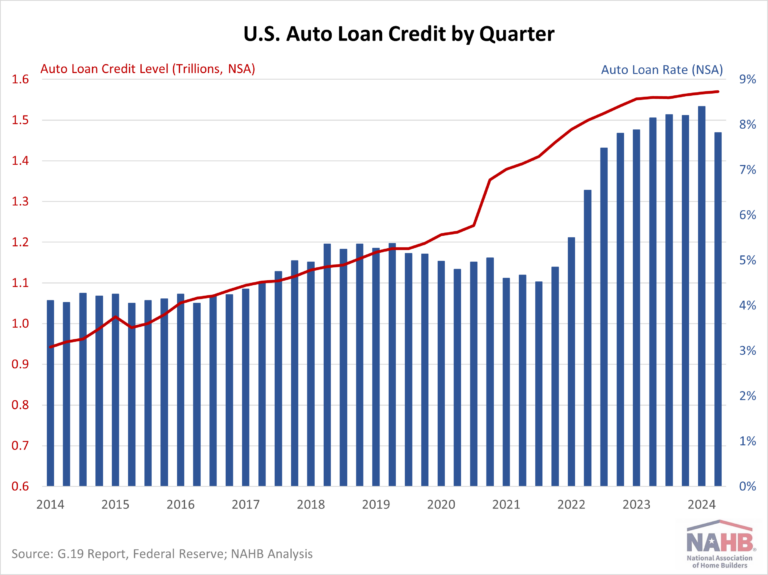
Auto loans reached a total of $1.57 trillion, showing a year-over-year increase of only 0.93%. This marks the second slowest growth rate since 2010, slightly above last quarter’s rate of 0.91%. The deceleration in growth can be attributed to several factors, including stricter lending standards, elevated interest rates, and overall inflation. Although interest rates for 5-year new car loans fell to 7.82% in the fourth quarter from a high of 8.40% in the third quarter, they remain at their highest levels in over a decade. 

Revolving Credit 

Revolving credit, primarily credit card debt, reached $1.38 trillion (SA) in the fourth quarter, rising at an annualized rate of 7.34%. This marked a significant increase from the third quarter’s 3.01% rate but was notably down from the peak growth rate of 17.58% seen in the first quarter of 2022. The surge in credit card balances in early 2022 was accompanied by an increase in the credit card rate which climbed by 4.51 percentage points over 2022. This was an exceptionally steep increase, as no other year in the past two decades had seen a rate jump of more than two percentage points.  

Comparatively, so far in 2024 the credit card rate decreased 0.12 percentage points. For the fourth quarter of 2024, the average credit card rate held by commercial banks (NSA) was 21.47%. 

Discover more from Eye On Housing

Subscribe to get the latest posts sent to your email.


This article was originally published by a eyeonhousing.org . Read the Original article here. .


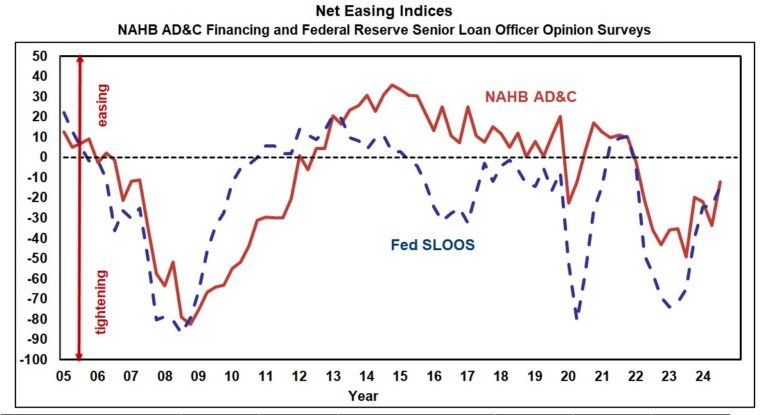
In the third quarter of 2024, borrowers and lenders agreed, as they have over most of the past three years, that credit for residential Land Acquisition, Development & Construction (AD&C) tightened. On the borrower’s side, the net easing index from NAHB’s survey on AD&C Financing posted a reading of -12.0 (the negative number indicates credit was tighter than in the previous quarter). On the lender’s side, the comparable net easing index based on the Federal Reserve’s survey of senior loan officers posted a similar reading of -14.8.  Although the additional net tightening was relatively mild in the third quarter (as indicated by negative numbers that were smaller, in absolute terms, than they had been at any time since 2022 Q1), both surveys indicate that credit has tightened for eleven consecutive quarters—so credit for AD&C must now be significantly tighter than it was in 2021.   

According to  NAHB’s survey, the most common ways in which lenders tightened in the third quarter were by lowering the loan-to-value (or loan-to-cost) ratio, and requiring personal guarantees or collateral not related to the project—each reported by 61% of builders and developers. After those two, reducing the amount lenders are willing to lend was in the third place, with 56%.

Additional information from the Fed’s survey of lenders—including measures of demand and net easing for residential mortgages—is discussed in an earlier post.

Although the availability of credit for residential AD&C was tighter in the third quarter, builders and developers finally got some relief from the elevated cost of credit that has prevailed recently. In the third quarter, the contract interest rate decreased on all four categories of AD&C loans tracked in the NAHB survey. The average rate declined from 9.28% in 2024 Q2 to 8.50% on loans for land acquisition, from 9.05% to 8.83% on loans for land development, from 8.98% to 8.54% on loans for speculative single-family construction, and from 8.55% to 8.11% on loans for pre-sold single-family construction.

More detail on credit conditions for builders and developers is available on NAHB’s AD&C Financing Survey web page.

Discover more from Eye On Housing

Subscribe to get the latest posts sent to your email.


This article was originally published by a eyeonhousing.org . Read the Original article here. .


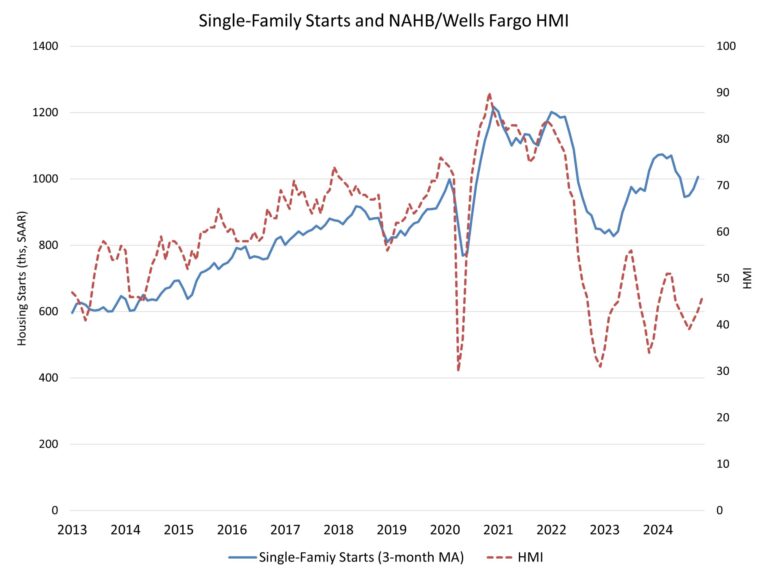
Housing starts edged lower last month as average monthly mortgage rates increased a quarter-point from 6.18% to 6.43% between September and October, according to Freddie Mac.

Overall housing starts decreased 3.1% in October to a seasonally adjusted annual rate of 1.31 million units, according to a report from the U.S. Department of Housing and Urban Development and the U.S. Census Bureau.

The October reading of 1.31 million starts is the number of housing units builders would begin if development kept this pace for the next 12 months. Within this overall number, single-family starts decreased 6.9% to a 970,000 seasonally adjusted annual rate. On a year-to-date basis, single-family construction is up 9.3%. The volatile multifamily sector, which includes apartment buildings and condos, increased 9.6% to an annualized 341,000 pace but are down 29.3% on a year-to-date basis.

Although housing starts declined in October, builder sentiment improved for a third straight month in November as builders anticipate an improved regulatory environment in 2025 that will allow the industry to increase housing supply. Further interest rate cuts from the Federal Reserve through 2025 should result in lower interest rates for construction and development loans, helping to lead to a stabilization for apartment construction and expansion for single-family home building.

While multifamily starts increased in October, the number of apartments under construction is down to 821,000, the lowest count since March 2022 and down 18.9% from a year ago. In October, there were 1.8 apartments that completed construction for every one apartment that started construction. The three-month moving average reached a ratio of 2 in October.

There were 644,000 single-family homes under construction in October, down 3.6% from a year ago and down 22% from the peak count in the Spring of 2022.

On a regional and year-to-date basis, combined single-family and multifamily starts are 10.4% higher in the Northeast, 1.7% lower in the Midwest, 5.0% lower in the South due to hurricane effects, and 4.4% lower in the West.

Overall permits decreased 0.6% to a 1.42 million unit annualized rate in October. Single-family permits increased 0.5% to a 968,000 unit rate and are up 9.4% on a year-to-date basis. Multifamily permits decreased 3.0% to an annualized 448,000 pace.

Looking at regional data on a year-to-date basis, permits are 0.9% higher in the Northeast, 3.9% higher in the Midwest, 2.4% lower in the South and 4.8% lower in the West.

Discover more from Eye On Housing

Subscribe to get the latest posts sent to your email.


This article was originally published by a eyeonhousing.org . Read the Original article here. .


Since the passage of the Tax Cuts and Jobs Act (TCJA) in 2017, tax returns that itemize Schedule A deductions, such as the mortgage interest deduction (MID) , have fallen significantly with only 9.6% of all returns using an itemized deduction in tax year 2021. In 2017, the share of returns claiming an itemized deduction was 30.9%. Taxpayers who do not itemize their tax returns claim the standard deduction instead, and thus do not directly benefit from deductions such as the MID.

Looking across different adjusted gross income — or AGI, which is a measure of total income minus adjustments, such as deductions — levels , the prevalence of itemizing has fallen for all AGI levels. In 2017, five AGI levels had over half of tax returns claiming an itemized deduction. In contrast, in 2021 (the latest published IRS Statistics of Income data) only the two highest AGI levels had over half of returns claiming an itemize deduction.

The TCJA significantly increased the standard deduction and placed a limit of $10,000 on the state and local income tax (SALT) deduction . These two factors contributed to the trend of fewer itemized returns since 2017. Moreover, these changes explain why the use of the mortgage interest deduction has grown less progressive since 2017. Namely, the mortgage interest deduction can only be claimed through itemizing. So fewer itemizing taxpayers has led to fewer home owners utilizing the mortgage interest deduction, particularly at lower AGI levels.

Standard Deduction vs. Itemized Deduction

The total number of returns filed in 2021 was 159.5 million, while the number of returns with itemized deductions stood at just 14.8 million returns. These returns totaled an estimated $659.7 billion in itemized deductions. The total amount of the standard deduction claimed stood at an estimated $2.5 trillion in 2021 — well above the itemization amount, as significantly more taxpayers utilized the standard deduction.

Depicted in the graph above, there is a distinctive difference between the share of returns in a particular AGI level and its proportion of the total adjusted gross income. Levels below $100,000 constitute 77.2% of all returns, but only make up 30.9% of the total adjusted gross income. Levels above $100,000 constitute 22.8% of all returns while making up 69.1% of the total adjusted gross income.

Among returns that utilized the itemized deduction, most fell in the $100,000-$200,000 AGI class, with 30.4% claiming itemized returns. Despite this, the $1 million AGI level make up 29.6% of the total itemization deduction amount — the highest level of deduction amounts — but only constituted 4.1% of itemized returns.

In contrast to the itemized tax returns, most tax returns claiming the standard deductions were in the lower AGI range between $1-100,000 (75.3%). This AGI range also received the highest share of the total standard deduction amount (75.4%). The standard deduction return distribution follows more closely to that of all returns when compared to itemized returns as far fewer taxpayers utilize itemized deductions and those who do tend to be in higher income groups.

Mortgage Interest Deduction

After the passage of the 16th amendment, the first income tax code written by Congress allowed for the deduction of interest paid on many debts ranging from business to personal debts, including mortgages. The mortgage interest deduction notably expanded following World War II. Homeownership became an important wealth building tool for a vast majority of Americans during this period.

The current principal limit of the mortgage interest deduction stands at $750,000 ($375,000 if married filing separately), meaning taxpayers can deduct interest on the first $750,000 of debt secured by the taxpayer’s main home or second home . Interest on home equity loans and lines of credit are deductible only if the funds are used to buy, build or substantially improve a taxpayer’s home up to a $100,000 limit.

After the expiration of the 2017 tax rules in 2025, the mortgage interest deduction will return to prior law, in which the principal limit was $1 million, and home owners will be allowed to deduct interest on the first $100,000 of home equity debt regardless of the purpose of the debt. (However, AMT rules complicate this general rule somewhat.) It is important to note that the current principal limit is not indexed for inflation, which is a policy shortcoming given the post-COVID rise in home prices.

Among tax returns that were itemized in 2021, 11.5 million (76.6%) claimed the mortgage interest deduction. The total amount of mortgage interest deducted was $143.5 billion, which includes points. (If debt predates 2017, deduction is allowed for points) According to the Bureau of Economic Analysis, total mortgage interest paid in 2021 — deducted and non-deducted together — was $458.2 billion , which amounts to around 31.3% of total mortgage interest payments claimed as a tax deduction in 2021.

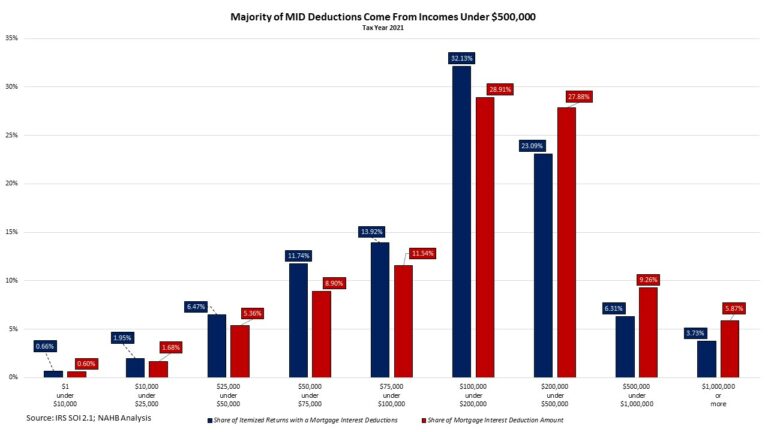
Across income groups, the group with the highest mortgage interest deduction  amount was for incomes between $100,000-$200,000 at a 28.9% share of the total. The $200,000-$500,000 income group deducted the second largest share at 27.9%. Nonetheless, the vast majority (84.9%) of mortgage interest deducted was from itemizers with incomes under $500,000.

Given that it is much more likely for itemizers to be from higher income groups, specifically AGI levels greater than $500,000, it is perhaps surprising that most of the mortgage interest deduction claimed accrued to individuals making less than $500,000 as these taxpayers typically use itemized deductions less frequently.

Proposal to Expand the Mortgage Tax Benefit: A Tax Credit

In 2021, there were an estimated 83.4 million owner-occupied housing units with 51.1 million holding a mortgage. A housing tax credit would allow vastly more households to receive a tax benefit from owning a home than, as only approximately 11 million currently do by deducting mortgage interest on their tax returns.

With fewer taxpayers itemizing, what was once an effective and broadly claimed tax incentive no longer serves its original purpose to make homeownership more affordable for the middle-class. NAHB believes the mortgage interest deduction should be updated to reflect today’s tax code and better serve the segment of prospective home owners who face unprecedented affordability challenges. A well-structured housing tax incentive, such as a mortgage interest credit, would help achieve this policy goal.

NAHB supports converting the mortgage interest deduction into a targeted, ongoing homeownership tax credit, which could be claimed against mortgage interest and property taxes paid. A tax credit that is properly targeted would increase progressivity in the tax code and promote housing opportunity by providing a tax incentive more accessible to lower and middle-class households, as well minority and first-generation home buyers. Such a credit would provide a benefit to all home owners who pay mortgage interest and have income tax liability to offset. Such a proposal should be considered today and given serious consideration during the 2025 tax debate.

Discover more from Eye On Housing

Subscribe to get the latest posts sent to your email.


This article was originally published by a eyeonhousing.org . Read the Original article here. .

Pin It