Tag

housing

Browsing


With the end of 2024 approaching, NAHB’s Eye on Housing is reviewing the posts that attracted the most readers over the last year. In February, Na Zhao shared the latest data on ages of homeowners as well as when their homes were built. 

The median age of owner-occupied homes is 40 years old, according to the latest data from the 2022 American Community Survey[1]. The U.S. owner-occupied housing stock is aging rapidly especially after the Great Recession, as the residential construction continues to fall behind in the number of new homes built. New home construction faces headwinds such as rising material costs, labor shortage, and elevated interest rates nowadays.

With a lack of sufficient supply of new construction, the aging housing stock signals a growing remodeling market, as old structures need to add new amenities or repair/replace old components. Rising home prices also encourage homeowners to spend more on home improvement. Over the long run, the aging of the housing stock implies that remodeling may grow faster than new construction.

New construction added nearly 1.7 million units to the national stock from 2020  to 2022, accounting for only 2% of owner-occupied housing stock in 2022. Relatively newer owner-occupied homes built between 2010 and 2019 took up around 9%.  Owner-occupied homes constructed between 2000 and 2009 make up 15% of the housing stock. The majority, or around 60%, of the owner-occupied homes were built before 1980, with around 35% built before 1970.

Due to modest supply of housing construction, the share of new construction built within the past 12 years declined greatly, from 17% in 2012 to only 11% in 2022. Meanwhile, the share of housing stock that is at least 53 years old experienced a significant increase over the 10 years ago. The share in 2022 was 35% compared to 29% in 2012.

[1] : Census Bureau did not release the standard 2020 1-year American Community Survey (ACS) due to the data collection disruptions experienced during the COVID-19 pandemic. The data quality issues for some topics remain in the experimental estimates of the 2020 data. To be cautious, the 2020 experimental data is not included in the analysis.

Discover more from Eye On Housing

Subscribe to get the latest posts sent to your email.


This article was originally published by a eyeonhousing.org . Read the Original article here. .


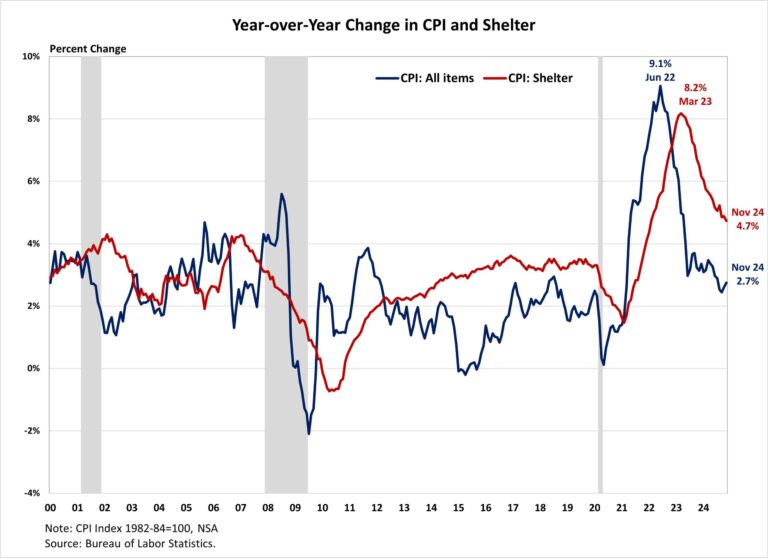
Inflation picked up to 2.7% in November, while matching expectations, the last mile to the Fed’s 2% target proves to be the most challenging. Shelter costs continued to be the main driver of inflation, contributing nearly 40% of the monthly increase. However, the year-over-year change in the shelter index remained below 5% for a third straight month and posted its lowest annual gain since February 2022, suggesting moderation in housing inflation.

While the Fed’s interest rate cuts could help ease some pressure on the housing market, its ability to address rising housing costs is limited, as these increases are driven by a lack of affordable supply and increasing development costs. In fact, tight monetary policy hurts housing supply because it increases the cost of AD&C financing. This can be seen on the graph below, as shelter costs continue to rise at an elevated pace despite Fed policy tightening. Additional housing supply is the primary solution to tame housing inflation.

Furthermore, the election result has put inflation back in the spotlight and added some downside risks to the economic outlook. Proposed tax cuts and tariffs could increase inflationary pressures, suggesting a more gradual easing cycle with a slightly higher terminal federal funds rate. Given the housing market’s sensitivity to interest rates, this could extend affordability crisis and constrain housing supply as builders continue to grapple with lingering supply chain challenges.

During the past twelve months, on a non-seasonally adjusted basis, the Consumer Price Index (CPI) rose by 2.7% in November, according to the Bureau of Labor Statistics’ report. This followed a 2.6% year-over-year increase in October. Excluding the volatile food and energy components, the “core” CPI increased by 3.3% over the past twelve months, the same increase as in the previous two months. The component index of food rose by 2.4%, while the energy component index fell by 3.2%.

On a monthly basis, the CPI rose by 0.3% in November on a seasonally adjusted basis, after a 0.2% increase in October. The “core” CPI increased by 0.3% in November, the same increase as in the past three months.

The price index for a broad set of energy sources rose by 0.2% in November, with declines in electricity (-0.4%) offset by increases in gasoline (+0.6%), natural gas (+1.0%) and fuel oil (+0.6%). Meanwhile, the food index rose 0.4%, after a 0.2% increase in October. The index for food away from home increased by 0.3% and the index for food at home rose by 0.5%.

The index for shelter (+0.3%) was the largest contributor to the monthly increase in all items index, accounting for nearly 40% of the total increase. Other top contributors that rose in November include indexes for used cars and trucks (+2.0%), household furnishings and operations (+0.6%), medical care (+0.3%) and new vehicles (+0.6%). Meanwhile, the index for communication (-1.0%) was among the few major indexes that decreased over the month.

The index for shelter makes up more than 40% of the “core” CPI, rose by 0.3% in November after a 0.4% in October. Both indexes for owners’ equivalent rent (OER) and rent of primary residence (RPR) increased by 0.2% over the month. For the rent index, it was the smallest monthly increase since April 2021 and July 2021. Despite the moderation, shelter costs remained the largest contributors to headline inflation. 

NAHB constructs a “real” rent index to indicate whether inflation in rents is faster or slower than overall inflation. It provides insight into the supply and demand conditions for rental housing. When inflation in rents is rising faster than overall inflation, the real rent index rises and vice versa. The real rent index is calculated by dividing the price index for rent by the core CPI (to exclude the volatile food and energy components).

In November, the Real Rent Index fell by 0.1%, marking its first negative reading since December 2021. Over the first eleven months of 2024, the monthly growth rate of the Real Rent Index averaged 0.1%, slower than the average of 0.2% in 2023.

Discover more from Eye On Housing

Subscribe to get the latest posts sent to your email.


This article was originally published by a eyeonhousing.org . Read the Original article here. .


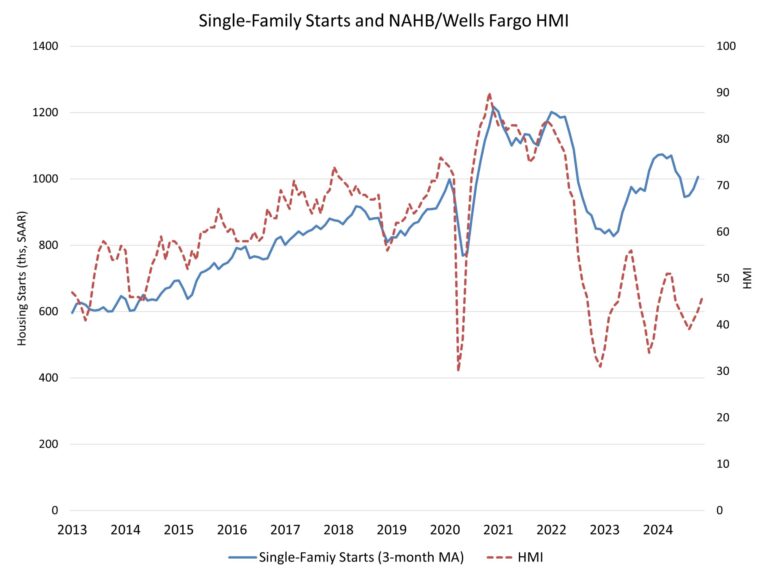
Housing starts edged lower last month as average monthly mortgage rates increased a quarter-point from 6.18% to 6.43% between September and October, according to Freddie Mac.

Overall housing starts decreased 3.1% in October to a seasonally adjusted annual rate of 1.31 million units, according to a report from the U.S. Department of Housing and Urban Development and the U.S. Census Bureau.

The October reading of 1.31 million starts is the number of housing units builders would begin if development kept this pace for the next 12 months. Within this overall number, single-family starts decreased 6.9% to a 970,000 seasonally adjusted annual rate. On a year-to-date basis, single-family construction is up 9.3%. The volatile multifamily sector, which includes apartment buildings and condos, increased 9.6% to an annualized 341,000 pace but are down 29.3% on a year-to-date basis.

Although housing starts declined in October, builder sentiment improved for a third straight month in November as builders anticipate an improved regulatory environment in 2025 that will allow the industry to increase housing supply. Further interest rate cuts from the Federal Reserve through 2025 should result in lower interest rates for construction and development loans, helping to lead to a stabilization for apartment construction and expansion for single-family home building.

While multifamily starts increased in October, the number of apartments under construction is down to 821,000, the lowest count since March 2022 and down 18.9% from a year ago. In October, there were 1.8 apartments that completed construction for every one apartment that started construction. The three-month moving average reached a ratio of 2 in October.

There were 644,000 single-family homes under construction in October, down 3.6% from a year ago and down 22% from the peak count in the Spring of 2022.

On a regional and year-to-date basis, combined single-family and multifamily starts are 10.4% higher in the Northeast, 1.7% lower in the Midwest, 5.0% lower in the South due to hurricane effects, and 4.4% lower in the West.

Overall permits decreased 0.6% to a 1.42 million unit annualized rate in October. Single-family permits increased 0.5% to a 968,000 unit rate and are up 9.4% on a year-to-date basis. Multifamily permits decreased 3.0% to an annualized 448,000 pace.

Looking at regional data on a year-to-date basis, permits are 0.9% higher in the Northeast, 3.9% higher in the Midwest, 2.4% lower in the South and 4.8% lower in the West.

Discover more from Eye On Housing

Subscribe to get the latest posts sent to your email.


This article was originally published by a eyeonhousing.org . Read the Original article here. .


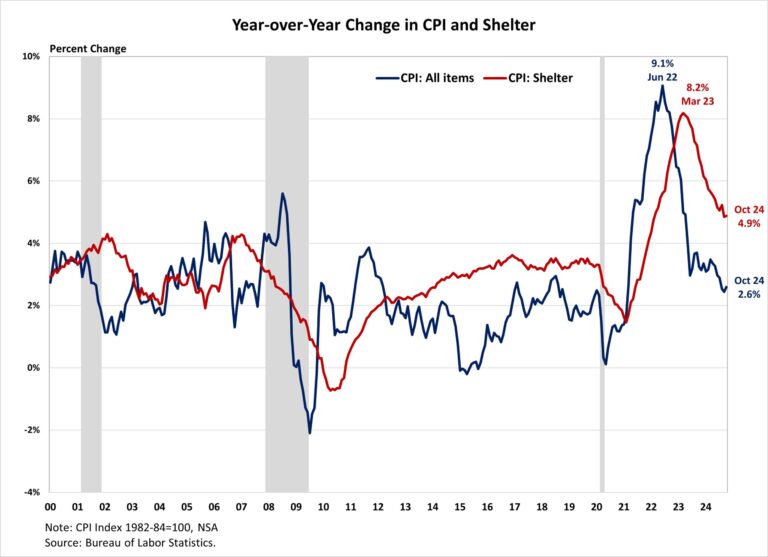
Inflation picked up again in October, showing the last mile to the 2% target will be the hardest. Shelter costs remained the main driver of inflation, accounting for over 65% of the 12-month increase in the all items less food and energy index. However, the year-over-year change in the shelter index has been below 5% for the second consecutive month, signaling some moderation in housing inflation.

While the Fed’s interest rate cuts could help ease some pressure on the housing market, its ability to address rising housing costs is limited, as these increases are driven by a lack of affordable supply and increasing development costs. In fact, tight monetary policy hurts housing supply because it increases the cost of AD&C financing. This can be seen on the graph below, as shelter costs continue to rise at an elevated pace despite Fed policy tightening. Additional housing supply is the primary solution to tame housing inflation.

Furthermore, the 2024 election result has put inflation back in the spotlight and added some downside risks to the economic outlook. Proposed tax cuts and tariffs could increase inflationary pressures, suggesting a more gradual easing cycle with a slightly higher terminal federal funds rate. Given the housing market’s sensitivity to interest rates, this could extend affordability crisis and constrain housing supply as builders continue to grapple with lingering supply chain challenges.

The Bureau of Labor Statistics reported that the Consumer Price Index (CPI) rose by 0.2% in October on a seasonally adjusted basis, the same increase seen over the previous three months. Excluding the volatile food and energy components, the “core” CPI increased by 0.3% in October, the same increase as in August and September.

The price index for a broad set of energy sources remained unchanged in October, with declines in gasoline (-0.9%) and fuel oil (-4.6%) offset by increases in electricity (+1.2%) and natural gas (+0.3%). Meanwhile, the food index rose 0.2%, after a 0.4% increase in September. The index for food away from home increased by 0.2% and the index for food at home rose by 0.1%.

The index for shelter (+0.4%) was the largest contributor to the monthly increase in all items index, accounting for over 50% of the total increase. Other top contributors that rose in October include indexes for used cars and trucks (+2.7%), airline fares (+3.2%), medical care (+0.3%) and recreation (+0.4%). Meanwhile, the top contributors that experienced a decline include indexes for apparel (-1.5%), communication (-0.6%) and household furnishings and operations (-0.1%).

The index for shelter makes up more than 40% of the “core” CPI. The index saw a 0.4% rise in October, following an increase of 0.2% in September. The indexes for owners’ equivalent rent (OER) and rent of primary residence (RPR) increased by 0.4% and 0.3% over the month. These gains have been the largest contributors to headline inflation in recent months. 

During the past twelve months, on a non-seasonally adjusted basis, the CPI rose by 2.6% in October, following a 2.4% increase in September. The “core” CPI increased by 3.3% over the past twelve months, the same increase as in September. The food index rose by 2.1%, while the energy index fell by 4.9%.

NAHB constructs a “real” rent index to indicate whether inflation in rents is faster or slower than overall inflation. It provides insight into the supply and demand conditions for rental housing. When inflation in rents is rising faster than overall inflation, the real rent index rises and vice versa. The real rent index is calculated by dividing the price index for rent by the core CPI (to exclude the volatile food and energy components).

In October, the Real Rent Index remained unchanged for the second consecutive month. Over the first ten months of 2024, the monthly growth rate of the Real Rent Index averaged 0.1%, slower than the average of 0.2% in 2023.

Discover more from Eye On Housing

Subscribe to get the latest posts sent to your email.


This article was originally published by a eyeonhousing.org . Read the Original article here. .


Private fixed investment in student dormitories increased by 2.2% to a seasonally adjusted annual rate (SAAR) of $3.9 billion in the third quarter of 2024. This rise follows a 7% decrease in the prior quarter. However, private fixed investment in dorms was 1.8% lower than a year ago, as the elevated interest rates place a damper on student housing construction.  

Private fixed investment in student housing experienced a surge after the Great Recession, as college enrollment increased from 17.2 million in 2006 to 20.4 million in 2011. However, during the pandemic, private fixed investment in student housing declined drastically from $4.4 billion (SAAR) in the last quarter of 2019 to a lower annual pace of $3 billion in the second quarter of 2021, as COVID-19 interrupted normal on-campus learning. According to the National Student Clearinghouse Research Center, college enrollment fell by 3.6% in the fall of 2020 and by 3.1% in the fall of 2021.  

Since then, private fixed investment has rebounded, as college enrollments show a slow but stabilizing recovery from pandemic driven declines. Effective in-person learning requires college students to return to campuses, boosting the student housing sector. Furthermore, the demand for student housing is growing robustly, because total enrollment in postsecondary institutions is projected to increase 8% from 2020 to 2030, according to the National Center for Education Statistics. 

Discover more from Eye On Housing

Subscribe to get the latest posts sent to your email.


This article was originally published by a eyeonhousing.org . Read the Original article here. .


Approximately 27% of the national housing stock consists of multifamily homes—defined as residential buildings with multiple separate housing units within one structure. According to the 2023 American Community Survey 1-year estimates, these units range from small duplexes, triplexes, and quadplexes (2 to 4 units) to medium-sized buildings (5 to 49 units) and large complexes (50 or more units).

While most congressional districts have multifamily housing shares between 10% to 20% of total housing units, this proportion varies widely, from as low as 8% to as high as 98%. The map below illustrates the distribution of multifamily housing stock across congressional districts with larger shares indicated by bigger bubble size. This visualization shows that districts with the largest share of multifamily units are, unsurprisingly, concentrated in densely populated urban areas.

New York leads in this regard, with its 12th and 13th Districts – both encompassing upper and midtown Manhattan – having almost exclusively multifamily units at 98% each. In fact, eight out of the top 10 districts with the largest share of multifamily housing are in New York. Other areas with large shares include New Jersey’s 8th District, also within the New York metropolitan area, and Massachusetts’s 7th District that includes Boston. At the lower end of the distribution, North Carolina’s 8th District has only 8% multifamily units, while Michigan’s 2nd and 9th Districts, Arizona’s 9th District, and Florida’s 12th District all have around 9% multifamily units.

Building Sizes in Multifamily Units

In most congressional districts, multifamily units tend to be on the smaller side, with the majority consisting of buildings with 5 to 19 units, followed by those with 2 to 4 units. Duplexes, triplexes, and quadplexes (2 to 4 units) are especially common in the Northeast, various Mountain states, and parts of California. Apart from Illinois’s 4th District, which has the highest share of small multifamily units (70%), the remaining top five districts with the largest shares of 2 to 4 unit buildings are all in New York, each exceeding 60%.

Buildings with 5 to 19 units are more prevalent across the South and Midwest, with Maryland’s 2nd, 3rd and 4th Districts owning majority shares of this building type with 59%, 62% and 61%, respectively. High-density areas like New York’s 12th District, Florida’s 27th District – located within Miami-Dade County – and Washington, D.C. (at large), tend to have the largest multifamily (50 or more) buildings. North Dakota (at large) and Minnesota’s 6th District stand out as the only two congressional districts where the majority of multifamily buildings have between 20 to 49 multifamily units.

Gross Median Rent and Renter Cost Burden

Multifamily units are predominantly rented rather than owned, with 86% being occupied by renters. This trend holds across all multifamily types, with larger buildings generally more likely to be rental properties, while condominiums (owner-occupied units) are often smaller buildings. A Fannie Mae study on the multifamily market found that larger properties typically command higher monthly rents, especially in major metropolitan areas. The chart below corroborates this, showing that districts with higher shares of large multifamily buildings (50 or more units) also have higher median monthly rents (including utilities and fuel). However, lower median rents don’t always equate to more affordability, as even low-rent areas can have high renter cost burdens due to lower income levels. For example, New York’s 12th District has the highest median rent at $3,121, with 43% of renters burdened (spending over 30% of income on housing costs), a rate matched by Kentucky’s 5th District, where the median rent is only $727. Overall, despite rent prices moderating (see Real Rent Index), rental cost burdens remain high across the country, with only 23 of 436 congressional districts (including D.C.) having fewer than 40% of renter households burdened by housing costs.

Additional housing data for your congressional district are provided by the US Census Bureau here.

Discover more from Eye On Housing

Subscribe to get the latest posts sent to your email.


This article was originally published by a
eyeonhousing.org . Read the Original article here. .


With elevated interest rates and rising home prices, 103.5 million households in the United States cannot afford a $495,750 median-priced new home. The growing affordability crisis makes housing a top issue for voters in the 2024 presidential election. Both presidential candidates have offered housing policy proposals to address our nation’s housing supply and affordability challenges.

Homeownership has been a crucial part of the American Dream for over a century as owning a home not only provides households with a stable place to live, but also offers an opportunity for households to accumulate assets and build wealth over time through equity.

A recent NAHB study on home buyer preferences revealed that a single-family detached home remained the top purchase preference for two out of every three buyers. In reality, only 54% of the total housing units in 2023 were owner-occupied single-family detached homes, according to NAHB analysis of American Community Survey (ACS) data. This equates to around 70 million homes of the total 131 million housing units.

In addition, a recent article in the Washington Post stated that “the new American Dream should be a townhouse (using the term of single-family attached homes in this post).” The article argues that townhouses are more affordable, need less maintenance, and foster a sense of community. Additionally, townhomes in medium-density residential neighborhoods can be a good option for younger home buyers. However, owner-occupied single-family attached homes only accounted for 4% of the total occupied housing units in 2023.

Single-Family Detached Homes Across Congressional Districts

Across congressional districts, the share of single-family detached homes among all owner-occupied housing units varies substantially, ranging from 3% to 95%.

Texas has a high share of owner-occupied single-family homes. Texas’s 20th congressional district has the highest share of single-family detached homes. All congressional districts in Texas have at least an 83% share of single-family detached homes. Four districts in Texas, two in Indiana and Nebraska, one in Iowa, and one in California report the top ten highest share of single-family detached homes.

At the bottom of the ranking, congressional districts in New York and Pennsylvania are on the list of the ten lowest shares of single-family detached homes. New York’s 12th, 13th, and 10th, where renter-occupied housing units exceed owner-occupied ones, have the lowest share with 3%, 4%, and 5%, respectively. In addition to a lower share of single-family detached homes, New York’s 12th and 13th have a low share of single-family attached homes, with 2% for both districts. In the District of Columbia, at-large, 22% of owner-occupied single-family housing units are detached, ranked as the 12th lowest share.

Despite the geographic variation, single-family detached homes dominate most of the owner-occupied housing markets. Out of all 436 congressional districts, only 18 congressional districts have a lower share of single-family detached homes than the national level of 54%.

Single-Family Attached Homes Across Congressional Districts

Although single-family attached homes are not as popular as single-family detached homes in the owner-occupied housing market, the share of single-family attached homes shows substantial variation across congressional districts, ranging from 0% to 78%.

Pennsylvania’s 3rd congressional district has about 78% single-family attached homes, followed by Pennsylvania’s 2nd district with 75% single-family attached homes, and Maryland’s 7th district with 57%. The District of Columbia, at-large, with only 22% single-family detached homes, was ranked as the fourth highest share of single-family attached homes (43%).

Single-family attached homes have become popular as more home buyers are looking for “medium-density residential neighborhoods, such as urban villages that offer walkable environments and other amenities”, as mentioned in an NAHB blog post.

Median Home Value

The median value of owner-occupied housing units in the United States is $340,200, though it varies significantly across congressional districts depending on local housing supply and demand, property size, neighborhood, and overall economic factors. Coastal areas often have significantly higher median home values than rural regions.

Analysis of the 2023 ACS data shows that of the 14 congressional districts where median house value exceeds one million, 12 of them are in California. California’s 16th congressional district has the highest median home value of $1,820,400 among all congressional districts, with 81% of 159,895 owner-occupied housing units valuing more than one million dollars.

New York’s 12th and 10th congressional districts, with only 3% and 5% single-family detached homes, are the other two districts where median home value is over one million.

Additional housing data for your congressional district are provided by the US Census Bureau here.

Discover more from Eye On Housing

Subscribe to get the latest posts sent to your email.


This article was originally published by a eyeonhousing.org . Read the Original article here. .


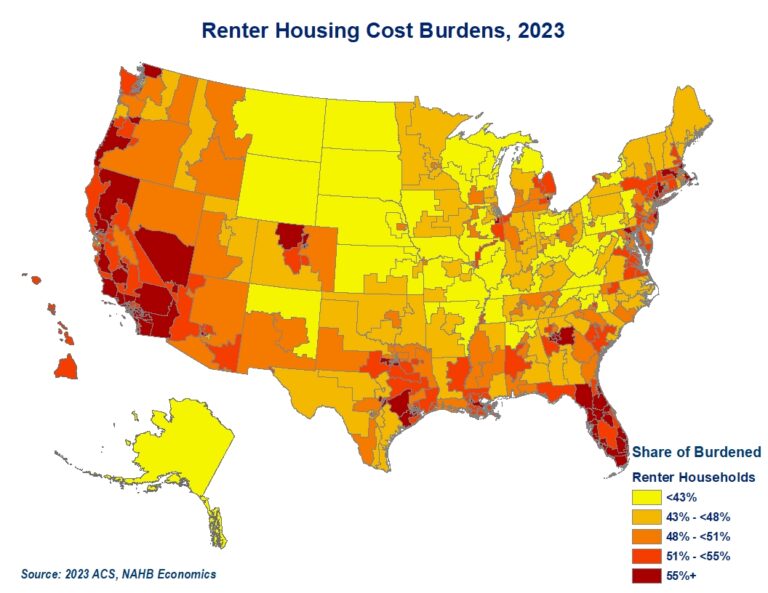
While the lack of affordable housing dominates the headlines across the nation, congressional districts with higher shares of renter households are disproportionately affected by the current affordability crisis. Geographically, the districts with the largest housing cost burdens are heavily concentrated in California, Florida, and the coastal Northeast.

Buoyed by significant home equity gains and locked in by below-market mortgages rates, current home owners are in a more advantageous financial position to weather the growing affordability crisis. At the same time, renters are facing the worst affordability on record. According to the latest 2023 American Community Survey (ACS), more than half of all renter households, or 23 million, spend 30 percent or more of their income on housing, and therefore are considered burdened by housing costs. Among home owners, the share of households that are cost burdened is less than a quarter (24%). Nevertheless, this amounts to 20.6 million owner households who experience housing cost burdens. As a result, congressional districts where housing markets are dominated by renters are more likely to register higher overall shares of households with cost burdens.

In a typical congressional district, about a third of all households, renters and owners combined, experience housing cost burdens. In contrast, in the ten congressional districts with the highest burden rates, more than half of all households spend 30% or more of their income on housing.

The highest burden rates are found in five districts each in California and New York and two in Florida (see the chart above). In New York’s 15th and 13th, 55% and 52% of households, respectively, are burdened with housing costs. The vast majority of these households are renters, as reflected by the low homeownership rates in these districts, 16% and 13%, respectively. Similarly, the remaining top 10 districts with the highest shares of burdened households have homeownership rates well below the national average of 65%. On the list, only Florida’s 20th and 24th have homeownership rates that exceed 50%. Since congressional districts are drawn to represent roughly the same number of people, higher shares typically translate into larger counts of cost burdened households. To capture any remaining differences, the size of the bubbles in the chart correlates with the overall number of burdened households.

On the rental side, nine out of eleven worst burdened districts are in Florida. Close to two thirds of renters in Florida’s 26th, 20th, 25th and 19th are burdened with housing costs. The renter burden rates are similarly high in Florida’s 28th, 21st, 24th, 13th, and 23rd, where the shares of housing cost burdened renters are between 63% and 64%. Only California’s 27th and 29th register slightly higher burden shares exceeding 64%. At the other end of the spectrum is Wisconsin’s 7th, where just a third of renter households experience housing cost burdens.

Florida, New York, and California stand out for simultaneously having congressional districts with the highest shares of cost burdened renters and owners. The heaviest owner burden rates dozen consists of five congressional districts in New York and California each and two in Florida. In New York’s 9th and 8th districts, 43% and 42% of home owners, respectively, spend 30% of more of their income on housing. While high property taxes contribute heavily to owners’ burden in New York and California, fast rising insurance premiums strain home owners’ budgets in Florida.

The list of congressional districts with the lowest ownership burden rates include Alabama’s 5th, West Virginia’s 1st and 2nd, North Dakota’s at-Large, South Carolina’s 4th, Indiana’s 4th, 5th, and 6th, Arkansas 3rd, Tennessee’s 2nd, Missouri’s 3rd and 6th. Less than 17% of home owners in these districts spend 30% of their income or more on housing.

Additional housing data for your congressional district are provided by the US Census Bureau here.

Discover more from Eye On Housing

Subscribe to get the latest posts sent to your email.


This article was originally published by a eyeonhousing.org . Read the Original article here. .


We’re excited to introduce a new way for you to stay informed about the latest trends in housing and construction economics: our Eye on Housing Highlights video series!

For each edition, we will highlight top research topics including construction statistics, housing affordability, policy research, NAHB surveys, macroeconomics, financial indicators and more.

You can find these videos on eyeonhousing.org in the menu under Highlights—be sure to save the url: eyeonhousing.org/highlights—and check back to see the latest videos.

You can also be reminded by subscribing to our Eye on the Economy Newsletter that shares bi-weekly updates from NAHB’s chief economist on housing and economic activity.

Please note that you won’t receive further emails like this one—this is a one-time announcement of our new series.

Discover more from Eye On Housing

Subscribe to get the latest posts sent to your email.


This article was originally published by a eyeonhousing.org . Read the Original article here. .


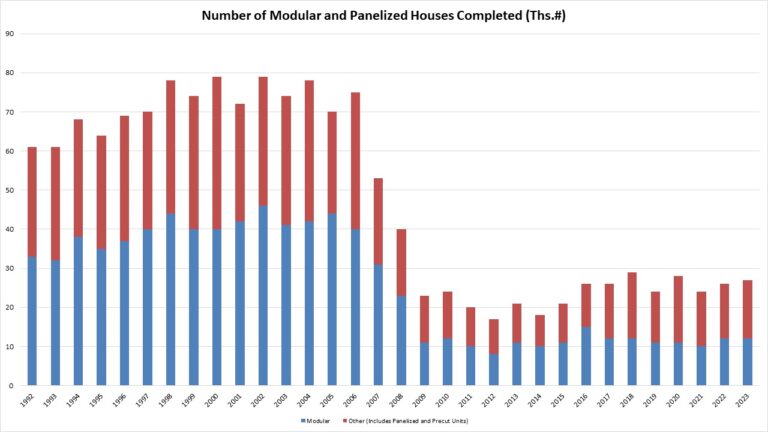
The total market share of non-site built single-family homes (modular and panelized) was just 3% of single-family homes in 2023, according to completion data from the Census Bureau Survey of Construction data and NAHB analysis. This is a slight increase from the 2% share in 2022. This share has been steadily declining since the early-2000s despite the high-level of interest for non-site built construction. This low market share in fact runs counter to some media commentary on off-site construction suggesting recent gains. Nonetheless, there exists potential for market share gains in the years ahead due to the need to increase productivity in the residential construction sector.

In 2023, there were 27,000 total single-family units built using modular (12,000) and panelized/pre-cut (15,000) construction methods, out of a total of 999,000 single-family homes completed. It is worth noting that the Census definitions of off-site construction are relatively narrow. In a separate survey, the Home Innovation Research Labs Survey of U.S. Home Builders has a higher share for panelized construction (5-12%) due to a wider definition of “panelized” construction.

While the Census-measured market share is small, there exists potential for expansion. This 3% market share for 2023 represents a decline from years prior to the Great Recession. In 1998, 7% of single-family completions were modular (4%) or panelized (3%). This marked the largest share for the 1992-2023 period.

One notable regional concentration is found in the Northeast and Midwest. These two regions tie for the highest market share of homes built using non-site build construction methods. In the Northeast, 5% (4,000 homes) of the region’s 61,000 housing units were completed using non-site built construction methods. At the same time, in the Midwest, 5% market share (6,000 homes) of the region’s 126,000 housing units were completed using non-site build construction methods.

With respect to multifamily construction, approximately 7% of multifamily buildings (properties, not units) were built using modular and panelized methods, marking the highest level in the last two decades. This is significantly higher than the 2% share in 2022 and 1% share in 2018-2021. It is notable that modular construction methods accounted for 5% of this share, whereas in previous years it was only panelized construction methods that made up the small share of non-site build methods in multifamily construction.  Prior to last year, the highest levels of modular and panelized methods share in multifamily construction was in 2000 and 2011, where 5% of multifamily buildings were constructed with modular (1%) or panelized construction methods (4%).

Discover more from Eye On Housing

Subscribe to get the latest posts sent to your email.


This article was originally published by a eyeonhousing.org . Read the Original article here. .

Pin It