Tag

housing affordability

Browsing


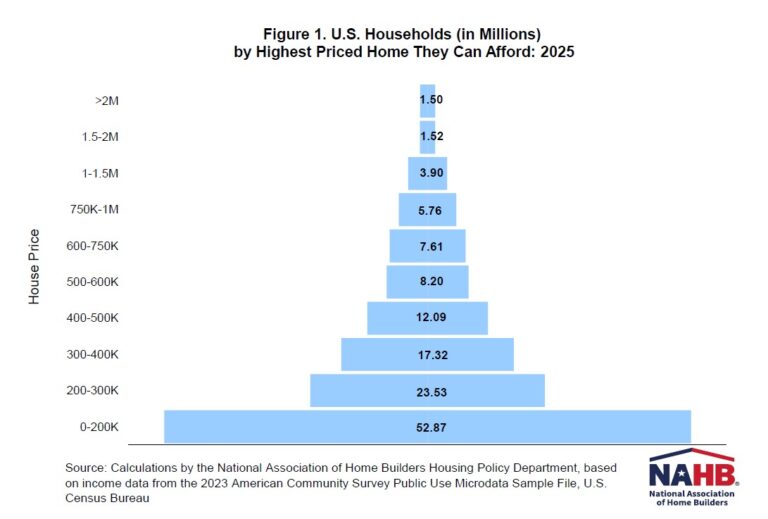
NAHB recently released its 2025 Priced-Out Analysis, highlighting the housing affordability challenge. While previous posts discussed the impacts of rising home prices and interest rates on affordability, this post focuses on the related U.S. housing affordability pyramid. The pyramid reveals that 70% of households (94 million) cannot afford a $400,000 home, while the estimated median price of a new home is around $460,000 in 2025.

The housing affordability pyramid illustrates the number of households able to purchase a home at various price steps. Each step represents the number of households that can only afford homes within that specific price range. The largest share of households falls within the first step, where homes are priced under $200,000. As home prices increase, fewer and fewer households can afford the next price level, with the highest-priced homes—those over $2 million—having the smallest number of potential buyers. Housing affordability remains a critical challenge for households with income at the lower end of the spectrum.

The pyramid is based on income thresholds and underwriting standards. Under these assumptions, the minimum income required to purchase a $200,000 home at the mortgage rate of 6.5% is $61,487. In 2025, about 52.87 million households in the U.S. are estimated to have incomes no more than that threshold and, therefore, can only afford to buy homes priced up to $200,000. These 52.87 million households form the bottom step of the pyramid. Of the remaining households who can afford a home priced at $200,000, 23.53 million can only afford to pay a top price of somewhere between $200,000 and $300,000. These households make up the second step on the pyramid. Each subsequent step narrows further, reflecting the shrinking number of households that can afford increasingly expensive homes.

It is worthwhile to compare the number of households that can afford homes at various price levels and the number of owner-occupied homes available in those ranges (excludes homes built-for-rent), as shown in Figure 2. For example, while around 53 million households can afford a home priced at $200,000 or less, there are only 22 million owner-occupied homes valued in this price range. This trend continues in the $200,000 to $300,000 price range, where the number of households that can afford homes is much higher than the number of housing units in that range. These imbalances show a shortage of affordable housing.

Discover more from Eye On Housing

Subscribe to get the latest posts sent to your email.


This article was originally published by a eyeonhousing.org . Read the Original article here. .

As housing affordability remains a critical challenge across the country, mortgage rates continue to play a central role in shaping homebuying power. Mortgage rates stayed elevated throughout 2023 and early 2024. Recent data, however, shows a modest decline in mortgage rates. Even slight declines can have a significant impact on housing affordability, pricing more households back into the market. New NAHB Priced-Out Estimates show how home price increases affect housing affordability in 2025. This post presents details regarding how interest rates affect the number of households that can afford a median priced new home.

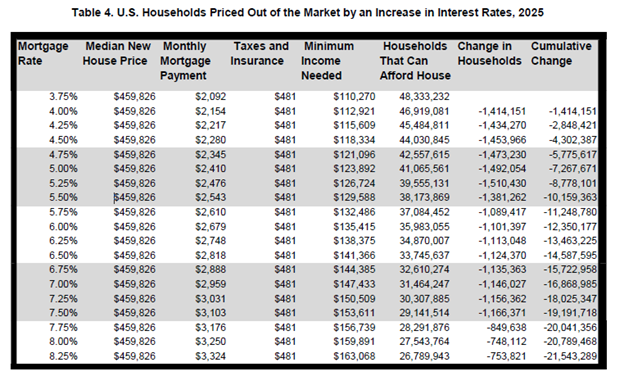
At the beginning of 2025, with the average 30-year fixed mortgage rate at 7%, around 31.5 million households could afford a median-priced home at $459,826. This requires a household income of $147,433 by the front-end underwriting standards[1]. In contrast, if the average mortgage rates had remained at the recent peak of 7.62% in October 2023, only 28.7 million households would have qualified. This 62-basis point decline has effectively priced 2.8 million additional households into the market, expanding homeownership opportunities.

The table below shows how affordability changes with each 25 basis-point increase in interest rates, from 3.75% to 8.25% for a median-priced home at $459,826. The minimum required income with a 3.75% mortgage rate is $110,270. In contrast, a mortgage rate of 8.25%, increases the required income to $163,068, pushing millions of households out of the market.

As rates climb higher, the priced-out effect diminishes. When interest rates increase from 6.5% to 6.75%, around 1.13 million households are priced out of the market, unable to meet the higher income threshold required to afford the increased monthly payments. However, an increase from 7.75% to 8% would squeeze about 850,000 households out of the market.

This exemplifies that when interest rates are relatively low, a 25 basis-point increase has a much larger impact. It is because it affects a broader portion of households in the middle of the income distribution. For example, if the mortgage interest rate decreases from 5.25% to 5%, around 1.5 million more households will qualify the mortgage for the new homes at the median price of $459,826. This indicates lower interest rates can unlock homeownership opportunities for a substantial number of households.

[1] . The sum of monthly payment, including the principal amount, loan interest, property tax, homeowners’ property and private mortgage insurance premiums (PITI), is no more than 28 percent of monthly gross household income.

Discover more from Eye On Housing

Subscribe to get the latest posts sent to your email.


This article was originally published by a eyeonhousing.org . Read the Original article here. .

Housing affordability remains a critical issue, with 74.9% of U.S. households unable to afford a median-priced new home in 2025, according to NAHB’s latest analysis. With a median price of $459,826 and a 30-year mortgage rate of 6.5%, this translates to around 100.6 million households priced out of the market, even before accounting for further increases in home prices or interest rates. A $1,000 increase in the median price of new homes would price an additional 115,593 households out of the market.

The 2024 priced-out estimates for all states and the District of Columbia and over 300 metropolitan statistical areas are shown in the interactive map below. It highlights the growing housing affordability challenges across the United States. In 23 states and the District of Columbia, over 80% of households are priced out of the median-priced new home market. This indicates a significant disconnect between rising home prices and household incomes.

Maine stands out as the state with the highest share of households (91.2%) unable to afford the state’s median new home price of $682,223. High-cost states such as Connecticut and Rhode Island follow closely, with 88.3% and 87.8% of households, respectively, struggling to afford new homes. Even in states with relatively lower median new home prices, affordability remains a major concern. For example, in Mississippi, where the median home price is $275,333, 70.2% of households still find these new homes out of reach. Meanwhile, Delaware, the state with better affordability in the analysis, has a median new home price of $373,666. However, around 58.2% of households in Delaware still struggle to afford a new home. Even modest price increases, such as an additional $1,000, could push thousands more households from affording these median priced new homes. For instance, in Texas, such an increase could price out over 11,000 households.

It also shows the 2025 priced-out estimates for over 300 metropolitan statistical areas. The analysis estimates how many households in each metro area earn enough income to qualify for mortgages on median-priced new homes. In high-cost areas like the San Jose-Sunnyvale-Santa Clara, CA metro area, where new homes largely target high-income Silicon Valley residents, only 10% of all households meet the minimum income threshold of $437,963 required to qualify for a loan on a median priced new home. In contrast, in more affordable metro areas like Sierra Vista-Douglas, AZ, where the median new home price is $150,893, nearly two-thirds of households can afford a median priced new home. While higher home prices generally result in higher monthly mortgage payments and higher income thresholds, the relationship between home prices and affordability is not always linear. Factors like property taxes and insurance payments can also significantly impact monthly housing costs, adding complexity to affordability calculations.

The affordability of new homes together with the population size of a metro area, significantly influence the priced-out impact of a $1,000 increase in new home prices. In metro areas where new homes are already unaffordable to most households, the effect of such an increase tends to be small. For instance, in the San Jose-Sunnyvale-Santa Clara, CA metro area, an additional $1,000 increase to the home price affects only 259 households, as only 10% of all households could afford such expensive new homes in the first place. Here, the additional price increase only affects a narrow share of high-income households at the upper end of the income distribution, where affordability is already stretched.

In contrast, metro areas, where new homes are more broadly affordable, experience a larger priced-out effect. A $1,000 increase in the median new home price affects a larger share of households in the “thicker part” of the income distribution. For example, in the Dallas-Fort Worth-Arlington, TX metro area, a $1,000 increase in new home price would disqualify 2,882 households from affording a median-priced new home. This is the largest priced-out effect among all metro areas, driven by the combination of relatively moderate home prices and a substantial population base.

More details, including priced-out estimates for every state and over 300 metropolitan areas, and a description of the underlying methodology, are available in the full study.

Discover more from Eye On Housing

Subscribe to get the latest posts sent to your email.


This article was originally published by a eyeonhousing.org . Read the Original article here. .

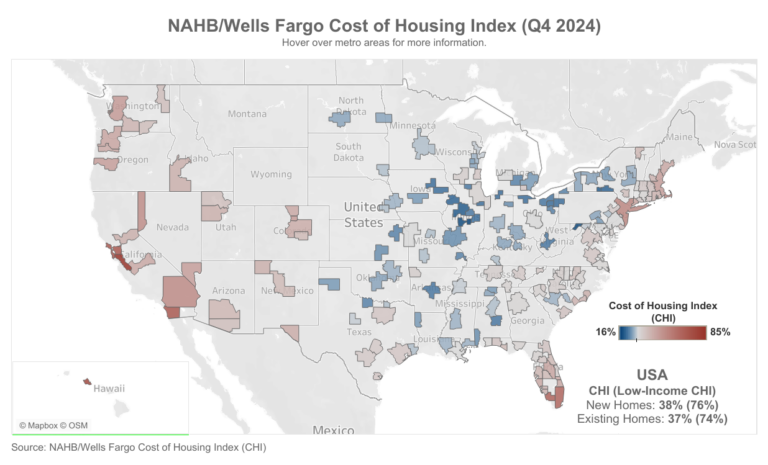
In a clear sign illustrating the housing affordability challenges facing Americans, the National Association of Home Builders (NAHB)/Wells Fargo Cost of Housing Index (CHI) found that in the fourth quarter of 2024, a family earning the nation’s median income of $97,800 needed 38% of its income to cover the mortgage payment on a median-priced new home. Low-income families, defined as those earning only 50% of the median income, would have to spend 76% of their earnings to pay for the same new home.

The figures track closely for the purchase of existing homes in the U.S. as well. A typical family would have to pay 37% of their income for a median-priced existing home, while a low-income family would need to pay 74% of their earnings to make the same mortgage payment.

There was no change in the percentage of a family’s income needed to purchase a new home (38%) between the third and fourth quarters of 2024. However, the cost burden did increase slightly for low-income families, rising from 75% to 76% of their income.

Meanwhile, the cost burden of existing homes edged lower for both median- and low-income families between the third and fourth quarter. The CHI indices were 37% and 74%, respectively, in the fourth quarter, down from 38% and 75% in the third quarter. The slight uptick in affordability was due to median existing home prices falling 2% from the third quarter to the fourth quarter of 2024.

CHI is also available for 176 metropolitan areas, calculating the percentage of a family’s income needed to make the mortgage payment on an existing home based on the local median home price and median income in those markets.

In 10 out of 176 markets in the fourth quarter, the typical family is severely cost-burdened (must pay more than 50% of their income on a median-priced existing home). In 85 other markets, such families are cost-burdened (need to pay between 31% and 50%). There are 81 markets where the CHI is 30% of earnings or lower.

The Top 5 Severely Cost-Burdened Markets

San Jose-Sunnyvale-Santa Clara, Calif., was the most severely cost-burdened market on the CHI, where 87% of a typical family’s income is needed to make a mortgage payment on an existing home. This was followed by:

Urban Honolulu, Hawaii (74%)

San Diego-Chula Vista-Carlsbad, Calif. (69%)

San Francisco-Oakland-Berkeley, Calif. (69%)

Naples-Marco Island, Fla. (65%)

Low-income families would have to pay between 129% and 174% of their income in all five of the above markets to cover a mortgage.

The Top 5 Least Cost-Burdened Markets

By contrast, Decatur, Ill., was the least cost-burdened market in the CHI, where typical families needed to spend just 16% of their income to pay for a mortgage on an existing home. Rounding out the least burdened markets are:

Cumberland, Md.-W.Va (17%)

Springfield, Ill. (17%)

Elmira, N.Y. (19%)

Peoria, Ill. (19%)

Low-income families in these markets would have to pay between 31% and 39% of their income to cover the mortgage payment for a median-priced existing home.

Visit nahb.org/chi for tables and details.

Discover more from Eye On Housing

Subscribe to get the latest posts sent to your email.


This article was originally published by a eyeonhousing.org . Read the Original article here. .

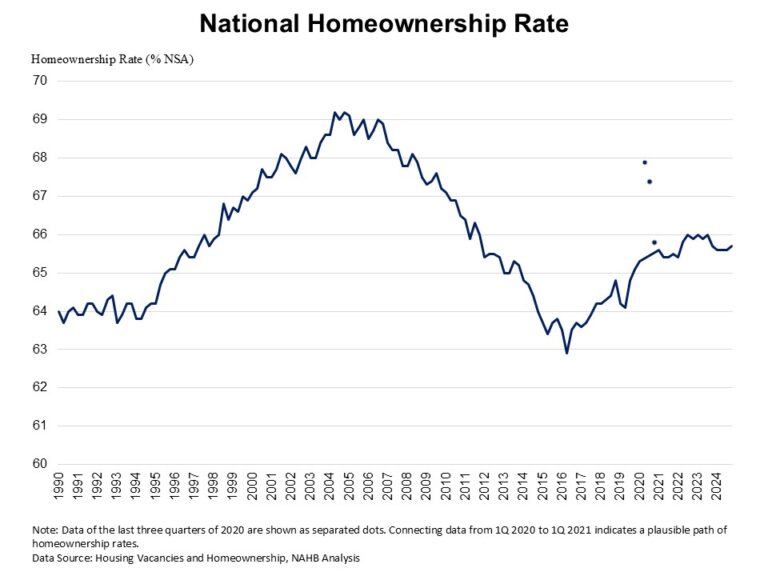
The homeownership rate for those under the age of 35 dropped to 36.3% in the last quarter of 2024, reaching the lowest level since the third quarter of 2019, according to the Census’s Housing Vacancy Survey (HVS). Amidst elevated mortgage interest rates and tight housing supply, housing affordability is at a multidecade low. The youngest age group, who are particularly sensitive to mortgage rates, home prices, and the inventory of entry-level homes, saw the largest decline among all age categories.

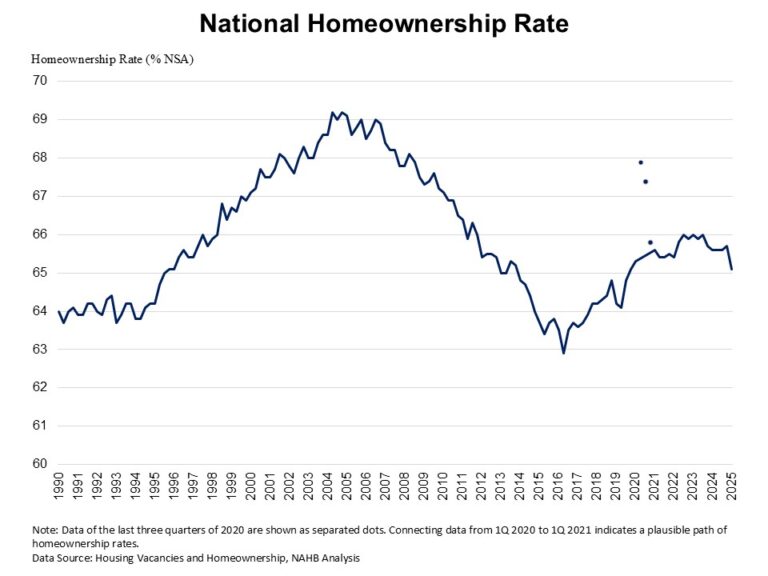
The U.S. homeownership rate inch up to 65.7% in the last quarter of 2024, hovering at the lowest rate in the last two years. The homeownership rate remains below the 25-year average rate of 66.4%.

The national rental vacancy rate stayed at 6.9% for the last quarter of 2024, and the homeowner vacancy rate inched up to 1.1%. The homeowner vacancy rate remains close to the survey’s 67-year low of 0.7%.

Homeownership rates declined for under 35 and 35-44 age groups compared to a year ago. Householders under 35 experienced the largest drop, declining by 1.8 percentage points from 38.1% to 36.3%. The 35-44 age group also saw a 0.6 percentage point decrease, decreasing from 62% to 61.4%. Conversely, homeownership rates for householders aged 45-54 increased from 70.3% to 71%. Among those aged 55-64, homeownership inched up slightly from 76% to 76.3%. Those 65 years and over experienced a modest increase from 79% to 79.5%.

The housing stock-based HVS revealed that the count of total households increased to 132.4 million in the last quarter of 2024 from 131.1 million a year ago. The gains are due to gains in both renter household formation (509,000 increase), and owner-occupied households (783,000 increase).

Discover more from Eye On Housing

Subscribe to get the latest posts sent to your email.


This article was originally published by a eyeonhousing.org . Read the Original article here. .


In another sign of America’s ongoing housing affordability crisis, the National Association of Home Builders /Wells Fargo Cost of Housing Index (CHI) found that in the third quarter of 2024, a family earning the nation’s median income of $97,800 needed 38% of their income to cover the mortgage payment on a median-priced new home. Low-income families, defined as those earning only 50% of the median income, would have to spend 75% of their earnings to pay for the same new home.

The figures track identically for the purchase of existing homes. A typical family would have to pay 38% of their income for a median-priced existing home while a low-income family would need to pay 75% of their earnings to make the same mortgage payment.

There was no change in the share of a family’s income needed to purchase a new home (38%) between the second and third quarters of 2024, but affordability did improve slightly for low-income families, with the CHI falling from 77% to 75%. 

Meanwhile, affordability of existing homes edged higher for both median- and low-income families between the second and third quarter. The Cost of Housing Indices were 38% and 75% in the third quarter vs. 39% and 79%, respectively, in the second quarter. 

CHI is also available for 176 metropolitan areas, calculating the percentage of a family’s income needed to make the mortgage payment on an existing home based on the local median home price and median income in those markets.

In 10 out of 176 markets in the third quarter, the typical family is severely cost-burdened (must pay more than 50% of their income on a median-priced existing home). In 85 other markets, such families are cost-burdened (need to pay between 31% and 50%). There are 81 markets where the CHI is 30% of earnings or lower.

The Top 5 Severely Cost-Burdened Markets

San Jose-Sunnyvale-Santa Clara, Calif., was the most severely cost-burdened market on the CHI, where 85% of a typical family’s income is needed to make a mortgage payment on an existing home. This was followed by:

Urban Honolulu, Hawaii (75%)

San Diego-Chula Vista-Carlsbad, Calif. (70%)

San Francisco-Oakland-Berkeley, Calif. (68%)

Miami-Fort Lauderdale-Pompano Beach, Fla. (63%)

Low-income families would have to pay between 127% and 170% of their income in all five of the above markets to cover a mortgage.

The Top 5 Least Cost-Burdened Markets

By contrast, Decatur, Ill., was the least cost-burdened market in the CHI, where typical families needed to spend just 16% of their income to pay for a mortgage on an existing home. Rounding out the least burdened markets are:

Cumberland, Md.-W.Va (18%)

Springfield, Ill. (18%)

Elmira, N.Y. (19%)

Peoria, Ill. (19%)

Low-income families in these markets would have to pay between 33% and 39% of their income to cover the mortgage payment for a median-priced existing home.

Visit nahb.org/chi for tables and details.

Discover more from Eye On Housing

Subscribe to get the latest posts sent to your email.


This article was originally published by a eyeonhousing.org . Read the Original article here. .

The homeownership rate for those under the age of 35 dropped to 37% in the third quarter of 2024, reaching the lowest level since the first quarter of 2020, according to the Census’s Housing Vacancy Survey (HVS). Amidst elevated mortgage interest rates and tight housing supply, housing affordability is at a multidecade low. The youngest age group, who are particularly sensitive to mortgage rates, home prices, and the inventory of entry-level homes, saw the largest decline among all age categories.

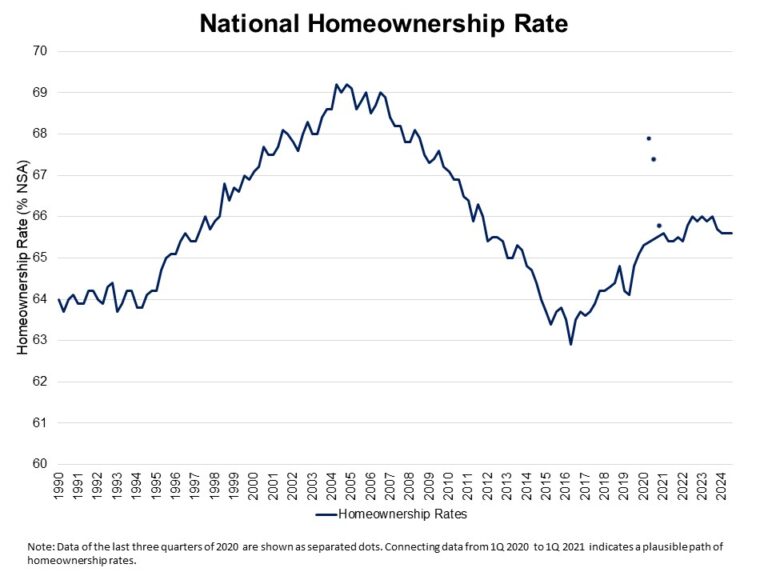
The U.S. homeownership rate held steady at 65.6% in the third quarter of 2024, showing a flat trend over the last three quarters.  However, this marks the lowest rate in the last two years. The homeownership rate remains below the 25-year average rate of 66.4%.

The national rental vacancy rate went up to 6.9% for the third quarter of 2024, and the homeowner vacancy rate inched up to 1%. The homeowner vacancy rate remains close to the survey’s 67-year low of 0.7%.

Homeownership rates declined across all age groups compared to a year ago, except for those aged 55-64. Householders under 35 experienced the largest drop, declining by 1.3 percentage points from 38.3% to 37%. The 45-54 age group also saw a 1.3 percentage point decrease, decreasing from 71% to 69.7%. For householders aged 35-44, who experienced a modest 0.6 percentage point decline. Among those 65 years and over, homeownership inched down slightly from 79.2% to 79.1%. In contrast, the homeownership rate of the 55–64 age group rose to 75.9% from 75.4%.

The housing stock-based HVS revealed that the count of total households increased to 132.1 million in the third quarter of 2024 from 130.3 million a year ago. The gains are largely due to gains in both renter household formation (1.1 million increase), and owner-occupied households (655,000 increase).

Discover more from Eye On Housing

Subscribe to get the latest posts sent to your email.


This article was originally published by a eyeonhousing.org . Read the Original article here. .

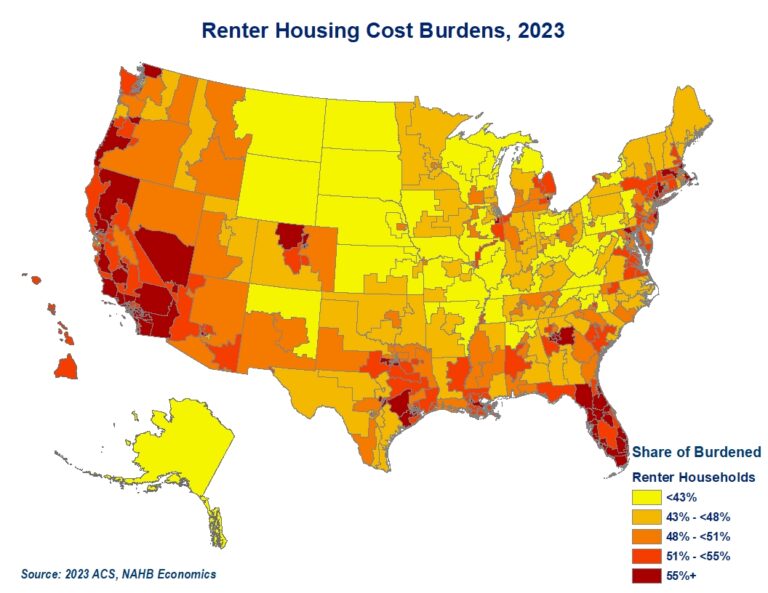
While the lack of affordable housing dominates the headlines across the nation, congressional districts with higher shares of renter households are disproportionately affected by the current affordability crisis. Geographically, the districts with the largest housing cost burdens are heavily concentrated in California, Florida, and the coastal Northeast.

Buoyed by significant home equity gains and locked in by below-market mortgages rates, current home owners are in a more advantageous financial position to weather the growing affordability crisis. At the same time, renters are facing the worst affordability on record. According to the latest 2023 American Community Survey (ACS), more than half of all renter households, or 23 million, spend 30 percent or more of their income on housing, and therefore are considered burdened by housing costs. Among home owners, the share of households that are cost burdened is less than a quarter (24%). Nevertheless, this amounts to 20.6 million owner households who experience housing cost burdens. As a result, congressional districts where housing markets are dominated by renters are more likely to register higher overall shares of households with cost burdens.

In a typical congressional district, about a third of all households, renters and owners combined, experience housing cost burdens. In contrast, in the ten congressional districts with the highest burden rates, more than half of all households spend 30% or more of their income on housing.

The highest burden rates are found in five districts each in California and New York and two in Florida (see the chart above). In New York’s 15th and 13th, 55% and 52% of households, respectively, are burdened with housing costs. The vast majority of these households are renters, as reflected by the low homeownership rates in these districts, 16% and 13%, respectively. Similarly, the remaining top 10 districts with the highest shares of burdened households have homeownership rates well below the national average of 65%. On the list, only Florida’s 20th and 24th have homeownership rates that exceed 50%. Since congressional districts are drawn to represent roughly the same number of people, higher shares typically translate into larger counts of cost burdened households. To capture any remaining differences, the size of the bubbles in the chart correlates with the overall number of burdened households.

On the rental side, nine out of eleven worst burdened districts are in Florida. Close to two thirds of renters in Florida’s 26th, 20th, 25th and 19th are burdened with housing costs. The renter burden rates are similarly high in Florida’s 28th, 21st, 24th, 13th, and 23rd, where the shares of housing cost burdened renters are between 63% and 64%. Only California’s 27th and 29th register slightly higher burden shares exceeding 64%. At the other end of the spectrum is Wisconsin’s 7th, where just a third of renter households experience housing cost burdens.

Florida, New York, and California stand out for simultaneously having congressional districts with the highest shares of cost burdened renters and owners. The heaviest owner burden rates dozen consists of five congressional districts in New York and California each and two in Florida. In New York’s 9th and 8th districts, 43% and 42% of home owners, respectively, spend 30% of more of their income on housing. While high property taxes contribute heavily to owners’ burden in New York and California, fast rising insurance premiums strain home owners’ budgets in Florida.

The list of congressional districts with the lowest ownership burden rates include Alabama’s 5th, West Virginia’s 1st and 2nd, North Dakota’s at-Large, South Carolina’s 4th, Indiana’s 4th, 5th, and 6th, Arkansas 3rd, Tennessee’s 2nd, Missouri’s 3rd and 6th. Less than 17% of home owners in these districts spend 30% of their income or more on housing.

Additional housing data for your congressional district are provided by the US Census Bureau here.

Discover more from Eye On Housing

Subscribe to get the latest posts sent to your email.


This article was originally published by a eyeonhousing.org . Read the Original article here. .

Pin It