Tag

household finance

Browsing


Total outstanding U.S. consumer credit stood at $5.15 trillion for the fourth quarter of 2024, increasing at an annualized rate of 4.22% (seasonally adjusted), according to the Federal Reserve’s G.19 Consumer Credit Report. This is an uptick from the third quarter of 2024’s rate of 2.47%. 

The G.19 report excludes mortgage loans, so the data primarily reflects consumer credit in the form of student loans, auto loans, and credit card plans. As consumer spending has outpaced personal income, savings rates have been declining, and consumer credit has increased. Previously, consumer credit growth had slowed, as high inflation and rising interest rates led people to reduce their borrowing. However, in the last two quarters, growth rates have increased, reflecting the rate cuts that took place at the end of the third quarter.  

Nonrevolving Credit  

Nonrevolving credit, largely driven by student and auto loans, reached $3.76 trillion (SA) in the fourth quarter of 2024, marking a 3.11% increase at a seasonally adjusted annual rate (SAAR). This is an uptick from last quarter’s rate of 2.28%, and the highest in two years.  

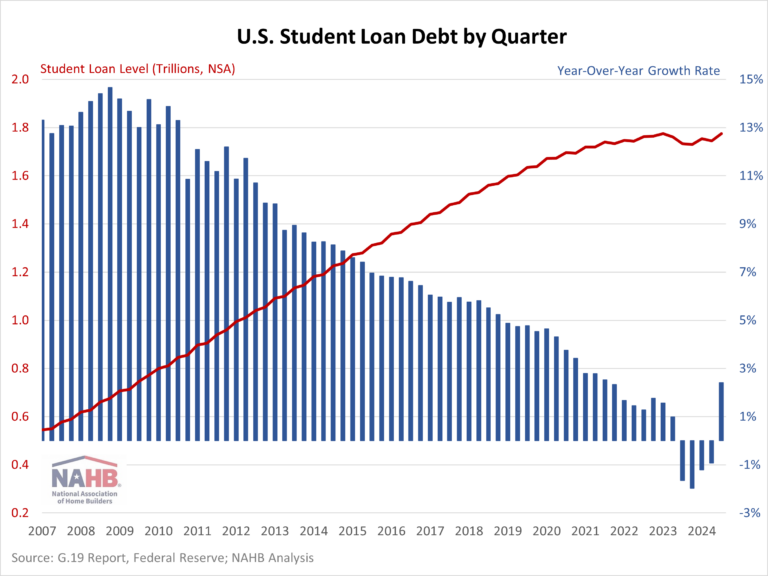
Student loan debt balances stood at $1.78 trillion (NSA) for the fourth quarter of 2024. Year-over-year, student loan debt rose 2.77%, the largest yearly increase since the second quarter of 2021. This shift partially reflects the expiration of the COVID-19 Emergency Relief for student loans’ 0-interest payment pause that ended September 1, 2023. 

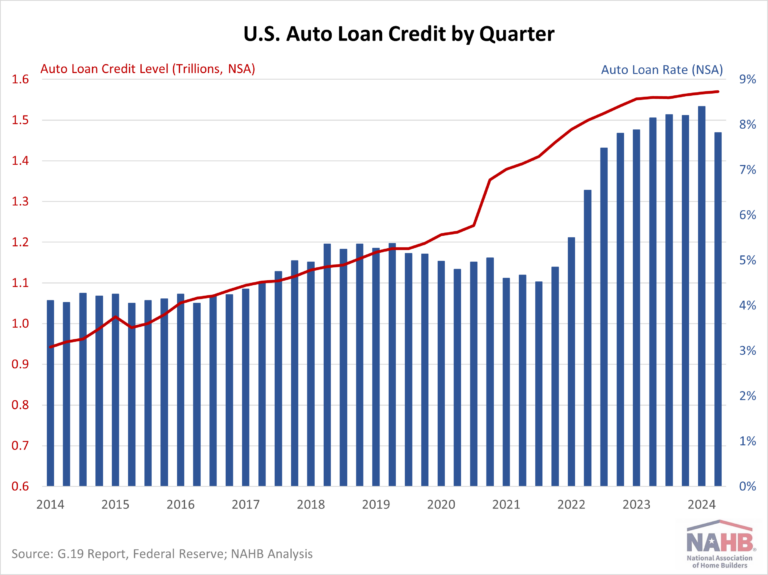
Auto loans reached a total of $1.57 trillion, showing a year-over-year increase of only 0.93%. This marks the second slowest growth rate since 2010, slightly above last quarter’s rate of 0.91%. The deceleration in growth can be attributed to several factors, including stricter lending standards, elevated interest rates, and overall inflation. Although interest rates for 5-year new car loans fell to 7.82% in the fourth quarter from a high of 8.40% in the third quarter, they remain at their highest levels in over a decade. 

Revolving Credit 

Revolving credit, primarily credit card debt, reached $1.38 trillion (SA) in the fourth quarter, rising at an annualized rate of 7.34%. This marked a significant increase from the third quarter’s 3.01% rate but was notably down from the peak growth rate of 17.58% seen in the first quarter of 2022. The surge in credit card balances in early 2022 was accompanied by an increase in the credit card rate which climbed by 4.51 percentage points over 2022. This was an exceptionally steep increase, as no other year in the past two decades had seen a rate jump of more than two percentage points.  

Comparatively, so far in 2024 the credit card rate decreased 0.12 percentage points. For the fourth quarter of 2024, the average credit card rate held by commercial banks (NSA) was 21.47%. 

Discover more from Eye On Housing

Subscribe to get the latest posts sent to your email.


This article was originally published by a eyeonhousing.org . Read the Original article here. .

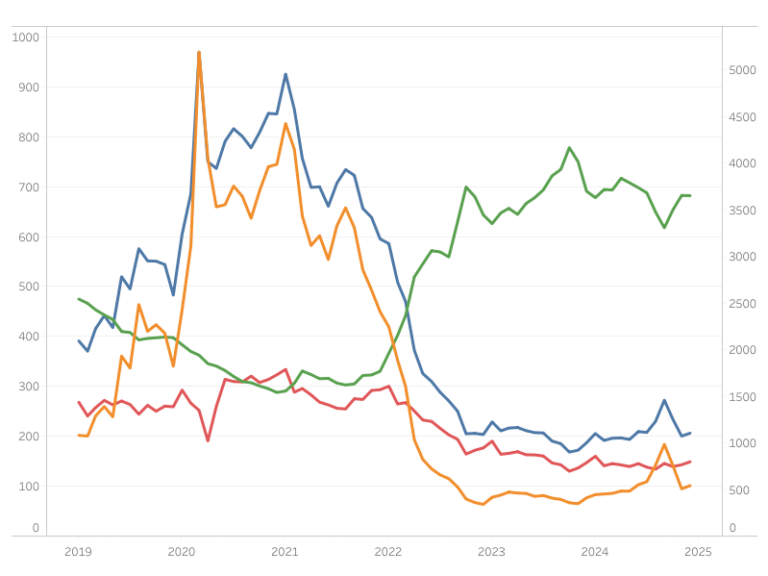
The Market Composite Index, a measure of mortgage loan application volume from the Mortgage Bankers Association’s (MBA) weekly survey, increased by 3.1% month-over-month on a seasonally adjusted (SA) basis, primarily driven by purchasing activity. Compared to January last year, the index is higher by 3.4%. The Market Composite Index which includes the Purchase and Refinance Indices: purchasing experienced a monthly gain of 3.8%, while refinancing decreased 2.3% (SA). On a year-over-year basis, however, the Purchase Index is lower by 3.4%, while the Refinance Index remains higher at 18.6%.

The average 30-year fixed rate mortgage reported in the MBA survey for January ticked up 20 basis points (bps) to 7.02% (index level 702). This rate is 24 basis points higher than the same period last year.

Average loan size (purchases and refinances combined) increased slightly by 0.8% on a non-seasonally adjusted (NSA) basis from December to $373,200. For purchase loans, the average size increased by 1.8% to $429,400, while refinance loans experienced a 5.4% decrease, reaching an average of $288,200. Adjustable-rate mortgages (ARMs) saw a continued decline in average loan size for three consecutive months, down 0.6% from $1.074 million to $1.068 million.

Discover more from Eye On Housing

Subscribe to get the latest posts sent to your email.


This article was originally published by a eyeonhousing.org . Read the Original article here. .


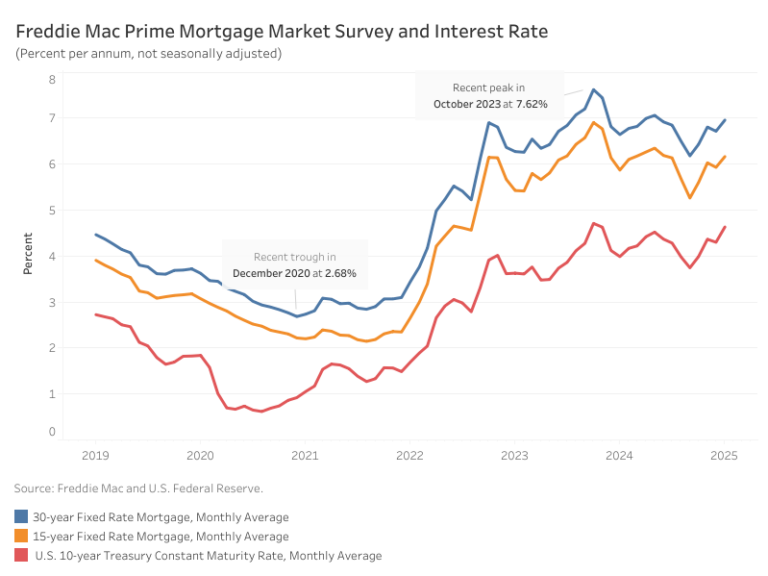
Mortgage rates edged higher in January, with the average 30-year fixed-rate mortgage reaching 6.96%. Rates had been climbing steadily since mid-December—even surpassing 7%—before easing in recent weeks as the bond market stabilized following news that President Donald Trump postponed tariffs plans to February 1.

According to Freddie Mac, the average rate for a 30-year fixed-rate mortgage rose 24 basis points (bps) from December, extending a two-year trend of fluctuations between 6% and 7%. Meanwhile, the 15-year fixed-rate mortgage increased 23 bps to land at 6.13%.

The 10-year Treasury yield, a key benchmark for mortgage rates, averaged 4.63% in November—33 basis points higher than December’s average. A strong economy, coupled with ongoing uncertainty over inflation due to tax cuts and tariffs, continues to put upward pressure on yields. This uncertainty is also reflected in the increased range for the projected 2025 core PCE inflation in the December FOMC economic projections, now estimated between 2.1% and 3.2%, compared to a narrower 2.1% to 2.5% range in September.

Discover more from Eye On Housing

Subscribe to get the latest posts sent to your email.


This article was originally published by a eyeonhousing.org . Read the Original article here. .

The Market Composite Index, a measure of mortgage loan application volume from the Mortgage Bankers Association’s (MBA) weekly survey, increase marginally by 2.9% month-over-month on a seasonally adjusted (SA) basis. Compared to December 2023, the index is higher by 10.2%. The Market Composite Index includes the Purchase and Refinance Indices, which saw monthly gains of 4.1% and 6.7% (SA), respectively. On a year-over-year basis, the Purchase Index showed a modest increase of 1.1%, while the Refinance Index is 31.7% higher.

The average 30-year fixed rate mortgage reported in the MBA survey for December remained relatively stable at 6.82% (index level 682), reflecting a minor decline of 0.4 basis points. This rate is 9 basis points lower than the same period last year.

Average loan sizes, excluding refinance loans, saw slight declines in December. On a non-seasonally adjusted (NSA) basis, the average loan size (purchases and refinances combined) fell by 2.1% from November to $370,300. For purchase loans, the average size decreased by 3.3% to $421,800, while refinance loans experienced a 4.8% increase, reaching an average of $304,500. Adjustable-rate mortgages (ARMs) also saw a marginal decline in loan size, down 0.8% from $1.08 million to $1.07 million.

Discover more from Eye On Housing

Subscribe to get the latest posts sent to your email.


This article was originally published by a eyeonhousing.org . Read the Original article here. .

The Market Composite Index, a measure of mortgage loan application volume by the Mortgage Bankers Association’s (MBA) weekly survey, decreased 14.5%, month-over-month, in November on a seasonally adjusted (SA) basis. The slowdown in mortgage activity can be attributed to higher mortgage rates as the ten-year Treasury yield increased in November, reflecting uncertainties surrounding the elections.

The market decline was reflected primarily in the Refinance Index (SA), which decreased by 33.2% month-over-month. Meanwhile, the Purchase Index (SA) showed a modest increase of 2.7% over the same period. However, compared to October 2023, the Market Composite Index is up by 16.4%, with the Purchase Index seeing a slight 4.8% increase and the Refinance Index higher by 45.9%.

The average contract rate for 30-year fixed mortgage rate per the MBA survey for November averaged at 6.8%, 29 basis points (bps) higher month-over-month in response to a higher ten-year Treasury rate.

Loan size metrics also reflected market adjustments. The average loan size for the total market (including purchases and refinances) shrank 2.9% month-over-month on a non-seasonally adjusted (NSA) basis, decreasing from $389,800 to $378,400. Loan sizes for purchasing and refinancing decreased. Purchase loans averaged $436,200, down 2.7% from $448,300, while refinance loans saw a sharper 9.9% decrease, with the average loan size falling from $322,500 to $290,600. Adjustable-rate mortgages (ARMs) also declined 6.0%, from $1.15 million to $1.08 million.

Discover more from Eye On Housing

Subscribe to get the latest posts sent to your email.


This article was originally published by a eyeonhousing.org . Read the Original article here. .


Mortgage rates climbed in November, driven by market volatility and a surge in Treasury yields following the recent elections. On the day after the election results, the 10-year Treasury yield spiked by 14 basis points (bps), setting the stage for further rate increases throughout the month.

According to Freddie Mac, the average rate for a 30-year fixed-rate mortgage increased 38 basis points from October, reaching 6.81%. Meanwhile, the 15-year fixed-rate mortgage saw an even steeper increase of 43 bps to land at 6.03%.

The 10-year Treasury yield, a key benchmark for mortgage rates, averaged 4.37% in November—38 bps higher than October’s average. This increase reflected heightened market uncertainty and persistent volatility. Looking ahead, the Federal Reserve is set to meet on December 17-18 to evaluate the possibility of another rate cut. Since the federal funds rate influences interest rates, a rate cut could potentially ease long-term mortgage rates, but this decision will hinge on the latest employment and inflation data, and other macroeconomic factors that could have an upward pressure on inflation including larger government deficits and higher tariffs. NAHB forecasts additional declines to the federal funds rate into a range below 4%.

Discover more from Eye On Housing

Subscribe to get the latest posts sent to your email.


This article was originally published by a eyeonhousing.org . Read the Original article here. .


Total outstanding U.S. consumer debt stood at $5.10 trillion for the third quarter of 2024, increasing at an annualized rate of 3.28% (seasonally adjusted), according to the Federal Reserve’s G.19 Consumer Credit Report. In general, consumer debt has been slowing over the past two years, peaking at a high rate of 9.16% in the second quarter of 2022. However, the third quarter of 2024 experienced an uptick in growth from the previous quarter’s rate of 1.14%. 

The G.19 report excludes mortgage loans, so the data primarily reflects consumer debt in the form of student loans, auto loans, and credit card debt. As consumer spending has outpaced personal income, savings rates have been declining and consumer debt has increased. Previously, consumer debt growth had been slowing, as high inflation and rising interest rates led people to reduce their borrowing. However, the growth rate ticked up in the latest quarter, possibly reflecting expectations of rate cuts that took place at the quarter’s end. 

Nonrevolving Debt

Nonrevolving debt, largely driven by student and auto loans, reached $3.75 trillion (SA) in the third quarter of 2024, marking a 3.46% increase at a seasonally adjusted annual rate (SAAR). This growth rate is notably higher than in the previous six quarters, all of which remained below 2.5%. 

Student loan debt balances stood at $1.77 trillion (NSA) for the third quarter of 2024. Year-over-year, student loan debt rose 2.41%, the largest yearly increase since the third quarter of 2021. This shift partially reflects the expiration of the COVID-19 Emergency Relief for student loans’ 0-interest payment pause that ended September 1, 2023. 

Auto loans, meanwhile, totaled $1.57 trillion, with a year-over-year increase of only 0.96%—the slowest rate since 2010. This deceleration can be attributed to multiple factors, including tighter lending standards, higher loan rates, and overall inflation. Auto loan interest rates reached 8.40% (for a 60-month new car) in the third quarter of 2024, marking the highest rate since the data series began. Although the Federal Reserve has begun cutting rates, auto loan rates tend to respond more slowly and are less directly influenced by these cuts.  

Revolving Debt

Revolving debt, primarily credit card debt, reached $1.36 trillion (SA) in the third quarter, rising at an annualized rate of 2.79%. This marked a slight increase from the second quarter’s 2.58% rate but was notably down from the peak growth rate of 17.58% seen in the first quarter of 2022. The surge in credit card balances in early 2022 was accompanied by an increase in credit card rates which climbed by 4.51 percentage points over 2022. This was an exceptionally steep increase, as no other year in the past two decades had seen a rate jump of more than two percentage points.  

Comparatively, so far in 2024 the credit card rate increased 0.17 percentage points. For the third quarter of 2024, the average credit card rate held by commercial banks (NSA) reached a historic high (since data has been recorded) of 21.76%, an increase from 21.51% last quarter.   

Discover more from Eye On Housing

Subscribe to get the latest posts sent to your email.


This article was originally published by a eyeonhousing.org . Read the Original article here. .

The Fed cut the short-term federal funds rate by an additional 25 basis points at the conclusion of its November meeting, reducing the top target rate to 4.75%. However, while the Fed noted it is making progress to its 2% inflation target, it did not provide post-election guidance on the pace and ultimate path for future interest rate cuts. The bond market is not waiting, with the 10-year Treasury rate rising from 3.6% in mid-September to close to 4.3% due to changing growth and government deficit expectations.

Today’s statement from the Fed noted:

“Recent indicators suggest that economic activity has continued to expand at a solid pace. Since earlier in the year, labor market conditions have generally eased, and the unemployment rate has moved up but remains low. Inflation has made progress toward the Committee’s 2 percent objective but remains somewhat elevated.

The Committee seeks to achieve maximum employment and inflation at the rate of 2 percent over the longer run. The Committee judges that the risks to achieving its employment and inflation goals are roughly in balance. The economic outlook is uncertain, and the Committee is attentive to the risks to both sides of its dual mandate.”

Inflation risks for 2025 are evolving. The policy risks for the central bank had recently been between inflation (decreasing risks) and concerns regarding the health of the labor market (risks rising). However, the 2024 election result changes this outlook somewhat. In particular, the election increases the probability of additional economic growth, a tighter labor market, larger government deficits, and higher tariffs. All of these factors can be inflationary, even if they yield other macroeconomic benefits.

Consequently, the Fed will need to recalibrate its economic and policy outlook given the large number of changes that markets have digested in just the past week alone. In particular, how far will the Fed ultimately cut into 2025 and perhaps 2026? A 3% terminal federal funds rate is unlikely. Some commentators have suggested a 4% rate would at least be a threshold of reevaluation. NAHB’s outlook is for a terminal rate of 3.25%, perhaps 3.5%. However, that decision, or destination, will be dependent on factors like tariff adoption.

Markets and analysts will receive additional information at the conclusion of the December Fed meeting, which will include an update of the central bank’s Summary of Economic Projections. Given the election discussion, is worth noting that the Fed does not try to anticipate changes to future fiscal policy. The Fed will study and model anticipated changes, but such impacts would not be formally incorporated into the Fed’s outlook until such proposals are, at the very least, fully detailed and analyzed. All market participants should be aware that rising government debt levels will push nominal long-term interest rates higher.

While the question of the future policy path matters for long-term interest rates, there is a direct benefit to current easing like today’s rate cut. For example, the November rate reduction will be felt for builder and land developer loan conditions. Interest rates for such loans should move lower by approximately 25 in the coming weeks.

A reduction for the cost of builder and developer loans is a bullish sign for housing affordability. The pace of overall inflation has remained elevated due to the growth of housing/construction costs and elevated measures of shelter inflation, which can only be tamed in the long-run by increases in housing supply. Fed Chair Powell has previously noted it will take some time for rent cost growth to slow. Given recent tight financing conditions, however, the Fed noted that while consumer spending is resilient, “…activity in the housing sector has been weak.”

All things considered, with inflation having moved lower (the September core PCE measure of inflation is at 2.7%, down from 3.7% a year ago), there is clearly policy room for future rate reductions as the Fed normalizes monetary policy. A further cut to the federal funds rate in December, to a 4.5% top rate, seems likely. After that, given expected changes for fiscal policy and fiscal policy impacts, the Fed is likely to slow its pace of rate cuts, perhaps moving to one 25 basis point cut per quarter in 2025 to the ultimate terminal rate. As noted earlier, the level of this terminal rate is likely to be reevaluated in the coming months.

Discover more from Eye On Housing

Subscribe to get the latest posts sent to your email.


This article was originally published by a eyeonhousing.org . Read the Original article here. .
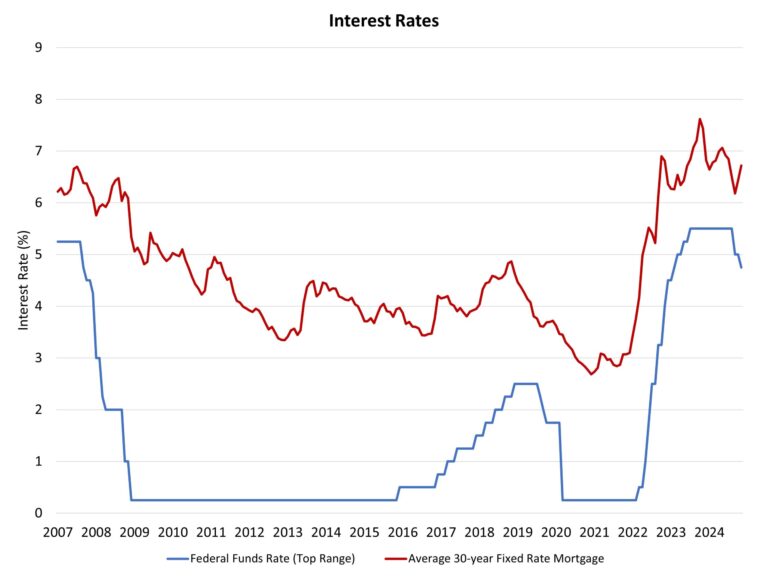

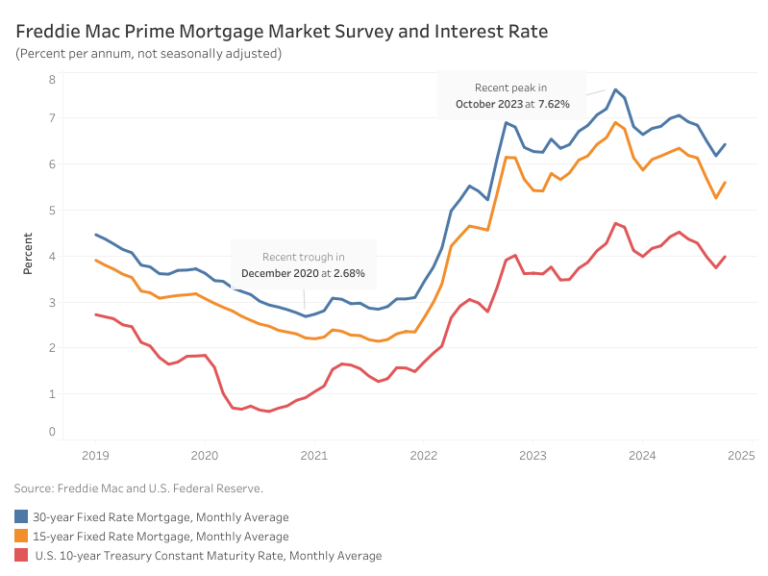
In October, mortgage rates reversed their recent downward trajectory, returning to levels two months earlier. According to Freddie Mac, the average rate for a 30-year fixed-rate mortgage increased 25 basis points (bps) from September to 6.18%. The 15-year fixed-rate mortgage saw an even steeper increase of 34 bps to land at 5.60%.

These increases coincided with heightened volatility in the 10-year Treasury yield, which jumped 38 bps over the month, moving from 3.72% in September to 4.10%. This spike followed a weaker-than-expected labor report driven by the disruptions from two hurricanes, as well as the Boeing strike, and the 2024 election.

However, the largest part of the increase for interest rates is due to growing, post-election concerns over budget deficits. NAHB will be revising its interest rate outlook as the final election results are determined and the fiscal policy position comes into focus. Nonetheless, long-term interest rates have increased since September due to election developments.

Discover more from Eye On Housing

Subscribe to get the latest posts sent to your email.


This article was originally published by a eyeonhousing.org . Read the Original article here. .

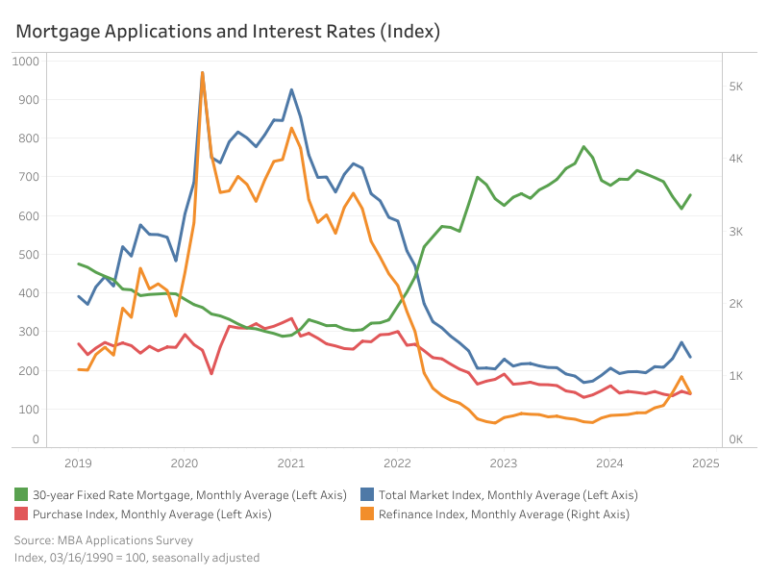
The Market Composite Index, a measure of mortgage loan application volume by the Mortgage Bankers Association’s (MBA) weekly survey, decreased 13.9% month-over-month on a seasonally adjusted (SA) basis due to higher mortgage rates. This decline was reflected in both the Purchase and Refinance Indices, which fell by 4.4% and 23%, respectively. However, compared to October 2023, the Market Composite Index is up by 39%, with the Purchase Index seeing a slight 1.9% increase and the Refinance Index higher by 149.9%.

The average 30-year fixed mortgage rate reversed its downward trajectory with an increase of 36 basis points (bps), following volatility in the ten-year Treasury yield. This brought the rate back to around the same level as it was in August at 6.53%. However, compared to its peak last October, the current rate is 125 bps lower.

The average loan size for the total market (including purchases and refinances) was $390,225 on a non-seasonally adjusted (NSA) basis, a decrease of 2.6% from September. Purchase loans grew by 2.1% to an average of $448,675, while refinance loans declined by 11.3% to $323,750. Adjustable-rate mortgages (ARMs) saw a modest decrease of 3.4% in average loan size from $1.19 million to $1.15 million.

Discover more from Eye On Housing

Subscribe to get the latest posts sent to your email.


This article was originally published by a eyeonhousing.org . Read the Original article here. .
Pin It