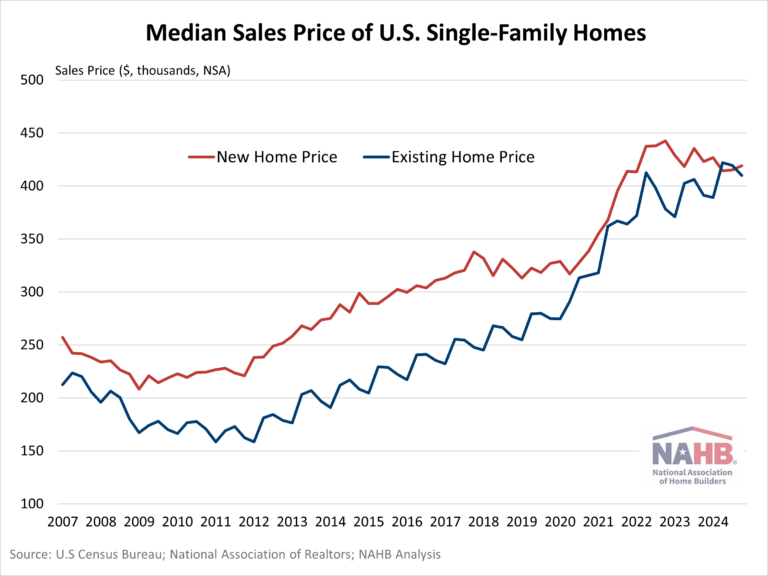
The traditional price gap between new and existing homes was nearly nonexistent at the end of 2024. The median price for a new single-family home sold in the fourth quarter of 2024 was $419,200, a mere $9,100 above the existing home sales price of $410,100, according to U.S. Census Bureau and National Association of Realtors data (not seasonally adjusted – NSA).
Typically, new homes carry a price premium over existing homes. However, for the first time in the quarterly data since 1989, the median existing home price exceeded the new home price in the second quarter of 2024, and again in the third quarter of 2024. The average price premium of new home sales over existing home sales for 2024 was $8,725. To put this into perspective, 2023’s premium average was $33,750 and the 10-year average is $50,657.
Both new and existing homes saw dramatic price increases post-pandemic due to higher construction costs and limited supply. Although overall home prices remain elevated compared to historical norms, new home prices have moderated due to builder business decisions, while existing home prices continue to increase due to lean supply.
The median price for a single-family new home sold in the fourth quarter of 2024 decreased by 0.95% from the previous year. New home prices have continued to decline year-over-year for the previous seven quarters.
Meanwhile, the median price for existing single-family homes increased 4.80% from one year ago. Existing home prices have continued to experience year-over-year increases for six consecutive quarters.
There are several factors as to why new and existing homes are selling at similar price points. Tight inventory continues to push up prices for existing homes, as many homeowners who secured low mortgage rates during the pandemic are hesitant to sell due to current high interest rates.
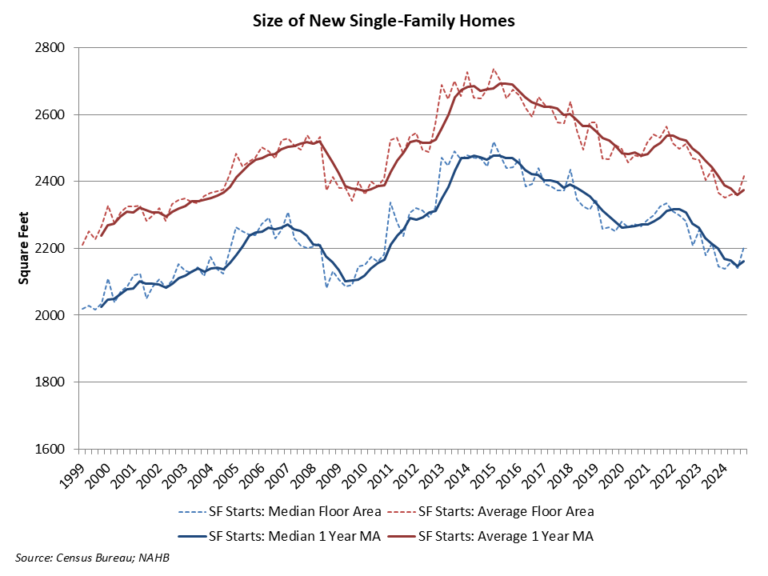
Meanwhile, new home pricing is more volatile – prices change due to the types and locations of homes being built. Despite various challenges facing the industry, home builders are adapting to affordability challenges by selling smaller lots, constructing smaller homes, and offering incentives.
Additionally, there has been a shift in home building toward the South, associated with less expensive homes because of policy effects. In the fourth quarter of 2024, the percentage of new homes sold in the South was 63%, compared to 44% of existing homes (NSA).
The least expensive region for homes in the fourth quarter was the Midwest, with a median price of $368,000 for new homes and $304,800 for existing homes. The South followed closely, with a median new home price of $377,200 and an existing home price of $366,800. New homes were most expensive in the Northeast with a median price of $798,000, while the West sold at $560,000. However, for existing homes, the West led as the most expensive region at $633,500 homes, followed by the Northeast at $487,900.
The new home price premium was most pronounced in the Northeast, where new homes sold for $310,900 more than existing homes. In contrast, the South saw little difference with a modest $10,400—similar to the national trend. Uniquely, this pattern reversed in the West, where existing homes were $72,600 more than new homes.
Discover more from Eye On Housing
Subscribe to get the latest posts sent to your email.
This article was originally published by a eyeonhousing.org . Read the Original article here. .






The Federal Housing Administration backs several home renovation loan options offered through private lenders.
If your renovation goal is to make your home more livable, useful, accessible or energy-efficient, you might qualify for a Title 1 fixed-rate loan. The maximum loan amount for a single-family home is $25,000, and amounts less than $7,500 are usually unsecured. The payout is a lump sum, and the interest rate is fixed.
If you need to borrow more than $25,000, you might qualify for a 203(k) loan (for major work). This combines a renovation loan with a mortgage. A portion of the loan goes toward purchasing the home, and the rest is paid to the contractor as needed. The interest rate can be fixed or variable.