Tag

home sales and prices

Browsing


Home buyers moved off the sidelines in September following the Federal Reserve’s recent move to cut interest rates for the first time in four years. 

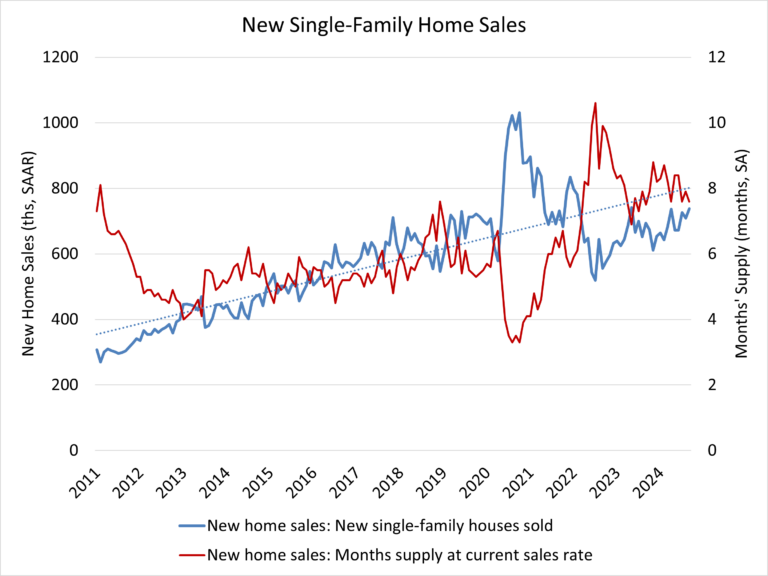
Sales of newly built, single-family homes in September increased 4.1% to a 738,000 seasonally adjusted annual rate from a downwardly revised August number, according to newly released data from the U.S. Department of Housing and Urban Development and the U.S. Census Bureau. The pace of new home sales in September is up 6.3% compared to a year earlier.

Despite challenging affordability conditions, home builder confidence edged higher in October as they anticipate that mortgage rates will gradually, in an uneven manner, moderate in the coming months. There is a significant need for additional housing supply, as many prospective home buyers are entering the market.

Following the Fed’s actions in September, mortgage rates fell to 6.18%, from 6.5% in August. However, new home sales will likely weaken in October due to a recent rise in long-term rates.

A new home sale occurs when a sales contract is signed, or a deposit is accepted. The home can be in any stage of construction: not yet started, under construction or completed. In addition to adjusting for seasonal effects, the September reading of 738,000 units is the number of homes that would sell if this pace continued for the next 12 months.

New single-family home inventory in September remained elevated at a level of 470,000, up 8.0% compared to a year earlier. This represents a 7.6 months’ supply at the current building pace. Completed for-sale new homes rose to 108,000, the highest level since 2009.

The median new home sale price in September was $426,300, essentially unchanged from a year ago. The Census data reveals a gain for new home sales priced below $300,000, which made up 17% of new home sales in September, compared to 14% a year ago.

Regionally, on a year-to-date basis, new home sales are up 19.2% in the Midwest, 1.1% in the South and 3.4% in the West. New home sales are down 1.1% in the Northeast.

Discover more from Eye On Housing

Subscribe to get the latest posts sent to your email.


This article was originally published by a eyeonhousing.org . Read the Original article here. .

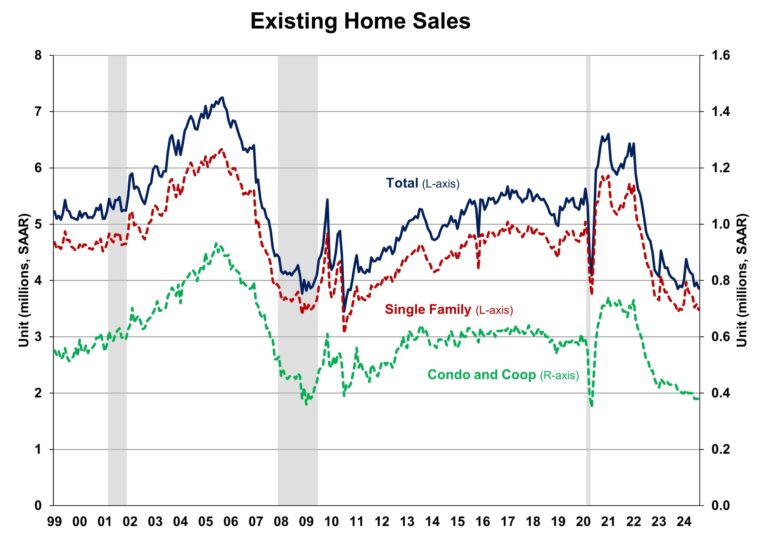
Despite recent easing mortgage rates and improved inventory, existing home sales fell to a 14-year low in September as elevated home prices are causing potential buyers to hold out for lower rates, according to the National Association of Realtors (NAR). Sales remained sluggish as the lock-in effect kept home prices elevated. However, we expect increased activity in the coming months as mortgage rates moderate with additional Fed easing. Improving inventory should help slow home price growth and enhance affordability.

Homeowners with lower mortgage rates have opted to stay put, avoiding trading existing mortgages for new ones with higher rates. This trend is driving home prices higher and holding back inventory. With the Federal Reserve beginning its easing cycle at the September meeting, mortgage rates are expected to gradually decrease, leading to increased demand and unlocking lock-in inventory in the coming quarters.

Total existing home sales, including single-family homes, townhomes, condominiums, and co-ops, fell 1.0% to a seasonally adjusted annual rate of 3.84 million in September, the lowest level since October 2010. On a year-over-year basis, sales were 3.5% lower than a year ago.

The first-time buyer share remained at 26% in September, matching the lowest level since November 2021 and August 2024, but down from 27% in September 2023.

The existing home inventory level rose from 1.37 million in August to 1.39 million units in September and is up 23.0% from a year ago. At the current sales rate, September unsold inventory sits at a 4.3-months supply, up from 4.2-months last month and 3.4-months a year ago. This inventory level remains low compared to balanced market conditions (4.5 to 6 months’ supply) and illustrates the long-run need for more home construction. However, the count of single-family resale homes available for sale is up almost 22.2% on a year-over-year basis.

Homes stayed on the market for an average of 28 days in September, up from 26 days in August and 21 days in September 2023.

The September all-cash sales share was 30% of transactions, up from 26% in August and 29% a year ago. All-cash buyers are less affected by changes in interest rates.

The September median sales price of all existing homes was $404,500, up 3.0% from last year. This marked the 15th consecutive month of year-over-year increases and the highest level for the month of September. The median condominium/co-op price in September was up 2.2% from a year ago at $361,600. This rate of price growth will slow as inventory increases.

Existing home sales in September were mixed across the four major regions. In the Northeast, Midwest, and South, sales fell by 4.2%, 2.2%, and 1.7%, respectively, while sales in the Midwest rose by 4.1%. On a year-over-year basis, sales decreased in the Northeast (-6.1%), Midwest (-5.3%) and South (-5.5%). Sales in the West increased 5.6% from a year ago.

The Pending Home Sales Index (PHSI) is a forward-looking indicator based on signed contracts. The PHSI rose from 70.2 to 70.6 in August due to lower mortgage rates. On a year-over-year basis, pending sales were 3.0% lower than a year ago per National Association of Realtors data.

Discover more from Eye On Housing

Subscribe to get the latest posts sent to your email.


This article was originally published by a eyeonhousing.org . Read the Original article here. .


Expectations of the Federal Reserve beginning the first in a series of rate reductions kept potential home buyers in a holding pattern in August.

Sales of newly built, single-family homes in August fell 4.7% after an unusually strong July, according to newly released data from the U.S. Department of Housing and Urban Development and the U.S. Census Bureau.  August new home sales registered a 716,000 seasonally adjusted annual rate, after an upwardly revised estimate of 751,000 for July.

Despite the slip in August, the three-month moving average for new home sales is at its highest level since March of 2022. New home sales are up 4% on a year-to-date basis through August.

Builder sentiment and future sales expectations are improving as the Federal Reserve begins a credit easing cycle. However, due to the mortgage interest lock-in effect, declining interest rates will mean rising existing home inventories and some additional new competition for home builders.

While a 7.8 months’ supply may be considered elevated in normal market conditions, there is currently only a 4.1 months’ supply of existing single-family homes on the market. Combined, new and existing total months’ supply remains below historic norms at approximately 4.7, although this measure is expected to increase as more home sellers test the market in the months ahead.

A new home sale occurs when a sales contract is signed, or a deposit is accepted. The home can be in any stage of construction: not yet started, under construction or completed. In addition to adjusting for seasonal effects, the August reading of 716,000 units is the number of homes that would sell if this pace continued for the next 12 months.

New single-family home inventory increased 1.7% to 467,000 in August, a 7.8 months’ supply at the current sales pace.  Completed, ready to occupy inventory increased to 105,000 homes, which is the highest level since 2009. However, this share makes up only 22% of new home inventory.

Median new home price fell back to $420,600, down 4.6% from a year ago due to builder price incentives amid multidecade highs for housing affordability challenges. The Census data reveals a gain for new home sales priced below $300,000, which made up 18% of new home sales in August compared to 12% a year ago.

Regionally, on a year-to-date basis, new home sales are up in all four regions, rising 2.1% in the Northeast, 21.9% in the Midwest, 0.8% in the South and 4.7% in the West.

Discover more from Eye On Housing

Subscribe to get the latest posts sent to your email.


This article was originally published by a eyeonhousing.org . Read the Original article here. .


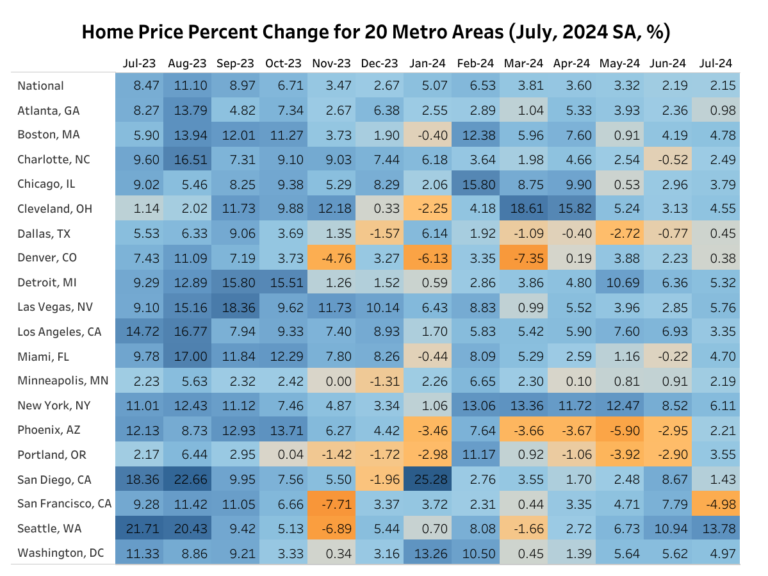
Home prices remain elevated but price growth continues to decelerate, according to the S&P CoreLogic Case-Shiller Home Price Index (HPI) recent release. The S&P CoreLogic Case-Shiller HPI (seasonally adjusted) reached its 14th monthly consecutive record high in July 2024. The index increased at a seasonally adjusted annual rate of 2.15%, down slightly from a revised June rate of 2.19%. This rate has slowed over the past six months, from a high of 6.53% in February 2024. The index has not seen an outright decrease since January of 2023 (nineteen months).

Separately, the House Price Index released by the Federal Housing Finance Agency (FHFA; SA) posted its sixth monthly consecutive record high, after having decreased slightly in January of this year. The FHFA HPI recorded a 1.57% increase in July, upward from a revised 0.03% rate in June.  

Year-Over-Year  

Home prices experienced a fifth consecutive year-over-year declaration in July, tabulated by both indexes. The S&P CoreLogic Case-Shiller HPI (not seasonally adjusted – NSA) posted a 4.96% annual gain in July, down from a revised 5.50% increase in June. Meanwhile, the FHFA HPI (NSA) index rose 4.56%, down from a revised 5.37% in June. Both indexes have seen yearly growth rates slow since February 2024, when the S&P CoreLogic Case-Shiller stood at 6.54% and the FHFA at 7.23%. 

By Metro Area

In addition to tracking national home price changes, the S&P CoreLogic Index (SA) also reports home price indexes across 20 metro areas. At an annual rate, only one out of 20 metro areas reported a home price decline: San Francisco at -3.10%. Among the 20 metro areas, 15 exceeded the national rate of 2.15%. Seattle had the highest rate at 13.78%, followed by New York at 6.11%, and Las Vegas at 5.76%. The monthly trends are shown in the graph below.  

Monthly, the FHFA HPI (SA) releases not only national but also census division house price indexes. Out of the nine census divisions, three posted negative monthly depreciation (adjusted to an annual rate) for July: South Atlantic at -7.88%, West South Central at -6.80%, and East South Central at -0.66%. The divisions with positive home price appreciation ranged from 2.02% in West North Central to 11.57% in East South Central. The FHFA HPI releases its metro and state data on a quarterly basis, which NAHB analyzed in a previous post. 

Discover more from Eye On Housing

Subscribe to get the latest posts sent to your email.


This article was originally published by a eyeonhousing.org . Read the Original article here. .

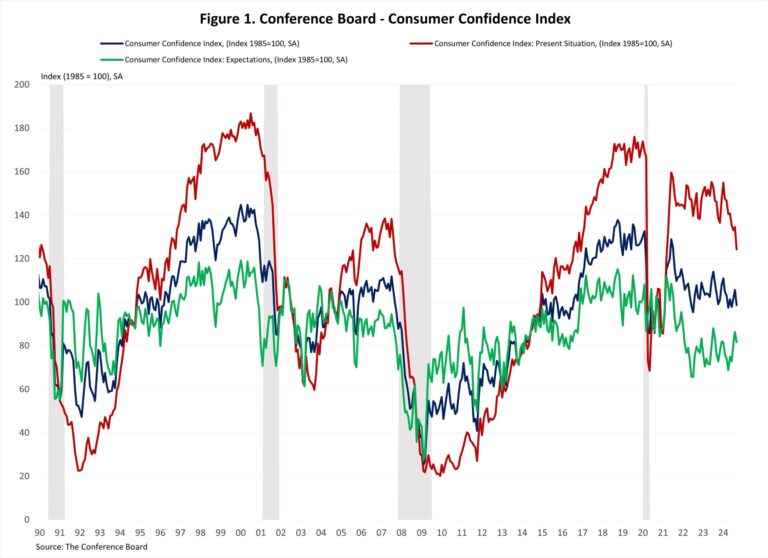
Consumer confidence fell to a 3-month low in September due to growing concerns about the job market, despite the labor market remaining healthy. Recent job growth revisions showed fewer jobs were added in 2023 than initially reported. However, the unemployment rate remained at a relatively low level and wage growth continued to outpace inflation. This suggests the labor market is cooling from its red-hot pace but remains steady. 

The Consumer Confidence Index, reported by the Conference Board, is a survey measuring how optimistic or pessimistic consumers feel about their financial situation. This index fell from 105.6 to 98.7 in September, the largest monthly decline since August 2021. The Consumer Confidence Index consists of two components: how consumers feel about their present situation and about their expected situation. The Present Situation Index decreased 10.3 points from 134.6 to 124.3, and the Expectation Situation Index fell 4.6 points from 86.3 to 81.7, but still remained above the 80 threshold. Historically, an Expectation Index reading below 80 often signals a recession within a year.

Consumers’ assessment of current business conditions turned negative in September. The share of respondents rating business conditions “good” decreased by 2.3 percentage points to 18.8%, while those claiming business conditions as “bad” rose by 2.9 percentage points to 20.2%. Consumers’ assessments of the labor market worsened as well. The share of respondents reporting that jobs were “plentiful” decreased by 1.8 percentage points to 30.9%, while those who saw jobs as “hard to get” increased by 1.5 percentage points to 18.3%.

Consumers were also less optimistic about the short-term outlook. The share of respondents expecting business conditions to improve fell from 19.1% to 18.5%, while those expecting business conditions to deteriorate rose from 14.5% to 16.6%. Similarly, expectations of employment over the next six months were less positive. The share of respondents expecting “more jobs” increased by 0.1 percentage points to 16.4%, and those anticipating “fewer jobs” climbed by 1.3 percentage points to 18.3%.

The Conference Board also reported the share of respondents planning to buy a home within six months. The share of respondents planning to buy a home rose to 5.7% in September. Of those, respondents planning to buy a newly constructed home increased slightly to 0.7%, while those planning to buy an existing home decreased to 2.4%.

Discover more from Eye On Housing

Subscribe to get the latest posts sent to your email.


This article was originally published by a eyeonhousing.org . Read the Original article here. .

Existing home sales fell to a 10-month low in August despite easing mortgage rates and improved inventory, according to the National Association of Realtors (NAR). Home sales remained sluggish as the lock-in effect kept home prices elevated. Meanwhile, the share of first-time buyer in August dropped to a record low. However, we expect increased activity in the coming months as mortgage rates continue to moderate. Improving inventory is likely to ease home price growth and enhance affordability.

Homeowners with lower mortgage rates have opted to stay put, avoiding trading existing mortgages for new ones with higher rates. This trend is driving home prices higher and holding back inventory. With the Federal Reserve beginning its easing cycle at the September meeting, mortgage rates are expected to gradually decrease, leading to increased demand and unlocking lock-in inventory in the coming quarters.

Total existing home sales, including single-family homes, townhomes, condominiums, and co-ops, fell 2.5% to a seasonally adjusted annual rate of 3.86 million in August, the lowest level since October 2023. On a year-over-year basis, sales were 4.2% lower than a year ago.

The first-time buyer share dropped to 26% in August, the lowest level since November 2021, down from 29% in both July and August 2023.

The existing home inventory level rose from 1.34 million in July to 1.35 million units in August and is up 22.7% from a year ago. At the current sales rate, August unsold inventory sits at a 4.2-months supply, up from 4.1-months last month and 3.3-months a year ago. This inventory level remains low compared to balanced market conditions (4.5 to 6 months’ supply) and illustrates the long-run need for more home construction. However, the count of single-family resale homes available for sale is up almost 21.4% on a year-over-year basis.

Homes stayed on the market for an average of 26 days in August, up from 24 days in July and 20 days in August 2023.

The August all-cash sales share was 26% of transactions, down from 27% in both July and a year ago. All-cash buyers are less affected by changes in interest rates.

The August median sales price of all existing homes was $416,700, up 3.1% from last year. This marked the 14th consecutive month of year-over-year increases. The median condominium/co-op price in August was up 3.5% from a year ago at $366,500. This rate of price growth will slow as inventory increases. Existing home sales in August were mixed across the four major regions. In the Northeast, South, and West, sales fell by 2.0%, 3.9%, and 2.7%, respectively, while sales in the Midwest remained unchanged. On a year-over-year basis, sales decreased in the Midwest (-5.2%), South (-6.0%) and West (-1.4%). Sales in the Northeast were unchanged from a year ago.

The Pending Home Sales Index (PHSI) is a forward-looking indicator based on signed contracts. The PHSI fell from 74.3 to 70.2 in July due to persistent affordability challenges. On a year-over-year basis, pending sales were 8.5% lower than a year ago per National Association of Realtors data.

Discover more from Eye On Housing

Subscribe to get the latest posts sent to your email.


This article was originally published by a eyeonhousing.org . Read the Original article here. .

House price appreciation was recorded in all 50 states and the District of Columbia. Limited resale inventory and strong growth in demand continued to put upward pressure on house prices.

Nationally, house prices grew at a relatively slower pace, compared to double-digit annual growth during the COVID-19 pandemic. According to the quarterly all-transactions House Price Index (HPI) released by the Federal Housing Finance Agency (FHFA), U.S. house prices rose 5.9% in the second quarter of 2024, compared to the second quarter of 2023. This rate of price growth decreased from 6.4% in the first quarter of 2024.

The quarterly FHFA HPI not only reports house prices at the national level, but it also provides insights about house price fluctuations at the state and metro area levels. The FHFA HPI used in this article is the all-transactions index, measuring average price changes in repeat sales or refinancings on the same single-family properties.  

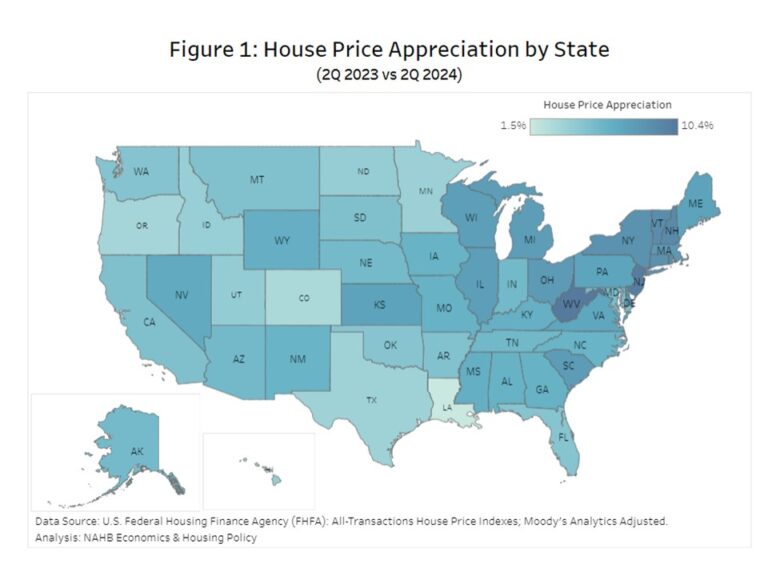
Between the second quarter of 2023 and the second quarter of 2024, all 50 states and the District of Columbia had positive house price appreciation, ranging from 1.5% to 10.4%. West Virginia led the way with the highest price appreciation (+10.4%). It was followed by New Jersey with a 10.1% gain, and New Hampshire with a 9.1% gain. Meanwhile, Louisiana had the lowest price growth (+1.5%). Among all 50 states and the District of Columbia, 28 states exceeded the national growth rate of 5.9%. Compared to the first quarter of 2024, thirty-five out of the 50 states had a deceleration in house price appreciation in the second quarter.

House prices have changed unevenly across U.S. metro areas, from the second quarter of 2023 to the second quarter of 2024. House price appreciation ranged from -4.6% to +20.7%. In the second quarter of 2024, 14 metro areas, in reddish color on the map above, had negative house price appreciation, while the remaining 370 metro areas experienced positive price appreciation.

Meanwhile, house prices in the second quarter of 2024 are much higher than they were before the pandemic. Nationally, house prices rose 49.7% between the first quarter of 2020 and the second quarter of 2024. More than half of the metro areas saw house prices rise by more than the national price growth rate of 49.7%. Among all the metro areas, house price appreciation ranged from 13.8% to 81.0%. House prices in the South and the West have grown faster than the prices in the Midwest and Northeast. Within the top 20 metro areas that had the highest house price appreciation, 11 metro areas are in the South Atlantic Division and six in the East South Central Division, while none were in the Midwest.

Discover more from Eye On Housing

Subscribe to get the latest posts sent to your email.


This article was originally published by a eyeonhousing.org . Read the Original article here. .

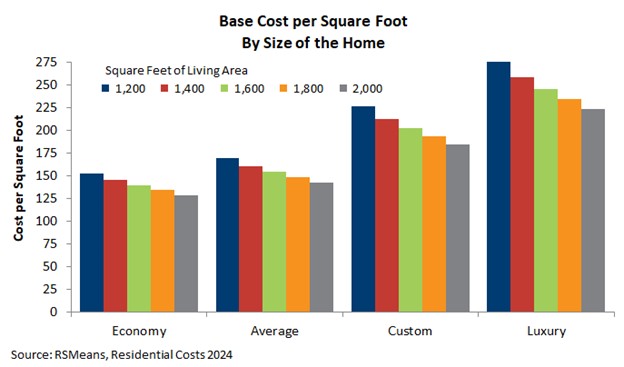
The cost per square foot of a single-family home declines systematically as the home becomes larger, according to NAHB analysis of two recent data sources. In microeconomics, unit costs that decline as a business operation increases in size are called economies of scale.

In home building, economies of scale may exist in several forms. It is conceivable, for instance, that homes cost less if they are built in larger subdivisions, or by larger companies, where design costs may be spread over a large number of production units. This post, however, focuses on economies of scale at the level of an individual home. In other words, does cost per square foot decline, all else equal, as a home increases in size?

The answer is yes, according to NAHB tabulation of data from the Survey of Construction (conducted by the U.S. Census Bureau with partial funding from the Department of Housing and Urban Development). Last Friday’s post reported on how the sale price per square foot of new single-family detached homes varies across time and geography. The chart below shows how it varies with the size of the home (measured in square footage of finished floor space). It is easy to see that the median price declines systematically, from a high of $200 per square foot for homes under 1,200 square feet to a low of only $132 per square foot for homes with 5,000 square feet or more.

There could be several reasons for this. A conventional explanation is that some components of construction cost—for example, design, regulatory and waste disposal costs—may be more or less fixed and not change much with house size.

The above sale price numbers are calculated after subtracting the value of the improved lot, but do not otherwise control for differences in quality or amenities present in the homes. One of the private services that does carefully control for quality and amenities when estimating construction costs per square foot is RSMeans. The chart below shows the base cost per square foot for a two-story home in each of the four RSMeans quality tiers: Economy, Average, Custom and Luxury.

Within each tier, characteristics of the home (other than square footage) are held constant. The “Average” two-story home, for instance, has a simple design from standard plans, no basement, a kitchen, single full bathroom, asphalt shingles on the roof, wood framing, wood siding, gypsum wallboard interior, and average quality materials and workmanship. As in the previous chart, cost per square foot declines systematically as the house gets bigger. Although the rate of decline varies, at the low end of the size scale, doubling the size of the home reduces the base cost per square foot by somewhere in the neighborhood of 30 percent. Interested readers may consult RSMeans for further details.

The bottom line is that economies of scale are ubiquitous in new single-family homes throughout both the Census sale price and private cost estimating data. This is significant due to the volume of queries NAHB fields about construction costs. Almost invariably, the queries ask for cost per square foot. To avoid large errors, it is important the requesters realize that the number will change depending on the size of the home. If you apply cost per square foot for a 3,000 square-foot home to a home with only 1,500 square feet, for instance, you will drastically underestimate the home’s total cost. Ideally, this post will be able to serve as a reference in these situations.

Discover more from Eye On Housing

Subscribe to get the latest posts sent to your email.


This article was originally published by a eyeonhousing.org . Read the Original article here. .

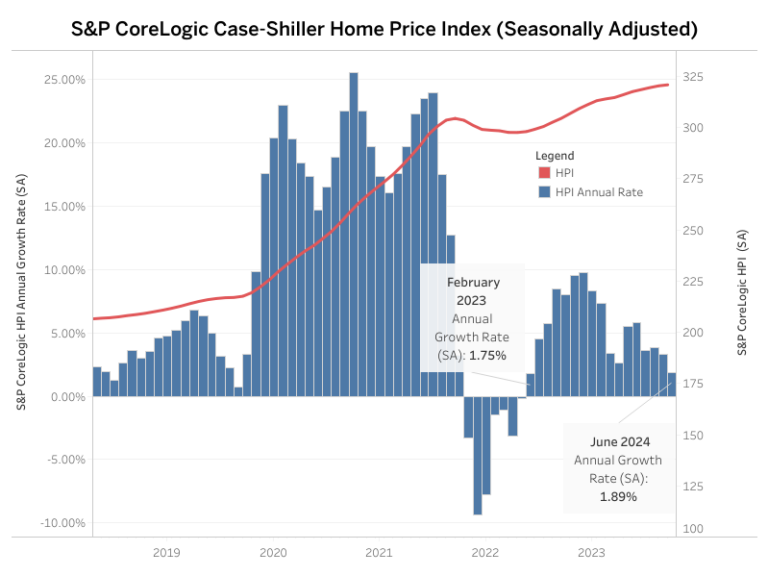
Home price growth continues to decelerate, according to the recent release of the S&P CoreLogic Case-Shiller Home Price Index (HPI). The S&P CoreLogic Case-Shiller HPI increased at a seasonally adjusted annual rate of 1.89% for June 2024, slowing from a revised rate of 3.28% in May. Home prices have not seen an outright decrease since January of 2023. However, 1.89% is the smallest growth in prices since February of 2023. Additionally, the growth rate has shown a generally declining trend since a peak of 9.76% in August 2023.

Meanwhile, the Home Price Index released by the Federal Housing Finance Agency (FHFA; SA), recorded a decline in home prices for June. The index declined at an annual rate of -1.04% for June, decreasing from a revised 0.51% rate in May. The FHFA Index has experienced just one other decrease since August of 2022, with a decline of -1.03% in January 2024.

Year-Over-Year

Home prices experienced a fourth year-over-year deceleration in June, tabulated by both indexes. The S&P CoreLogic Case-Shiller HPI (not seasonally adjusted – NSA) posted a 5.42% annual gain in June, down from a 5.94% increase in May. Since June of 2023, the index has seen steady increases in the year-over-year growth rate. However, this growth rate began slowing in March of 2024 and has continued to decelerate through June. Meanwhile, the FHFA HPI (NSA) index rose 5.23%, down from 5.95% in May. This rate has decelerated from 7.19% in February.

By Metro Area

In addition to tracking national home price changes, the S&P CoreLogic Index (NSA) also reported home price indexes across 20 metro areas in May. At an annual rate, five out of 20 metro areas reported home price declines: Phoenix at -3.02%, Portland at -2.90%, Dallas at -0.69%, Charlotte at -0.56%, and Miami at -0.03%. Among the 20 metro areas, thirteen exceeded the national rate of 1.89%. Seattle had the highest rate at 10.80%, followed by San Diego at 9.18%, and then Los Angeles at 7.89%. The monthly trends are shown in the graph below.

By Census Division

Monthly, the FHFA HPI (SA) releases not only national data but census division data as well. Out of the nine census divisions, seven posted negative monthly depreciation (adjusted to an annual rate) for June, ranging from -7.59% in the Mountain division to -0.82% in the Middle Atlantic. The remaining two divisions with positive home price appreciation were East South Central at 8.66% and the South Atlantic at 3.09%. The FHFA HPI releases its metro and state data on a quarterly basis, which NAHB analyzes in a previous post.

Discover more from Eye On Housing

Subscribe to get the latest posts sent to your email.


This article was originally published by a eyeonhousing.org . Read the Original article here. .

Sales of new homes rose unexpectedly in July, following significant revisions in the previous months data.

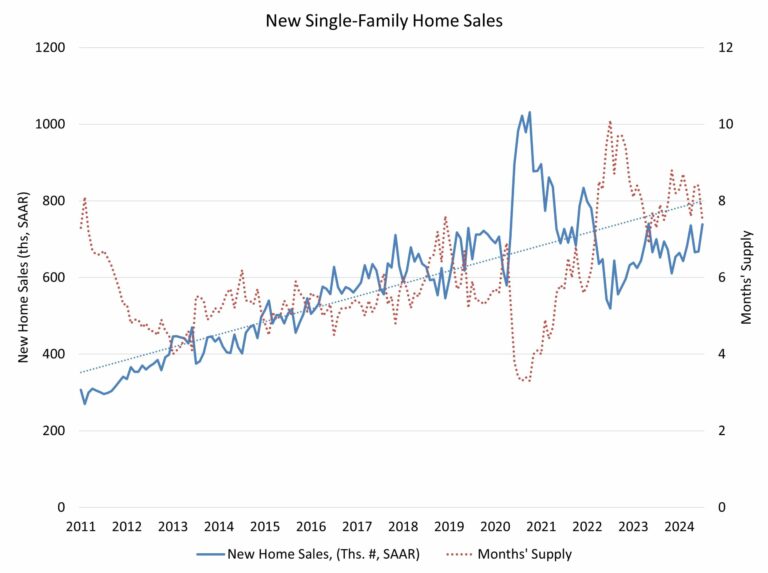
Sales of newly built, single-family homes in July rose 10.6% to a 739,000 seasonally adjusted annual rate from significant upward revisions in June, according to newly released data from the U.S. Department of Housing and Urban Development and the U.S. Census Bureau. The pace of new home sales in July is up 5.6% from a year earlier. After the notably higher revisions for the May and June data, new home sales from January through July of 2024 are up 2.6% in 2024 compared to the same period in 2023. 

While mortgage rates moved lower in July, the Census estimated gains for new home sales do not match recent industry survey data including the NAHB/Wells Fargo Housing Market Index, which showed weakness in the current sales index. The Census estimate of new home sales is often volatile and subject to revisions, and it is possible that the July estimate for sales will be revised lower next month. NAHB is forecasting gradual improvements for the home building sector as the Fed eases monetary policy and mortgage interest rates trend lower.

A new home sale occurs when a sales contract is signed, or a deposit is accepted. The home can be in any stage of construction: not yet started, under construction or completed. In addition to adjusting for seasonal effects, the July reading of 739,000 units is the number of homes that would sell if this pace continued for the next 12 months.

New single-family home inventory in July ticked lower to a level of 462,000, down 1.1% from the previous month. Only 16.7% of inventory available for purchase consists of completed, ready-to-occupy homes (102,000), although this inventory component is up 44% from a year ago.

The total new home inventory level represents a 7.5 months’ supply at the current building pace. While this reduced level of months’ supply is above the commonly used balance measure of 6, the measure of total home inventory is lower. Given a lean level of resale inventory, total home inventory (new and existing) is near 4.5, which remains low.

The median new home price was $429,800, up 3.1% compared to last month, and a 1.4% decrease from this time last year.

Regionally, on a year-to-date basis, new home sales are up 5.4% in the Northeast, 22.1% in the Midwest and 6.1% in the West. New home sales are down 2.4% in the South.

Discover more from Eye On Housing

Subscribe to get the latest posts sent to your email.


This article was originally published by a eyeonhousing.org . Read the Original article here. .
Pin It