Tag

home sales and prices

Browsing


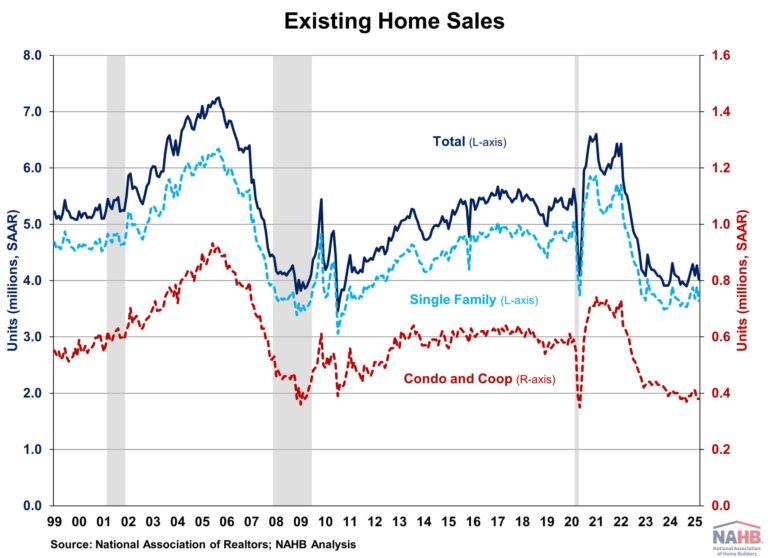
Existing home sales declined in March, according to the National Association of Realtors (NAR), as affordability challenges continued to weigh on the market. For the first time, the median home price surpassed $400,000 for the month of March, underscoring the ongoing pressure on prospective buyers. While mortgage rates have eased slightly, persistent economic uncertainty may continue to limit buyer activity in the near term.

While existing home inventory improves and the Fed continues lowering rates, the market faces headwinds as mortgage rates are expected to stay above 6% for longer due to an anticipated slower easing pace in 2025. These prolonged rates may continue to discourage homeowners from trading existing mortgages for new ones with higher rates, keeping supply tight and prices elevated. As such, sales are likely to remain limited in the coming months due to elevated mortgage rates and home prices.

Total existing home sales, including single-family homes, townhomes, condominiums, and co-ops, declined 5.9% to a seasonally adjusted annual rate of 4.02 million in March. On a year-over-year basis, sales were 2.4% lower than a year ago.

The share of first-time buyers rose to 32% in March, up from 31% in February and unchanged from March 2024.

The existing home inventory level was 1.33 million units in March, up 8.1% from February and 19.8% from a year ago. At the current sales rate, March unsold inventory sits at a 4.0-months’ supply, up from 3.5 months in February and 3.2 months in March 2024. This inventory level remains low compared to balanced market conditions (4.5 to 6 months’ supply) and illustrates the long-run need for more home construction.

Homes stayed on the market for an average of 36 days in March, down from 42 days in February but up from 33 days in March 2024.

The March all-cash sales share was 26% of transactions, down from 32% in February and 28% a year ago.

The March median sales price of all existing homes was $403,700, up 2.7% from last year. This marked the 21st consecutive month of year-over-year increases. The median condominium/co-op price in March was up 1.5% from a year ago at $363,000. This rate of price growth will slow as inventory increases.

In March, existing home sales declined across all four major U.S. regions. The West experienced the steepest drop, with sales falling 9.4%, followed by the South (-5.7%), the Midwest (-5.0%), and the Northeast (-2.0%). On a year-over-year basis, sales rose slightly in the West by 1.3%, declined in the South and Midwest by 4.2% and 3.1% respectively, and remained unchanged in the Northeast.

The Pending Home Sales Index (PHSI) is a forward-looking indicator based on signed contracts. The PHSI fell from 70.6 to an all-time low of 67.3 in February. This decline suggests elevated home prices and higher mortgage rates continue to constrain affordability. On a year-over-year basis, pending sales were 9.9% lower than a year ago, per National Association of Realtors data.

Discover more from Eye On Housing

Subscribe to get the latest posts sent to your email.


This article was originally published by a eyeonhousing.org . Read the Original article here. .

A modest decline in mortgage rates and lean existing inventory helped boost new home sales in March even as builders and consumers contend with uncertain market conditions.

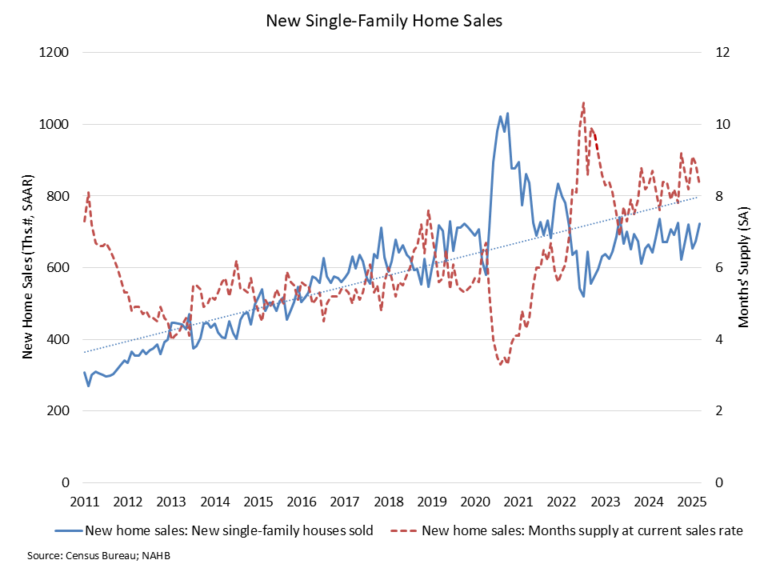
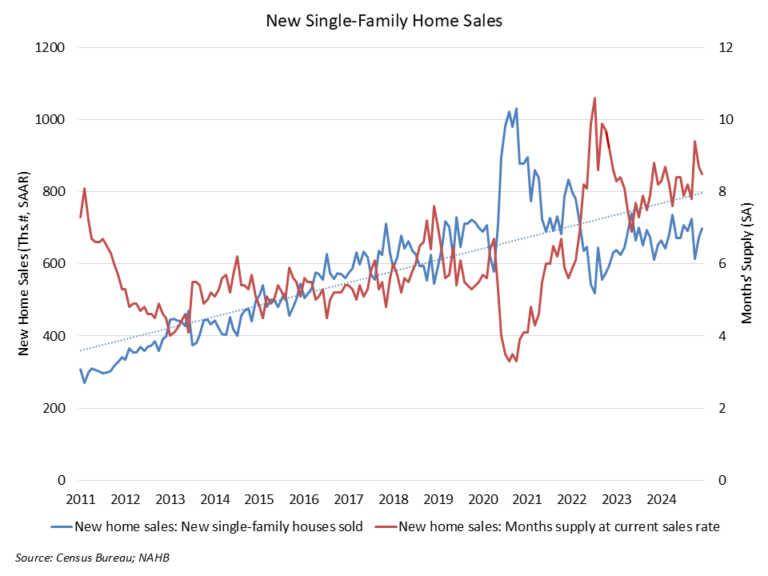
Sales of newly built, single-family homes in March increased 7.4% to a 724,000 seasonally adjusted annual rate from a revised January number, according to newly released data from the U.S. Department of Housing and Urban Development and the U.S. Census Bureau. The pace of new home sales in March was up 6.0% compared to a year earlier.

The March new home sales data shows that demand continues to be present in the market, provided affordability conditions permit a purchase. An increase in economic certainty would be a big boost to future sales conditions. Lower mortgage interest rates helped boost the pace of new home sales in March. In February, the average 30-year fixed rate mortgage was 6.84%, while in March it fell to 6.65%.

A new home sale occurs when a sales contract is signed, or a deposit is accepted. The home can be in any stage of construction: not yet started, under construction or completed. In addition to adjusting for seasonal effects, the March reading of 724,000 units is the number of homes that would sell if this pace continued for the next 12 months.

New single-family home inventory in March continued to rise to a level of 503,000, up 7.9% compared to a year earlier. This represents an 8.3 months’ supply at the current building pace. This level of supply continues to be reasonable given that the resale, single-family months’ supply remains lean at just 3.4. The count of completed, ready-to-occupy homes available for sale increased to 119,000, up 34% from a year ago.

However, the March data also is showing signs that the total amount of inventory in the new construction space has slowed given soft housing conditions at the start of 2025. For example, the count of new homes available for sale that are under construction (263,000 in March) is down 5% year-over-year and 6% lower than the non-seasonally adjusted peak count set in October 2024.

The median new home sale price in March was $403,600, down 7.5% from a year ago. Sales were particularly strong at lower price levels. Compared to March 2024, new homes sales were 33% higher for homes priced below $300,000 and 28% higher for new homes priced between $300,000 and $400,000.

Regionally, on a year-to-date basis, new home sales are up 12.9% in the South, but are down 32% in the Northeast, 18.3% in the Midwest and 6% in the West.

Discover more from Eye On Housing

Subscribe to get the latest posts sent to your email.


This article was originally published by a eyeonhousing.org . Read the Original article here. .

A slight decline in mortgage rates and limited existing inventory helped new home sales to edge higher in February even as housing affordability challenges continue to act as a strong headwind on the market.

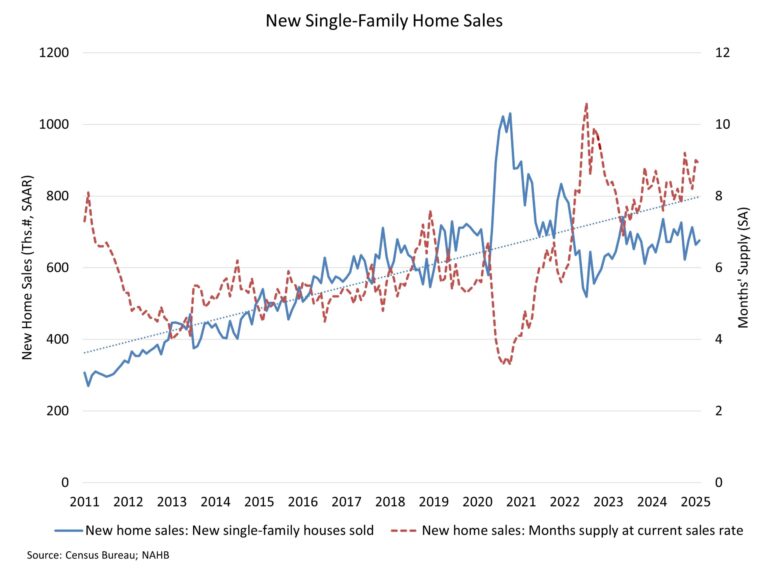
Sales of newly built, single-family homes in February increased 1.8% to a 676,000 seasonally adjusted annual rate from a revised January number, according to newly released data from the U.S. Department of Housing and Urban Development and the U.S. Census Bureau. The pace of new home sales in February was up 5.1% compared to a year earlier.

New home sales have been roughly flat thus far in 2025, as ongoing limited inventory of existing homes in many markets continues to support the need for new homes. Lower mortgage rates helped to lift demand in February, despite other near-term risks such as tariff issues and affordability concerns.

A new home sale occurs when a sales contract is signed, or a deposit is accepted. The home can be in any stage of construction: not yet started, under construction or completed. In addition to adjusting for seasonal effects, the February reading of 676,000 units is the number of homes that would sell if this pace continued for the next 12 months.

New single-family home inventory in February continued to rise to a level of 500,000, up 7.5% compared to a year earlier. This represents an 8.9 months’ supply at the current building pace. The count of completed, ready-to-occupy homes available for sale increased again, rising to 119,000, up 35% from a year ago and marking the highest count since mid-2009. 

However, after accounting for a low 3.4 months’ supply for the existing single-family market, total market inventory (new and existing homes) stands at a lean 4.2 months’ supply per NAHB estimates. A balanced market is typically defined as a 6 month’s supply.

The median new home sale price in February was $414,500, down 1.5% from a year ago. The count of sales was supported by a gain of transactions priced between $300,000 and $400,000 in February.

Regionally, on a year-to-date basis, new home sales are up 12.4% in the South but down 6.7% in the West, 13.5% in the Midwest and 50.8% in the Northeast.

Discover more from Eye On Housing

Subscribe to get the latest posts sent to your email.


This article was originally published by a eyeonhousing.org . Read the Original article here. .

Existing home sales in February increased to the second highest level since March 2024, according to the National Association of Realtors (NAR). This rebound suggests buyers are slowly entering the market as inventory improves and mortgage rates decline from recent high in January. Despite rates easing, economic uncertainty may continue to constrain buyer activity.

While existing home inventory improves and the Fed continues lowering rates, the market faces headwinds as mortgage rates are expected to stay above 6% for longer due to an anticipated slower easing pace in 2025. These prolonged rates may continue to discourage homeowners from trading existing mortgages for new ones with higher rates, keeping supply tight and prices elevated. As such, sales are likely to remain limited in the coming months due to elevated mortgage rates and home prices.

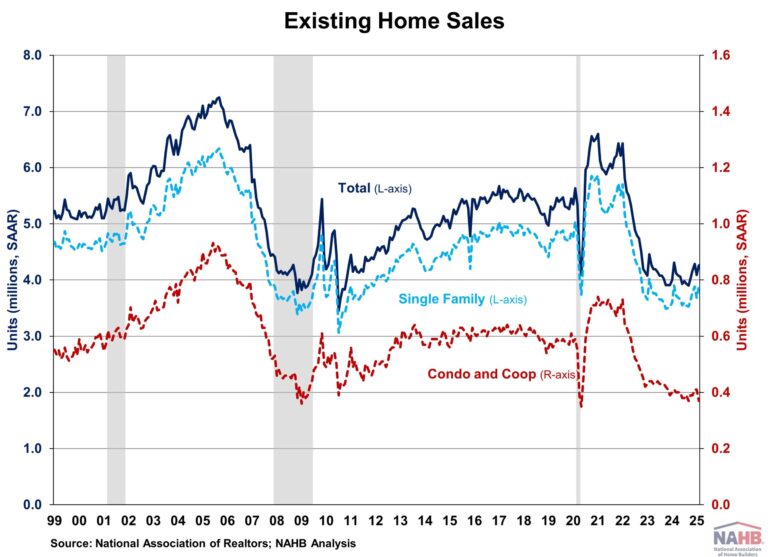
Total existing home sales, including single-family homes, townhomes, condominiums, and co-ops, rose 4.2% to a seasonally adjusted annual rate of 4.26 million in February. On a year-over-year basis, sales were 1.2% lower than a year ago.

The first-time buyer share was 31% in February, up from 28% in January and 26% from a year ago.

The existing home inventory level was 1.24 million units in February, up from 1.18 million in January, and up 17.0% from a year ago. At the current sales rate, February unsold inventory sits at a 3.5-months’ supply, unchanged from last month but up from 3.0-months’ supply a year ago. This inventory level remains low compared to balanced market conditions (4.5 to 6 months’ supply) and illustrates the long-run need for more home construction.

Homes stayed on the market for an average of 42 days in February, up from 41 days in January and 38 days in February 2024.

The February all-cash sales share was 32% of transactions, up from 29% in January but down from 33% a year ago. All-cash buyers are less affected by changes in interest rates.

The February median sales price of all existing homes was $398,400, up 3.8% from last year. This marked the 20th consecutive month of year-over-year increases. The median condominium/co-op price in February was up 3.5% from a year ago at $355,100. This rate of price growth will slow as inventory increases.

Existing home sales in February were mixed across the four major regions. Sales rose in the South (4.4%) and West (13.3%), fell in the Northeast (-2.0%), and remained unchanged in the Midwest. On a year-over-year basis, sales increased in the Northeast (4.2%) and Midwest (1.0%), decreased in the South (-4.0%), and were unchanged in the West.

The Pending Home Sales Index (PHSI) is a forward-looking indicator based on signed contracts. The PHSI fell from 74.0 to an all-time low of 70.6 in January. This decline suggests elevated home prices and higher mortgage rates continue to constrain affordability. On a year-over-year basis, pending sales were 5.2% lower than a year ago, per National Association of Realtors data.

Discover more from Eye On Housing

Subscribe to get the latest posts sent to your email.


This article was originally published by a eyeonhousing.org . Read the Original article here. .

Following two straight quarters of deceleration, house price appreciation accelerated slightly in the fourth quarter of 2024 due to the persistent high mortgage rates and low inventory. Although inventories of existing homes have improved from a year ago, the current 3.5-month supply remains below the 4.5- to 6-month supply that considered a balanced housing market.

Nationally, according to the quarterly all-transactions House Price Index (HPI) released by the Federal Housing Finance Agency (FHFA), U.S. house prices rose 5.4% in the fourth quarter of 2024, compared to the fourth quarter of 2023. The year-over-year rate has decreased from a high of 20.6% in the second quarter of 2022, but is higher than the previous quarter’s rate of 5.2%.

The quarterly FHFA HPI not only reports house prices at the national level but also provides insights about house price fluctuations at the state and metro area levels. The FHFA HPI used in this article is the all-transactions index, measuring average price changes in repeat sales or refinancings on the same single-family properties.  

Between the fourth quarter of 2023 and the fourth quarter of 2024, 49 states and the District of Columbia had positive house price appreciation. Vermont topped the house price appreciation list with an 8.9% gain, followed by New Jersey and Connecticut both with 8.3% gains. At the other end, Louisiana had the lowest house price appreciation (+2.1%), while Hawaii was the only state to experience a price decline (-4.3%). Among all 50 states and the District of Columbia, 31 states reached or exceeded the national growth rate of 5.4%. Compared to the third quarter of 2024, 32 out of the 50 states had an acceleration in house price appreciation in the fourth quarter.

House price growth widely varied across U.S. metro areas year-over-year, ranging from -4.9% to +24.7%. In the fourth quarter of 2024, 18 metro areas, in reddish color on the map above, had negative house price appreciation, while the remaining 366 metro areas experienced positive price appreciation. Punta Gorda, FL had the largest decline in house prices, while Cumberland, MD-WV saw the highest increase over the previous four quarters.

Additionally, house prices have increased dramatically since the COVID-19 pandemic. Nationally, house prices rose 53% between the first quarter of 2020 and the fourth quarter of 2024. More than half of metro areas saw house prices rise by more than the national price growth rate of 53%.

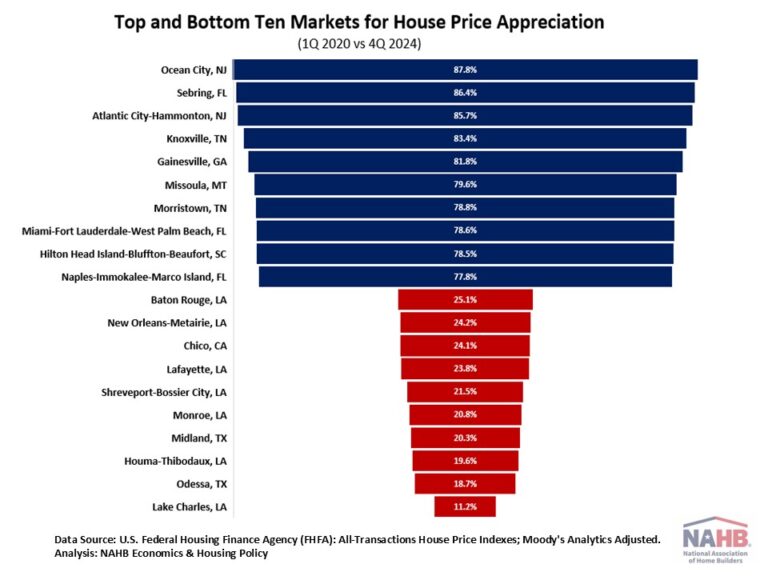
The table below shows the top and bottom ten markets for house price appreciation between the first quarter of 2020 and the fourth quarter of 2024. Among all the metro areas, house price appreciation ranged from 11.2% to 87.8%. Ocean City, NJ experienced the highest house price appreciation. Lake Charles, LA had the lowest appreciation for the third quarter in a row.

Discover more from Eye On Housing

Subscribe to get the latest posts sent to your email.


This article was originally published by a eyeonhousing.org . Read the Original article here. .

New home sales decreased in January to a three-month low, as housing affordability continues to sideline potential home buyers. Mortgage rates are expected to remain above 6% throughout 2025, coupled with elevated home prices, creating a significant affordability challenge for both first-time buyers and those looking to upgrade.

Sales of newly built, single-family homes in January decreased 10.5% to a 657,000 seasonally adjusted annual rate from an upwardly revised December number, according to newly released data from the U.S. Department of Housing and Urban Development and the U.S. Census Bureau. The pace of new home sales in January is down 1.1% compared to a year earlier.

A new home sale occurs when a sales contract is signed, or a deposit is accepted. The home can be in any stage of construction: not yet started, under construction or completed. In addition to adjusting for seasonal effects, the January reading of 657,000 units is the number of homes that would sell if this pace continued for the next 12 months.

New single-family home inventory in January continued to rise to a level of 495,000, up 7.4% compared to a year earlier. This represents a 9 months’ supply at the current building pace.

Completed ready-to-occupy inventory was at a level of 118,000, up 39% compared to a year ago.

While the monthly supply of new homes is 9 months, there is currently only a 3.4 months’ supply of existing single-family homes on the market. NAHB estimates the combined new and existing total months’ supply rose to a 4.2 months’ supply in January. The market has not been near a 6 months’ supply, which represents a balanced market, since 2012.

The median new home sale price in January was $446,300, up 3.7% from a year ago. It is the highest median sale price since October 2022. The Census data reveals a decrease in new home sales priced between $300,000 and $399,999, which made up 24% of new home sales in January, compared to 29% a year ago.

Regionally, on a year-to-date basis, new home sales are down 60.0% in the Northeast, and up 7.1% in the West. New home sales remain unchanged in the Midwest and South.

Discover more from Eye On Housing

Subscribe to get the latest posts sent to your email.


This article was originally published by a eyeonhousing.org . Read the Original article here. .


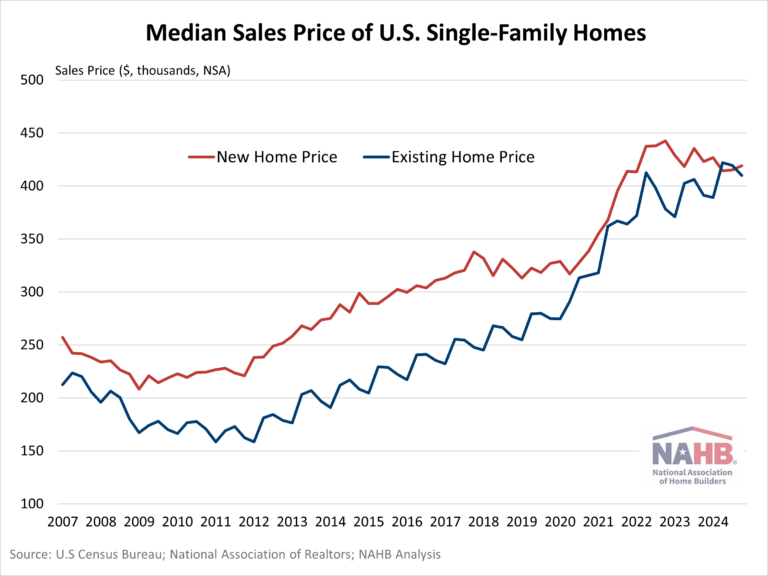
The traditional price gap between new and existing homes was nearly nonexistent at the end of 2024. The median price for a new single-family home sold in the fourth quarter of 2024 was $419,200, a mere $9,100 above the existing home sales price of $410,100, according to U.S. Census Bureau and National Association of Realtors data (not seasonally adjusted – NSA).

Typically, new homes carry a price premium over existing homes. However, for the first time in the quarterly data since 1989, the median existing home price exceeded the new home price in the second quarter of 2024, and again in the third quarter of 2024. The average price premium of new home sales over existing home sales for 2024 was $8,725. To put this into perspective, 2023’s premium average was $33,750 and the 10-year average is $50,657.

Both new and existing homes saw dramatic price increases post-pandemic due to higher construction costs and limited supply. Although overall home prices remain elevated compared to historical norms, new home prices have moderated due to builder business decisions, while existing home prices continue to increase due to lean supply.

The median price for a single-family new home sold in the fourth quarter of 2024 decreased by 0.95% from the previous year. New home prices have continued to decline year-over-year for the previous seven quarters.

Meanwhile, the median price for existing single-family homes increased 4.80% from one year ago. Existing home prices have continued to experience year-over-year increases for six consecutive quarters.

There are several factors as to why new and existing homes are selling at similar price points. Tight inventory continues to push up prices for existing homes, as many homeowners who secured low mortgage rates during the pandemic are hesitant to sell due to current high interest rates.

Meanwhile, new home pricing is more volatile – prices change due to the types and locations of homes being built. Despite various challenges facing the industry, home builders are adapting to affordability challenges by selling smaller lots, constructing smaller homes, and offering incentives.

Additionally, there has been a shift in home building toward the South, associated with less expensive homes because of policy effects. In the fourth quarter of 2024, the percentage of new homes sold in the South was 63%, compared to 44% of existing homes (NSA).

The least expensive region for homes in the fourth quarter was the Midwest, with a median price of $368,000 for new homes and $304,800 for existing homes. The South followed closely, with a median new home price of $377,200 and an existing home price of $366,800. New homes were most expensive in the Northeast with a median price of $798,000, while the West sold at $560,000. However, for existing homes, the West led as the most expensive region at $633,500 homes, followed by the Northeast at $487,900.

The new home price premium was most pronounced in the Northeast, where new homes sold for $310,900 more than existing homes. In contrast, the South saw little difference with a modest $10,400—similar to the national trend. Uniquely, this pattern reversed in the West, where existing homes were $72,600 more than new homes.

Discover more from Eye On Housing

Subscribe to get the latest posts sent to your email.


This article was originally published by a eyeonhousing.org . Read the Original article here. .

After three months of increases, existing home sales retreated in January from the 10-month high last month, according to the National Association of Realtors (NAR). Sales continued to be suppressed by higher mortgage rates, which remained above 6.5% despite the Fed cutting rates by 100 basis points last year. The persistent high mortgage rates largely reflect policy uncertainty and concerns about future economic growth.

While existing home inventory improves and the Fed continues lowering rates, the market faces headwinds as mortgage rates are expected to stay above 6% for longer due to an anticipated slower easing pace in 2025. The prolonged rates may continue to discourage homeowners from trading existing mortgages for new ones with higher rates, keeping supply tight and prices elevated. As such, sales are likely to remain limited in the coming months due to elevated mortgage rates and home prices.

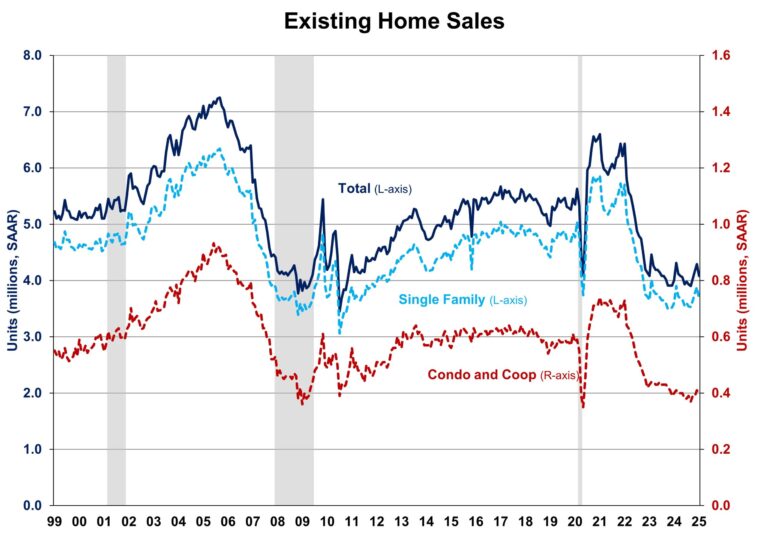
Total existing home sales, including single-family homes, townhomes, condominiums, and co-ops, fell 4.9% to a seasonally adjusted annual rate of 4.08 million in January. On a year-over-year basis, sales were 2.0% higher than a year ago. This marks the fourth consecutive month of annual increases.

The first-time buyer share was 28% in January, down from 31% in December but unchanged from January 2024.

The existing home inventory level rose from 1.14 million in December to 1.18 million units in January and is up 16.8% from a year ago. At the current sales rate, January unsold inventory sits at a 3.5-months’ supply, up from 3.2-months last month and 3.0-months a year ago. This inventory level remains low compared to balanced market conditions (4.5 to 6 months’ supply) and illustrates the long-run need for more home construction.

Homes stayed on the market for an average of 41 days in January, up from 35 days in December and 36 days in January 2024.

The January all-cash sales share was 29% of transactions, up from 28% in December 2024 but down from 32% in January 2024. All-cash buyers are less affected by changes in interest rates.

The January median sales price of all existing homes was $396,900, up 4.8% from last year. This marked the 19th consecutive month of year-over-year increases. The median condominium/co-op price in December was up 2.9% from a year ago at $349,500. This rate of price growth will slow as inventory increases.

Geographically, three of the four regions saw a decline in existing home sales in January, ranging from 5.7% in the Northeast to 7.4% in the West. Sales in the Midwest remained unchanged. On a year-over-year basis, sales grew in three regions, ranging from 1.4% in the West to 5.3% in the Midwest. Sales were unchanged in the South from a year ago.

The Pending Home Sales Index (PHSI) is a forward-looking indicator based on signed contracts. The PHSI fell from 78.5 to 74.2 in December due to elevated mortgage rates. This marks the first decline since August 2024. On a year-over-year basis, pending sales were 5.0% lower than a year ago, per National Association of Realtors data.

Discover more from Eye On Housing

Subscribe to get the latest posts sent to your email.


This article was originally published by a eyeonhousing.org . Read the Original article here. .

On a year-over-year basis, home prices grew at a rate of 3.75% for November, according to the S&P CoreLogic Case-Shiller Home Price Index (NSA). This marks an increase from the 3.59% growth rate recorded in October but is down from a peak of 6.54% in March 2024.

By Metro Area

In addition to tracking national home price changes, the S&P CoreLogic Index (SA) also reports home price indexes across 20 metro areas. Compared to last year, 19 of 20 metro areas reported a home price increase. There were 10 metro areas that grew more than the national rate of 3.75%. The highest annual rate was New York at 7.37%, followed by Chicago at 6.22% and Washington DC at 5.90%. Denver grew at the smallest rate at 0.92%, followed closely by Dallas at 1.02%. Tampa was the only area that experienced a decline from last year at a rate of -0.33%.

By Census Division

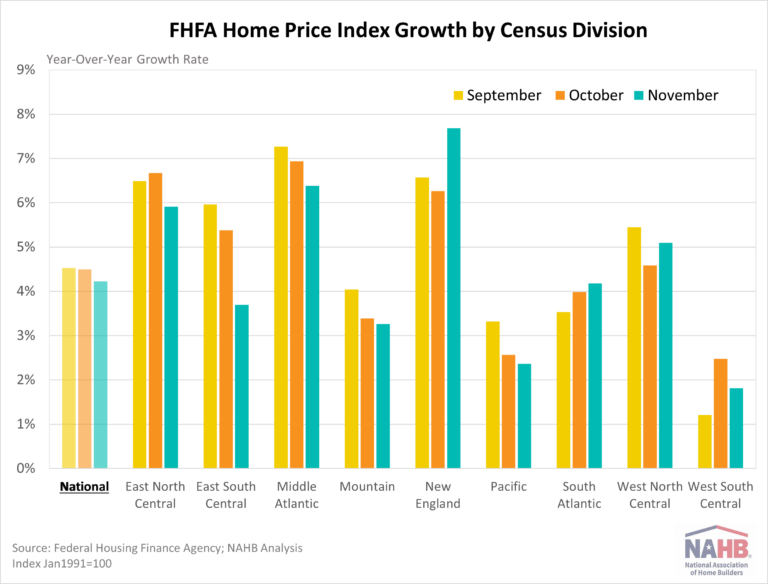
A similar index, the Federal Housing Finance Agency Home Price Index (SA) publishes not only national data but also data by census division. The national year-over-year rate was 4.22% for November. Meanwhile, the division with the highest year-over-year rate was 7.67% in New England, while the lowest was 1.81% in West South Central. A three-month trend in rates is shown for each division below. The FHFA Home Price Index releases their metro and state data on a quarterly basis, which NAHB analyzed in a previous post.

Discover more from Eye On Housing

Subscribe to get the latest posts sent to your email.


This article was originally published by a eyeonhousing.org . Read the Original article here. .

A limited amount of existing inventory along with solid demand helped new home sales end the year on an up note, even as buyers continue to grapple with housing affordability challenges.

Sales of newly built, single-family homes in December increased 3.6% to a 698,000 seasonally adjusted annual rate from an upwardly revised November number, according to newly released data from the U.S. Department of Housing and Urban Development and the U.S. Census Bureau. The pace of new home sales in December was up 6.7% compared to a year earlier.

New home sales ended 2024 2.5% higher over the 2023 total. NAHB is forecasting a slight gain for sales in 2025 given ongoing solid macroeconomic conditions, particularly for the labor market. Furthermore, builders are cautiously optimistic about the building market given a post-election policy reset that seeks to eliminate unnecessary regulations

A new home sale occurs when a sales contract is signed, or a deposit is accepted. The home can be in any stage of construction: not yet started, under construction or completed. In addition to adjusting for seasonal effects, the December reading of 698,000 units is the number of homes that would sell if this pace continued for the next 12 months.

New single-family home inventory in December continued to rise to a level of 494,000, up 10% compared to a year earlier. This represents an 8.5 months’ supply at the current building pace.

Completed ready-to-occupy inventory is up 46% to a level of 118,000, compared to a year ago.

NAHB estimates the combined new and existing total months’ supply (8.5 months’ supply for new homes while the much larger resale market was at 3.1) fell to just a 4 months’ supply in December, the lowest since April 2024. The market has not been near a 6 months’ supply, which represents a balanced market, since 2012.

The median new home sale price in December was $427,000, up 2.1% from a year ago.

Regionally, on a year-to-year basis for 2024 totals, new home sales were strongest in the Midwest, up 19% in 2024. Sales also rose 1.7% in the Northeast and 2.6% in the West but declined 0.2% in the South.

Discover more from Eye On Housing

Subscribe to get the latest posts sent to your email.


This article was originally published by a eyeonhousing.org . Read the Original article here. .
Pin It