Tag

home

Browsing


Existing home sales declined in March, according to the National Association of Realtors (NAR), as affordability challenges continued to weigh on the market. For the first time, the median home price surpassed $400,000 for the month of March, underscoring the ongoing pressure on prospective buyers. While mortgage rates have eased slightly, persistent economic uncertainty may continue to limit buyer activity in the near term.

While existing home inventory improves and the Fed continues lowering rates, the market faces headwinds as mortgage rates are expected to stay above 6% for longer due to an anticipated slower easing pace in 2025. These prolonged rates may continue to discourage homeowners from trading existing mortgages for new ones with higher rates, keeping supply tight and prices elevated. As such, sales are likely to remain limited in the coming months due to elevated mortgage rates and home prices.

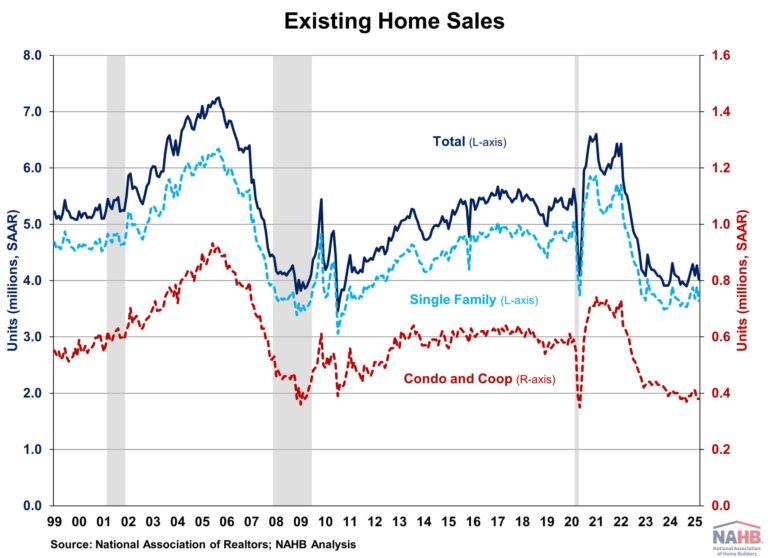
Total existing home sales, including single-family homes, townhomes, condominiums, and co-ops, declined 5.9% to a seasonally adjusted annual rate of 4.02 million in March. On a year-over-year basis, sales were 2.4% lower than a year ago.

The share of first-time buyers rose to 32% in March, up from 31% in February and unchanged from March 2024.

The existing home inventory level was 1.33 million units in March, up 8.1% from February and 19.8% from a year ago. At the current sales rate, March unsold inventory sits at a 4.0-months’ supply, up from 3.5 months in February and 3.2 months in March 2024. This inventory level remains low compared to balanced market conditions (4.5 to 6 months’ supply) and illustrates the long-run need for more home construction.

Homes stayed on the market for an average of 36 days in March, down from 42 days in February but up from 33 days in March 2024.

The March all-cash sales share was 26% of transactions, down from 32% in February and 28% a year ago.

The March median sales price of all existing homes was $403,700, up 2.7% from last year. This marked the 21st consecutive month of year-over-year increases. The median condominium/co-op price in March was up 1.5% from a year ago at $363,000. This rate of price growth will slow as inventory increases.

In March, existing home sales declined across all four major U.S. regions. The West experienced the steepest drop, with sales falling 9.4%, followed by the South (-5.7%), the Midwest (-5.0%), and the Northeast (-2.0%). On a year-over-year basis, sales rose slightly in the West by 1.3%, declined in the South and Midwest by 4.2% and 3.1% respectively, and remained unchanged in the Northeast.

The Pending Home Sales Index (PHSI) is a forward-looking indicator based on signed contracts. The PHSI fell from 70.6 to an all-time low of 67.3 in February. This decline suggests elevated home prices and higher mortgage rates continue to constrain affordability. On a year-over-year basis, pending sales were 9.9% lower than a year ago, per National Association of Realtors data.

Discover more from Eye On Housing

Subscribe to get the latest posts sent to your email.


This article was originally published by a eyeonhousing.org . Read the Original article here. .

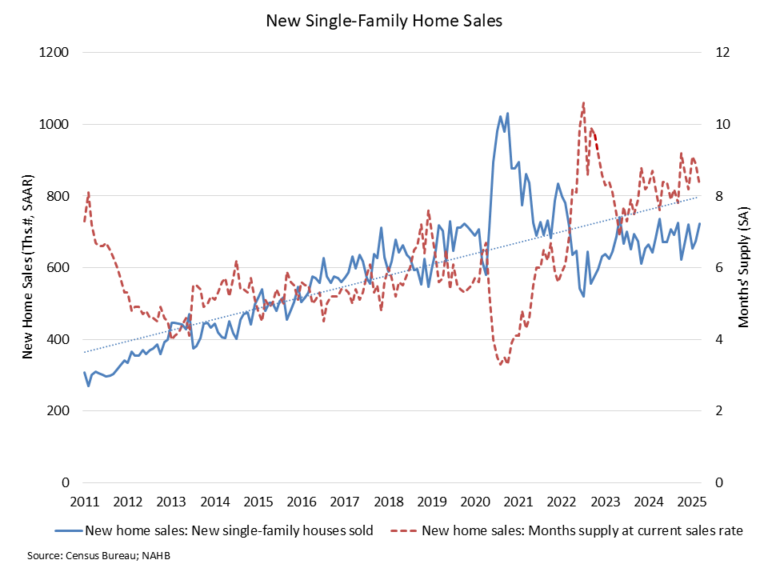
A modest decline in mortgage rates and lean existing inventory helped boost new home sales in March even as builders and consumers contend with uncertain market conditions.

Sales of newly built, single-family homes in March increased 7.4% to a 724,000 seasonally adjusted annual rate from a revised January number, according to newly released data from the U.S. Department of Housing and Urban Development and the U.S. Census Bureau. The pace of new home sales in March was up 6.0% compared to a year earlier.

The March new home sales data shows that demand continues to be present in the market, provided affordability conditions permit a purchase. An increase in economic certainty would be a big boost to future sales conditions. Lower mortgage interest rates helped boost the pace of new home sales in March. In February, the average 30-year fixed rate mortgage was 6.84%, while in March it fell to 6.65%.

A new home sale occurs when a sales contract is signed, or a deposit is accepted. The home can be in any stage of construction: not yet started, under construction or completed. In addition to adjusting for seasonal effects, the March reading of 724,000 units is the number of homes that would sell if this pace continued for the next 12 months.

New single-family home inventory in March continued to rise to a level of 503,000, up 7.9% compared to a year earlier. This represents an 8.3 months’ supply at the current building pace. This level of supply continues to be reasonable given that the resale, single-family months’ supply remains lean at just 3.4. The count of completed, ready-to-occupy homes available for sale increased to 119,000, up 34% from a year ago.

However, the March data also is showing signs that the total amount of inventory in the new construction space has slowed given soft housing conditions at the start of 2025. For example, the count of new homes available for sale that are under construction (263,000 in March) is down 5% year-over-year and 6% lower than the non-seasonally adjusted peak count set in October 2024.

The median new home sale price in March was $403,600, down 7.5% from a year ago. Sales were particularly strong at lower price levels. Compared to March 2024, new homes sales were 33% higher for homes priced below $300,000 and 28% higher for new homes priced between $300,000 and $400,000.

Regionally, on a year-to-date basis, new home sales are up 12.9% in the South, but are down 32% in the Northeast, 18.3% in the Midwest and 6% in the West.

Discover more from Eye On Housing

Subscribe to get the latest posts sent to your email.


This article was originally published by a eyeonhousing.org . Read the Original article here. .


This graph shows a generational breakdown of renovation spend by homeowners in 2024. The darker green bars represent a similar overall median spend among seniors ($22,000), baby boomers ($20,000) and Gen Xers ($20,000). Millennials were at the low end with a median spend of $15,000.

The lighter green bars show how in the 90th percentile of spend, Gen X renovators led the pack, allocating up to $150,000 for projects. The other groups had spends between $120,000 and $125,000.

For kitchen remodels specifically, millennials’ median spend increased from $15,000 in 2023 to $20,000 in 2024. Gen Xers saw a 12% drop in median spend, from $25,000 in 2023 to $22,000 in 2024, while baby boomers spent slightly less year over year, dropping from $24,000 in 2023 to $23,000 in 2024. Seniors also scaled back: Their median kitchen remodel spend dropped from $19,000 to $15,000.

Bathroom remodels present a mixed picture. The median spend for seniors nearly doubled, from $8,500 in 2023 to $15,300 in 2024, while the median spend for millennials declined sharply, from $12,000 to $7,500. The median spend for Gen Xers decreased from $15,000 in 2023 to $13,000 in 2024, while baby boomers remained steady year over year at $15,000.

Your Spring Home Maintenance Checklist


This article was originally published by a www.houzz.com . Read the Original article here. .


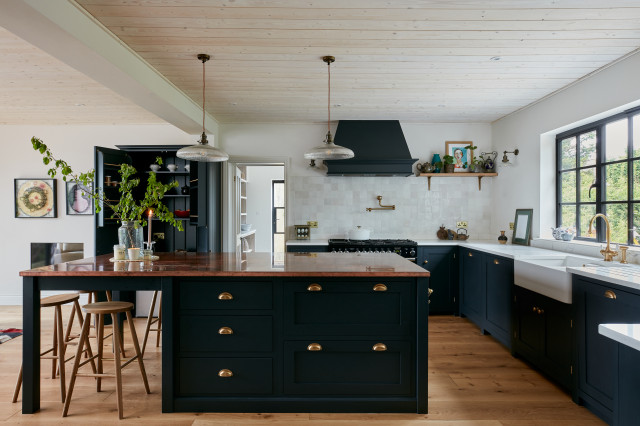
The phrase “worth the wait” is probably an understatement when it comes to this gorgeous English home, as the owners did have to exercise quite a bit of patience. Pandemic restrictions meant renovations to the tired 1920s property spanned two years and the work had to be divided into three phases.

“The owners saw the house in early 2020,” designer Natalie McHugh of N&K Interiors says. “They were keen to get going on extending it for their family and found us on Houzz when they searched local design and build companies, but COVID delayed everything.”

In September 2020, the team tackled a bathroom and four bedrooms, one of which was turned into a playroom, as well as changing all the windows and got the family in for Christmas. In January, they started the two-story side addition — laundry room, mudroom, powder room, living room and bedroom suite. The remaining work was completed in 2022, resulting in a home that’s both highly functional and full of warmth and character.


This article was originally published by a www.houzz.com . Read the Original article here. .


This article was originally published by a
www.houzz.com . Read the Original article here. .


Chase & Arnold, Inc.Save Photo
Tackle These To-Dos Over a Weekend

Wash windows. Clean the grime off glass inside and out for a lighter, brighter home indoors and increased curb appeal outdoors. Wash the exterior windows yourself by using a hose attachment, or hire a pro to get the job done.

Clean gutters and downspouts. After the last frost has passed, it’s important to have your gutters and downspouts cleaned and repaired. “Clogged gutters and downspouts can cause the wood trim at the eaves to rot, and that can invite all kinds of critters into your attic space,” Sedinger says.

Having your gutters and downspouts cleaned early in the season can also help prevent damage from spring rains. “Gutters and downspouts should be clean and running free,” Sedinger says. “If your downspouts are installed properly, water is diverted away from the house so that no water collects around your foundation.”

How to Clean Your Gutters and Downspouts


This article was originally published by a
www.houzz.com . Read the Original article here. .


The quarterly U.S. Houzz Renovation Barometer asks more than 1,000 construction and architecture and design firms on Houzz about their expected, current and recent business activity. The just-released Q2 2025 Barometer, fielded March 14-28, was expanded to include questions about how professionals expect market shifts, such as tariffs and interest rates, to impact their business and the industry as a whole.

The report found that firms across the industry expect these shifts to negatively impact their business. Additionally, many are adjusting procurement strategies and selectively stockpiling materials in anticipation of tariff-driven price hikes, especially on lumber, steel and cabinetry.

Here are more insights into construction and design businesses’ outlooks and strategies in the face of changing economic conditions.


This article was originally published by a www.houzz.com . Read the Original article here. .


After kicking off 2025 feeling bullish, construction and design professionals have tempered their optimism about business activity in the second quarter of the year. This follows a significant dip in Q1 performance among construction firms and relatively stable performance among design firms.

Those are key findings in the just-released Q2 2025 U.S. Houzz Renovation Barometer, which provides timely insights into the residential renovation industry, including expectations, project backlogs and recent activity among businesses in the construction sector and the architectural and design services sector.

“Optimism continues, yet residential construction and design businesses are moderating expectations amid mixed Q1 activity and economic uncertainty,” Houzz staff economist Marine Sargsyan says. “This tempered outlook is unsurprising, as firms continue to navigate challenges including rising material costs, cautious client spending and persistent labor shortages. In response, many firms are proactively adjusting procurement strategies and selectively stockpiling materials in preparation for anticipated tariff-driven price hikes, especially on lumber, steel and cabinetry.”


This article was originally published by a www.houzz.com . Read the Original article here. .


9. Wash windows. Welcome the spring sunshine by clearing dirt and grime from windows inside and out. After cleaning the glass, take an extra moment to wipe the window frame and sill.

10. Clean and inspect screen doors and windows. Pollen and grime can also build up on window screens, so it’s a good idea to clean them once a year. For a quick cleaning, leave screens in place and vacuum with a dusting attachment. For a deeper cleaning, remove screens (mark which is which if cleaning multiple windows) and gently scrub with warm, soapy water. Rinse and let dry.

Before putting up window screens and screen doors, inspect each one for holes and rips — even small tears can let in mosquitoes. If you find any holes, repair them with a screen patch kit (available at most hardware stores).

Shop for household cleaning supplies


This article was originally published by a www.houzz.com . Read the Original article here. .


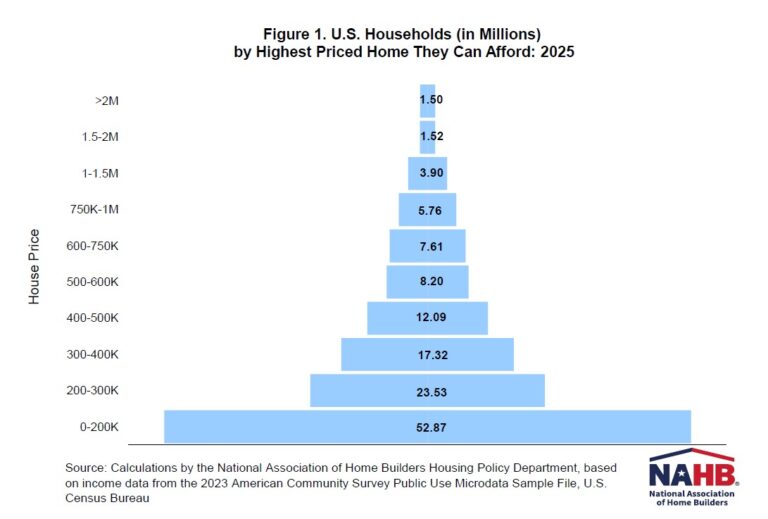
NAHB recently released its 2025 Priced-Out Analysis, highlighting the housing affordability challenge. While previous posts discussed the impacts of rising home prices and interest rates on affordability, this post focuses on the related U.S. housing affordability pyramid. The pyramid reveals that 70% of households (94 million) cannot afford a $400,000 home, while the estimated median price of a new home is around $460,000 in 2025.

The housing affordability pyramid illustrates the number of households able to purchase a home at various price steps. Each step represents the number of households that can only afford homes within that specific price range. The largest share of households falls within the first step, where homes are priced under $200,000. As home prices increase, fewer and fewer households can afford the next price level, with the highest-priced homes—those over $2 million—having the smallest number of potential buyers. Housing affordability remains a critical challenge for households with income at the lower end of the spectrum.

The pyramid is based on income thresholds and underwriting standards. Under these assumptions, the minimum income required to purchase a $200,000 home at the mortgage rate of 6.5% is $61,487. In 2025, about 52.87 million households in the U.S. are estimated to have incomes no more than that threshold and, therefore, can only afford to buy homes priced up to $200,000. These 52.87 million households form the bottom step of the pyramid. Of the remaining households who can afford a home priced at $200,000, 23.53 million can only afford to pay a top price of somewhere between $200,000 and $300,000. These households make up the second step on the pyramid. Each subsequent step narrows further, reflecting the shrinking number of households that can afford increasingly expensive homes.

It is worthwhile to compare the number of households that can afford homes at various price levels and the number of owner-occupied homes available in those ranges (excludes homes built-for-rent), as shown in Figure 2. For example, while around 53 million households can afford a home priced at $200,000 or less, there are only 22 million owner-occupied homes valued in this price range. This trend continues in the $200,000 to $300,000 price range, where the number of households that can afford homes is much higher than the number of housing units in that range. These imbalances show a shortage of affordable housing.

Discover more from Eye On Housing

Subscribe to get the latest posts sent to your email.


This article was originally published by a eyeonhousing.org . Read the Original article here. .
Pin It