Tag

Growth

Browsing


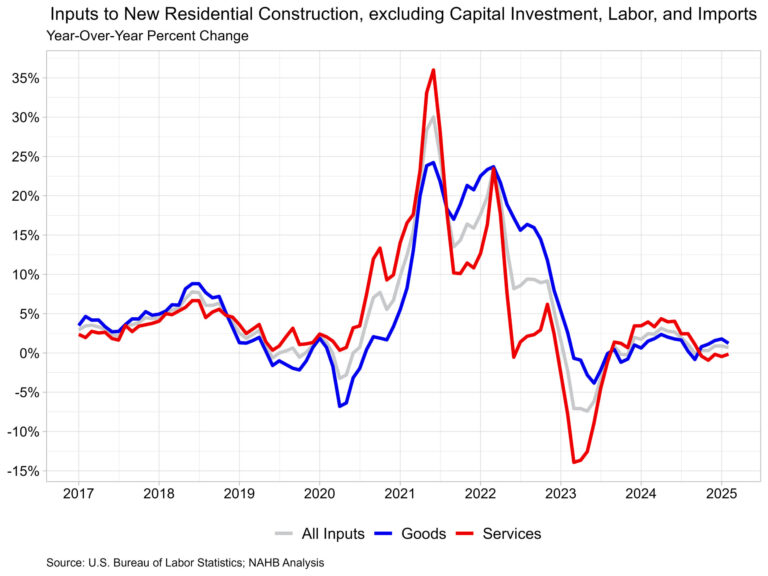
Prices for inputs to new residential construction—excluding capital investment, labor, and imports—were up 0.5% in February according to the most recent Producer Price Index (PPI) report published by the U.S. Bureau of Labor Statistics. The increase in January was revised downward to 1.1%. The Producer Price Index measures prices that domestic producers receive for their goods and services, this differs from the Consumer Price Index which measures what consumers pay and includes both domestic products as well as imports.

The inputs to the New Residential Construction Price Index grew 0.7% from February of last year. The index can be broken into two components—the goods component increased 1.2% over the year, while services decreased 0.1%. For comparison, the total final demand index, which measures all goods and services across the economy, increased 3.2% over the year, with final demand with respect to goods up 1.7% and final demand for services up 3.9% over the year.

Input Goods

The goods component has a larger importance to the total residential construction inputs price index, representing around 60%. For the month, the price of input goods to new residential construction was up 0.6% in February.

The input goods to residential construction index can be further broken down into two separate components, one measuring energy inputs with the other measuring goods less energy inputs. The latter of these two components simply represents building materials used in residential construction, which makes up around 93% of the goods index.

Energy input prices grew 2.6% between January and February but remained 8.5% lower compared to one year ago. Building material prices were up 0.5% between January and February while they were up 2.0% compared to one year ago.

Among materials used in residential construction, lumber and wood products ranks 3rd in terms of importance for the Inputs to New Residential Construction Index. Nonmetallic mineral products and metal products rank 1st and 2nd, respectively. The top lumber and wood products include general millwork, prefabricated structural members, not-edge worked softwood lumber, softwood veneer/plywood and hardwood veneer/plywood. Prices for these wood commodities experienced little growth for most of 2024. Currently, softwood lumber prices were 11.7% higher compared to one year ago while on a monthly basis, prices rose 3.0%. This marks the fourth straight month where yearly price growth was above 10% for softwood lumber.

Input Services

While prices of inputs to residential construction for services were down 0.1% over the year, they were up 0.4% in February from January. The price index for service inputs to residential construction can be broken out into three separate components: a trade services component, a transportation and warehousing services component, and a services excluding trade, transportation and warehousing component. The most significant component is trade services (around 60%), followed by services less trade, transportation and warehousing (around 29%), and finally transportation and warehousing services (around 11%). The largest component, trade services, was down 1.5% from a year ago. The services less trade, transportation and warehousing component was up 1.6% over the year.  Lastly, prices for transportation and warehousing services advanced 2.2% compared to February last year.

Discover more from Eye On Housing

Subscribe to get the latest posts sent to your email.


This article was originally published by a eyeonhousing.org . Read the Original article here. .

The continued shortage of existing homes for sale has helped to keep new single-family construction growing across all regions, according to the latest National Association of Home Builders release of the Home Building Geography Index (HBGI). Despite persistent factors that continue to affect housing affordability, including a limited supply of buildable lots, rising construction costs, and a shortage of skilled labor, single-family construction grew over all four quarters of 2024. Multifamily construction remained lackluster but did feature some growth in lower density areas.

Single-Family

All HBGI-tracked geographies posted another quarter of growth in the fourth quarter after peaking in the second quarter. The HBGI is constructed using permit data, which has continued to post higher volumes than last year despite residential construction dealing with persistent structural issues.

Among the HBGI geographies, the highest growth in the fourth quarter of 2024 was registered in small metro core counties, which increased 10.3% year-over-year on a four-quarter moving average basis (4QMA). The market with the lowest level of growth was non metro/micro counties which were up 4.8% year-over-year (4QMA).

In terms of market share, single-family construction took place primarily in small metro core county areas, representing 29.1% of single-family construction. The smallest single-family construction market remained non metro/micro county areas, with a 4.2% market share.

Multifamily

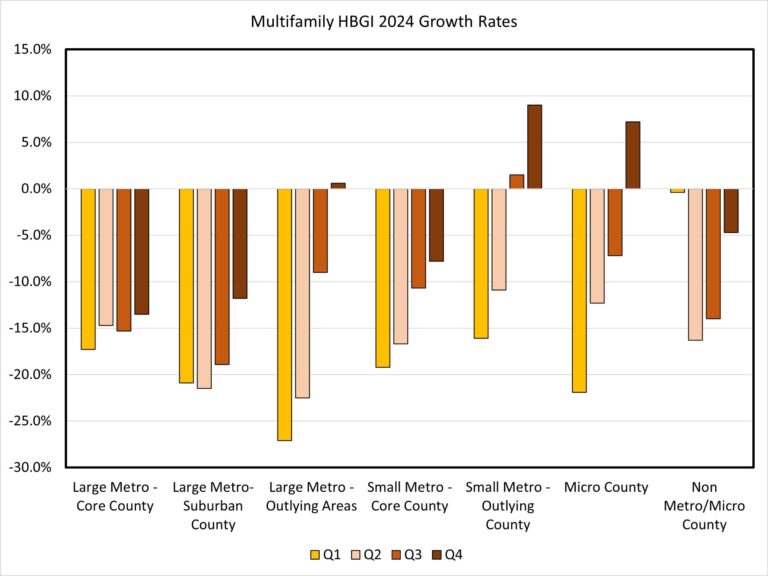
Multifamily construction continued to register negative growth rates across the largest markets, with large metro core county areas posting a decline of 13.5% quartering in the fourth quarter (4QMA). While permit levels remain lower for new multifamily construction, there were some positive signs in less densely populated areas. Small metro outlying county areas had the largest growth rate in the fourth quarter at 9.0%, the second consecutive quarter of growth. These areas make up around 5.0% of the total multifamily construction market.

The fourth quarter of 2024 HBGI data along with an interactive HBGI map can be found at http://nahb.org/hbgi.

Discover more from Eye On Housing

Subscribe to get the latest posts sent to your email.


This article was originally published by a eyeonhousing.org . Read the Original article here. .

Total outstanding U.S. consumer credit stood at $5.15 trillion for the fourth quarter of 2024, increasing at an annualized rate of 4.22% (seasonally adjusted), according to the Federal Reserve’s G.19 Consumer Credit Report. This is an uptick from the third quarter of 2024’s rate of 2.47%. 

The G.19 report excludes mortgage loans, so the data primarily reflects consumer credit in the form of student loans, auto loans, and credit card plans. As consumer spending has outpaced personal income, savings rates have been declining, and consumer credit has increased. Previously, consumer credit growth had slowed, as high inflation and rising interest rates led people to reduce their borrowing. However, in the last two quarters, growth rates have increased, reflecting the rate cuts that took place at the end of the third quarter.  

Nonrevolving Credit  

Nonrevolving credit, largely driven by student and auto loans, reached $3.76 trillion (SA) in the fourth quarter of 2024, marking a 3.11% increase at a seasonally adjusted annual rate (SAAR). This is an uptick from last quarter’s rate of 2.28%, and the highest in two years.  

Student loan debt balances stood at $1.78 trillion (NSA) for the fourth quarter of 2024. Year-over-year, student loan debt rose 2.77%, the largest yearly increase since the second quarter of 2021. This shift partially reflects the expiration of the COVID-19 Emergency Relief for student loans’ 0-interest payment pause that ended September 1, 2023. 

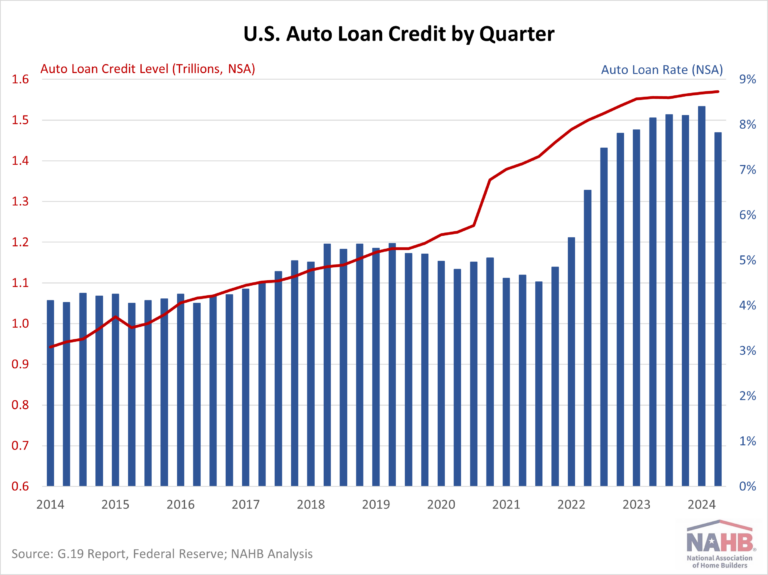
Auto loans reached a total of $1.57 trillion, showing a year-over-year increase of only 0.93%. This marks the second slowest growth rate since 2010, slightly above last quarter’s rate of 0.91%. The deceleration in growth can be attributed to several factors, including stricter lending standards, elevated interest rates, and overall inflation. Although interest rates for 5-year new car loans fell to 7.82% in the fourth quarter from a high of 8.40% in the third quarter, they remain at their highest levels in over a decade. 

Revolving Credit 

Revolving credit, primarily credit card debt, reached $1.38 trillion (SA) in the fourth quarter, rising at an annualized rate of 7.34%. This marked a significant increase from the third quarter’s 3.01% rate but was notably down from the peak growth rate of 17.58% seen in the first quarter of 2022. The surge in credit card balances in early 2022 was accompanied by an increase in the credit card rate which climbed by 4.51 percentage points over 2022. This was an exceptionally steep increase, as no other year in the past two decades had seen a rate jump of more than two percentage points.  

Comparatively, so far in 2024 the credit card rate decreased 0.12 percentage points. For the fourth quarter of 2024, the average credit card rate held by commercial banks (NSA) was 21.47%. 

Discover more from Eye On Housing

Subscribe to get the latest posts sent to your email.


This article was originally published by a eyeonhousing.org . Read the Original article here. .

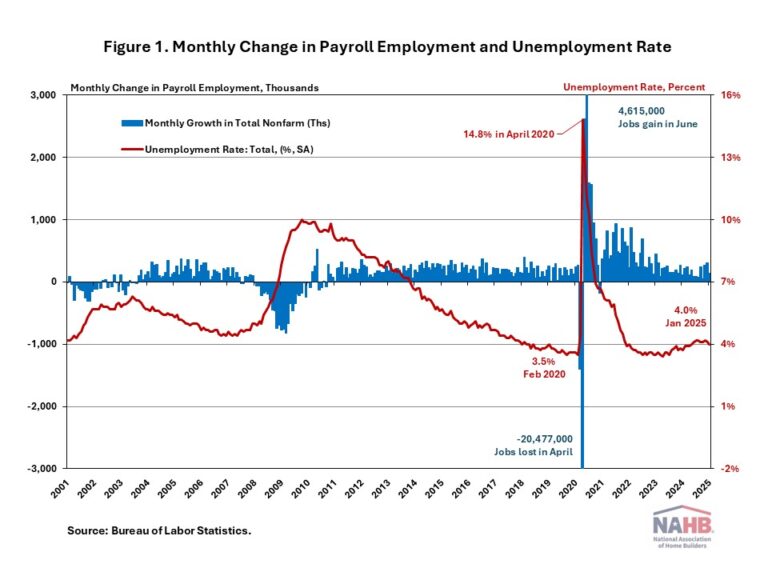
U.S. job growth slowed in January amid Southern California wildfires and severe winter weather across much of the country. Meanwhile, the unemployment rate edged down to 4.0%. This month’s data indicates that the labor market is slowing at the start of 2025 but remains healthy.

In January, wage growth remained unchanged from the previous month. Year-over-year, wages grew at a 4.1% rate, down 0.2 percentage points from a year ago. Wage growth is outpacing inflation, which typically occurs as productivity increases.

On the annual benchmark revision of the Current Employment Statistics (CES), the seasonally adjusted total nonfarm employment for March 2024 was revised down by 589,000. The average monthly pace of job growth for 2024 was revised down from a previous estimate of 186,000 per month to an average of 166,000.

National Employment

According to the Employment Situation Summary reported by the Bureau of Labor Statistics (BLS), total nonfarm payroll employment rose by 143,000 in January, the lowest monthly gain in the past three months. Since January 2021, the U.S. job market has added jobs for 49 consecutive months, making it the third-longest period of employment expansion on record.

The estimates for the previous two months were revised up. The monthly change in total nonfarm payroll employment for November was revised up by 49,000, from +212,000 to +261,000, while the change for December was revised up by 51,000 from +256,000 to +307,000. Combined, the revisions were 100,000 higher than previously reported.

The unemployment rate decreased to 4.0% in January, after accounting for the annual adjustments to the population controls. While the number of employed persons increased by 2,234,000, the number of unemployed persons decreased by 37,000.

Meanwhile, the labor force participation rate—the proportion of the population either looking for a job or already holding a job—increased one percentage point to 62.6%. For people aged between 25 and 54, the participation rate rose one percentage point to 83.5%. While the overall labor force participation rate remains below its pre-pandemic levels of 63.3% at the beginning of 2020, the rate for people aged between 25 and 54 exceeds the pre-pandemic level of 83.1%.

In January, employment in health care (+44,000), retail trade (+34,000), and social assistance (+22,000) increased, while employment declined in the mining, quarrying, and oil and gas extraction industries.

Construction Employment

Employment in the overall construction sector increased by 4,000 in January, after 13,000 gains in December. While residential construction lost 200 jobs, non-residential construction employment added 4,400 jobs for the month.

Residential construction employment now stands at 3.4 million in January, broken down as 956,000 builders and 2.4 million residential specialty trade contractors. The 6-month moving average of job gains for residential construction was 1,350 a month. Over the last 12 months, home builders and remodelers added 40,100 jobs on a net basis. Since the low point following the Great Recession, residential construction has gained 1,376,600 positions.

The unemployment rate for construction workers has remained at a relatively lower level, after reaching 15.3% in April 2020 due to the housing demand impact of the COVID-19 pandemic.

Discover more from Eye On Housing

Subscribe to get the latest posts sent to your email.


This article was originally published by a eyeonhousing.org . Read the Original article here. .


Residential construction and design professionals have an optimistic outlook for 2025, with more than 3 in 5 firms reporting positive expectations for overall business performance, according to the just-released 2025 U.S. Houzz State of the Industry report. Businesses across industry sectors anticipate high revenue growth rates, heightened demand for their services and improved local and national economies, even as they brace for rising costs and worsening labor shortages. This widespread optimism follows a year marked by unexpected revenue and profitability declines industrywide.

“Home professionals are entering 2025 with renewed confidence and expectations for growth in both revenue and profitability after navigating two difficult years,” Houzz staff economist Marine Sargsyan says. “Pros report that they’ve implemented new processes for operational efficiency and client communication and made strategic investments in technology to address the challenges they faced last year. This will better position them for an anticipated increase in demand, enhance their resilience amidst potential tariffs and leverage expected improvements in both local and national economic conditions.”

Here’s what the report reveals about firms’ expectations for 2025 and performances in 2024.


This article was originally published by a www.houzz.com . Read the Original article here. .


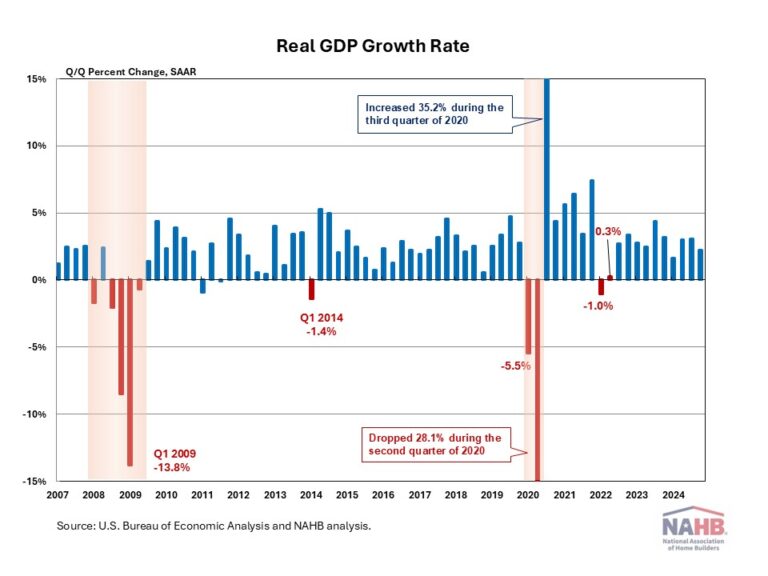
Real GDP growth slowed in the fourth quarter of 2024, but the economy finished the year at a solid rate. While consumer spending continued to drive growth, gross private domestic investment detracted over a full percentage point mainly due to a decline in private inventories.

According to the “advance” estimate released by the Bureau of Economic Analysis (BEA), real gross domestic product (GDP) expanded at an annual rate of 2.3% in the fourth quarter of 2024, following a 3.1% gain in the third quarter of 2024. This quarter’s growth was higher than NAHB’s forecast of a 1.8% increase.

Furthermore, the data from the GDP report suggests that inflationary pressure persisted at the end of 2024. The GDP price index rose 2.2% for the fourth quarter, up from a 1.9% increase in the third quarter of 2024. The Personal Consumption Expenditures Price (PCE) Index, which measures inflation (or deflation) across various consumer expenses and reflects changes in consumer behavior, rose 2.3% in the fourth quarter. This is up from a 1.5% increase in the third quarter of 2024.

For the full year, real GDP grew at a healthy rate of 2.8% in 2024. It was slightly slower than the 2023 level of a 2.9% increase and matched NAHB’s forecast.

This quarter’s increase in real GDP primarily reflected increases in consumer spending, and government spending.

Consumer spending, the backbone of the U.S. economy, rose at an annual rate of 4.2% in the fourth quarter. This marks the highest annual growth rate since the first quarter of 2023. The increase in consumer spending reflected increases in both goods and services. While goods spending increased at a 6.6% annual rate, expenditures for services increased at a 3.1% annual rate.

In the fourth quarter, government spending increased at a 2.5% rate.

Nonresidential fixed investment decreased 2.2% in the fourth quarter. The decrease in nonresidential fixed investment reflected decreases in equipment (-7.8%) and structures (-1.1%). Meanwhile, residential fixed investment increased 5.3% in the fourth quarter after two consecutive quarters of declines. Within residential fixed investment, single-family structures rose 3.1% at an annual rate, improvements increased 2.7%, while multifamily structures declined 7.2%.

Compared to the third quarter, the deceleration in real GDP in the fourth quarter primarily reflected

downturns in gross private domestic investment and exports. Inventories fell and dragged down the contribution to real GDP by 0.93 percentage points. Imports decreased.

For the common BEA terms and definitions, please access bea.gov/Help/Glossary.

Discover more from Eye On Housing

Subscribe to get the latest posts sent to your email.


This article was originally published by a eyeonhousing.org . Read the Original article here. .


On a year-over-year basis, home prices grew at a rate of 3.75% for November, according to the S&P CoreLogic Case-Shiller Home Price Index (NSA). This marks an increase from the 3.59% growth rate recorded in October but is down from a peak of 6.54% in March 2024.

By Metro Area

In addition to tracking national home price changes, the S&P CoreLogic Index (SA) also reports home price indexes across 20 metro areas. Compared to last year, 19 of 20 metro areas reported a home price increase. There were 10 metro areas that grew more than the national rate of 3.75%. The highest annual rate was New York at 7.37%, followed by Chicago at 6.22% and Washington DC at 5.90%. Denver grew at the smallest rate at 0.92%, followed closely by Dallas at 1.02%. Tampa was the only area that experienced a decline from last year at a rate of -0.33%.

By Census Division

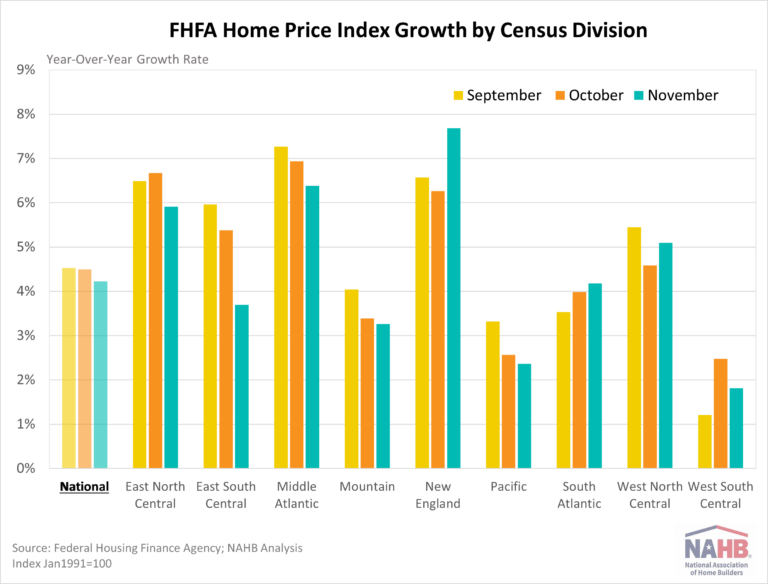
A similar index, the Federal Housing Finance Agency Home Price Index (SA) publishes not only national data but also data by census division. The national year-over-year rate was 4.22% for November. Meanwhile, the division with the highest year-over-year rate was 7.67% in New England, while the lowest was 1.81% in West South Central. A three-month trend in rates is shown for each division below. The FHFA Home Price Index releases their metro and state data on a quarterly basis, which NAHB analyzed in a previous post.

Discover more from Eye On Housing

Subscribe to get the latest posts sent to your email.


This article was originally published by a eyeonhousing.org . Read the Original article here. .


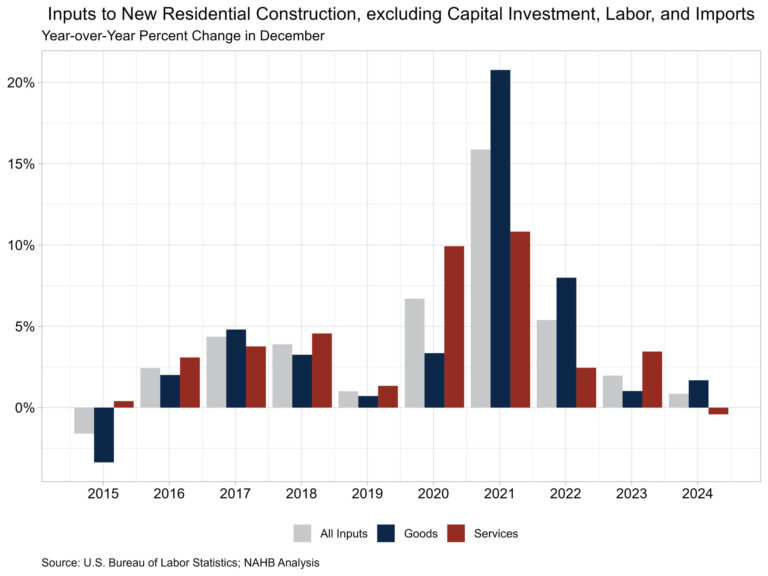
Prices for inputs to new residential construction—excluding capital investment, labor, and imports—were unchanged in December according to the most recent Producer Price Index (PPI) report published by the U.S. Bureau of Labor Statistics. This index grew 0.8% over 2024, the lowest yearly increase in the index since its inception in 2014.

The inputs to the new residential construction price index can be broken into two components—one for goods and another for services. The goods component increased 1.7% over the year, while services decreased 0.4%. For comparison, the total final demand index increased 3.3% in 2024, with final demand with respect to goods up 1.8% and final demand for services up 4.0% over the year.

Input Goods

The goods component has a larger importance to the total residential construction inputs price index, representing around 60%. The price of input goods to new residential construction was down 0.1% in December from November. The input goods to residential construction index can be further broken down into two separate components, one measuring energy inputs with the other measuring goods less energy inputs. The latter of these two components simply represents building materials used in residential construction, which makes up around 93% of the goods index.

The price of goods used in residential construction grew 1.7% in 2024, slightly higher than the growth in 2023 of 1.0%. This growth can be attributed to the rise in the prices of building materials, which grew 2.2% in 2024. The price of energy inputs fell for the second straight year, down 5.3% in 2024.

At the individual commodity level, the five commodities with the highest importance for building materials to the new residential construction index were as follows: ready-mix concrete, general millwork, paving mixtures/blocks, sheet metal products, and wood office furniture/store fixtures. Across these commodities, there was price growth for most commodities in 2024 except for sheet metal products. Ready-mix concrete was up 5.1%, wood office furniture/store fixtures up 4.3%, general millwork up 2.5%, paving mixtures/blocks up 2.3% while sheet metal products were down 0.2%. The commodity used in new residential construction the featured the highest price growth in 2024 was softwood lumber, not edge worked, which increased 14.7% in 2024. The commodity where prices declined the most was No. 2 diesel fuel, down 13.9%.

Input Services

Prices of inputs to residential construction for services were up 0.5% in December from November. The price index for service inputs to residential construction can be broken out into three separate components: a trade services component, a transportation and warehousing services component, and a services excluding trade, transportation and warehousing component. The most significant component is trade services (around 60%), followed by services less trade, transportation and warehousing (around 29%), and finally transportation and warehousing services (around 11%). The largest component, trade services, was down 1.8% in 2024 after growing 5.8% in 2023.  Across individual services, credit deposit services advanced the most in 2024, up 21.2% over the year while the prices for metal, mineral and ore wholesaling services fell the most, down 19.2%.

Discover more from Eye On Housing

Subscribe to get the latest posts sent to your email.


This article was originally published by a eyeonhousing.org . Read the Original article here. .

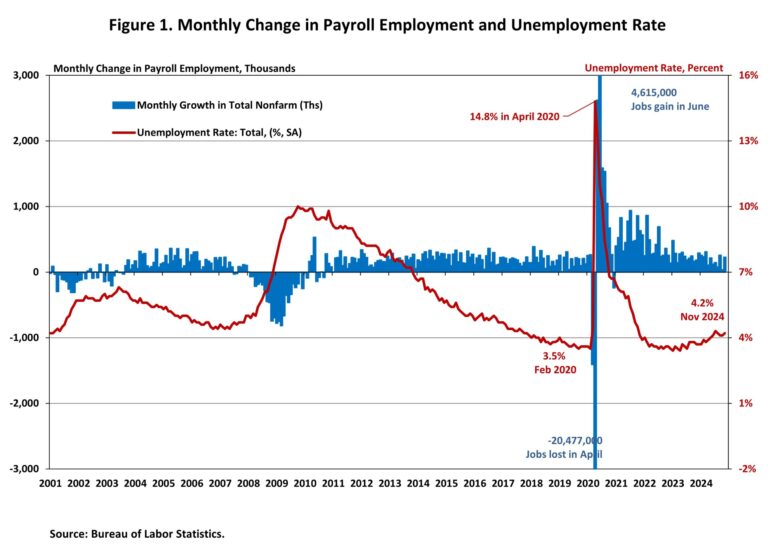
Employment rebounded sharply in November after strike- and hurricane-related disruptions in October. The unemployment rate rose one percentage point to 4.2% after holding at 4.1% for two months in a row.

In November, wage growth remained unchanged from the previous month. Wages grew at a 4.0% year-over-year (YOY) growth rate, down 0.2 percentage points from a year ago. Wage growth is outpacing inflation, which typically occurs as productivity increases.

National Employment

According to the Employment Situation Summary reported by the Bureau of Labor Statistics (BLS), total nonfarm payroll employment rose by 227,000 in November, a sharp rebound from an upwardly revised increase of 36,000 jobs in October. Since January 2021, the U.S. job market has added jobs for 47 consecutive months, making it the third-longest period of employment expansion on record.

The estimates for the previous two months were revised higher. The monthly change in total nonfarm payroll employment for September was revised up by 32,000, from +223,000 to +255,000, while the change for October was revised up by 24,000 from +12,000 to +36,000. Combined, the revisions were 56,000 higher than previously reported.

In the first eleven months of 2024, 1,984,000 jobs were created. Additionally, monthly employment growth averaged 180,000 per month, compared to the 251,000 monthly average gain for 2023. The U.S. economy has created more than 8 million jobs since March 2022, when the Fed enacted the first interest rate hike of this cycle.

The unemployment rate ticked up to 4.2% in November, marking the seventh month that the unemployment rate has been at or above 4.0%. While the number of employed persons decreased by 355,000, the number of unemployed persons rose by 161,000.

Meanwhile, the labor force participation rate—the proportion of the population either looking for a job or already holding a job—decreased by one percentage point to 62.5%. However, for people aged between 25 and 54, the participation rate remained at 83.5% for the second straight month. While the overall labor force participation rate remains below its pre-pandemic levels of 63.3% at the beginning of 2020, the rate for people aged between 25 and 54 exceeds the pre-pandemic level of 83.1%.

In November, employment continued to trend up in health care (+54,000), leisure and hospitality (+53,000), government (+33,000), and social assistance (+19,000). Employment in transportation equipment manufacturing increased in November as workers who were on strike returned to work. Meanwhile, retail trade lost 28,000 jobs.

Construction Employment

Employment in the overall construction sector increased by 10,000 in November, after 2,000 gains in October. While residential construction gained 3,100 jobs, non-residential construction employment added 6,800 jobs for the month.

Residential construction employment now stands at 3.4 million in November, broken down as 958,000 builders and 2.4 million residential specialty trade contractors. The 6-month moving average of job gains for residential construction was 2,983 a month. Over the last 12 months, home builders and remodelers added 52,400 jobs on a net basis. Since the low point following the Great Recession, residential construction has gained 1,391,400 positions.

In November, the unemployment rate for construction workers remained at 5.3% on a seasonally adjusted basis. The unemployment rate for construction workers has remained at a relatively lower level, after reaching 15.3% in April 2020 due to the housing demand impact of the COVID-19 pandemic.

Discover more from Eye On Housing

Subscribe to get the latest posts sent to your email.


This article was originally published by a eyeonhousing.org . Read the Original article here. .

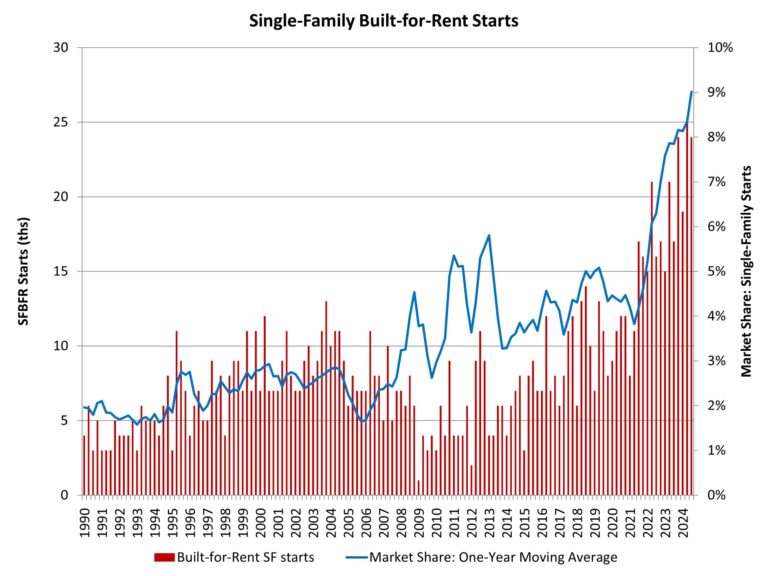
Single-family built-for-rent construction posted year-over-year gains for the third quarter of 2024, as builders sought to add additional rental housing in a market facing ongoing, elevated mortgage interest rates.

According to NAHB’s analysis of data from the Census Bureau’s Quarterly Starts and Completions by Purpose and Design, there were approximately 24,000 single-family built-for-rent (SFBFR) starts during the third quarter of 2024. This is 41% higher than the third quarter of 2023. Over the last four quarters, 92,000 such homes began construction, which is a more than 31% increase compared to the 70,000 estimated SFBFR starts in the four quarters prior to that period.

The SFBFR market is a source of inventory amid challenges over housing affordability and downpayment requirements in the for-sale market, particularly during a period when a growing number of people want more space and a single-family structure. Single-family built-for-rent construction differs in terms of structural characteristics compared to other newly-built single-family homes, particularly with respect to home size. However, investor demand for single-family homes, both existing and new, has cooled with higher interest rates. Nonetheless, builders continue to build projects of built-for-rent homes for their own operation.

Given the relatively small size of this market segment, the quarter-to-quarter movements typically are not statistically significant. The current four-quarter moving average of market share (9%) is nonetheless higher than the historical average of 2.7% (1992-2012).

Importantly, as measured for this analysis, the estimates noted above include only homes built and held by the builder for rental purposes. The estimates exclude homes that are sold to another party for rental purposes, which NAHB estimates may represent another three to five percent of single-family starts based on industry surveys. However, this investor market has cooled somewhat in recent quarters due to higher interest rates.

The Census data notes an elevated share of single-family homes built as condos (non-fee simple), with this share averaging more than 4% over recent quarters. Some, but certainly not all, of these homes will be used for rental purposes. Additionally, it is theoretically possible some single-family built-for-rent units are being counted in multifamily starts, as a form of “horizontal multifamily,” given these units are often built on a single plat of land. However, spot checks by NAHB with permitting offices indicate no evidence of this data issue occurring.

With the onset of the Great Recession and declines for the homeownership rate, the share of built-for-rent homes increased in the years after the recession. While the market share of SFBFR homes is small, it has clearly expanded. Given affordability challenges in the for-sale market, the SFBFR market will likely retain an elevated market share even as the rest of the building market expands in the coming quarters.

Discover more from Eye On Housing

Subscribe to get the latest posts sent to your email.


This article was originally published by a eyeonhousing.org . Read the Original article here. .
Pin It