Tag

GDP

Browsing


Real GDP of metropolitan areas rose 2.7% in 2023, with the “real estate, rental and leasing” sector contributing 0.34 percentage points and construction contracting growth by 0.11 percentage points. While many metro areas followed the national growth trend, each region has its unique economic narrative. This article explores the economic trends driving these outcomes, focusing on the leading metro areas in real GDP growth, the construction sector’s standout performers over a five-year period, and the top MSAs benefiting from growth in real estate, rental, and leasing.

In 2023, real GDP increased in 348 Metropolitan Statistical Areas (MSAs), decreased in 34 MSAs, and remained unchanged in 3 MSAs, according to the U.S. Bureau of Economic Analysis (BEA). The data, which was recently released in December 2024, shows the range of growth spanned from 42.9% in Midland, TX, to a contraction of -9.3% in Elkhart-Goshen, IN. Three MSAs—Ithaca, NY, Joplin, MO, and Longview, WA—saw no change in real GDP.

The oil and gas sector played a significant role in driving growth in many MSAs. Midland, TX, recorded the highest growth due to a surge in oil production, with the “mining, quarrying, and oil and gas extraction” industry contributing a hefty 41.2 percentage points to the metro area’s GDP growth. Furthermore, among the top five highest growth areas, four had this industry as the leading contributor.

Top Five MSAs by Real GDP Growth and Leading Contributing Industry

Metro Area2023 Real GDP Growth (%)Largest Contributing IndustryContribution (Percentage Points)Midland, TX42.9Mining, quarrying, and oil and gas extraction41.2Greeley, CO18.5Mining, quarrying, and oil and gas extraction15.5El Centro, CA16.4Agriculture, forestry, fishing, and hunting14.4Odessa, TX11.6Mining, quarrying, and oil and gas extraction7.1Wheeling, WV-OH10.7Mining, quarrying, and oil and gas extraction9.9

Construction Sector Growth (2018–2023)

From 2018 to 2023, the construction industry exhibited a mixed performance, with 140 MSAs reporting positive compound annual growth rates (CAGR), 188 recording declines, and 5 showing no change. States like Idaho, Arizona, and Florida emerged as hotspots for construction growth during this period while states in the East North Central division appear to have slowdowns in this sector.

Elizabethtown-Fort Knox, KY, led with a 14.4% CAGR in construction. This boom was primarily driven by the development of the BlueOval SK Battery Park, slated to begin production in 2025. This joint venture between Ford Motor Company and SK On, a South Korean electric vehicle (EV) supplier, is expected to be the largest EV battery manufacturing facility globally.

According to a study by the Hardin County Chamber of Commerce (HCCC), the project is estimated to:

Generate $1.6 billion in construction payroll.

Create 5,000 jobs by the end of 2025.

Require 3,100 additional housing units to accommodate new workers.

Top Five MSAs for Construction Growth (2018–2023):

Metro AreaCAGR (%)Average Contribution (Percentage Points)Elizabethtown-Fort Knox, KY14.40.45Clarksville, TN-KY10.80.03Punta Gorda, FL10.61.12Jacksonville, NC10.20.32The Villages, FL10.11.23

Real Estate, Rental, and Leasing Growth (2018–2023)

The real estate, rental, and leasing sector also showed robust growth in many regions, with 209 MSAs experiencing positive growth during the five-year period. The Villages, FL, recorded the highest CAGR at 14.1%, reflecting its status as the nation’s largest community designed for an aging population.

Other MSAs like Jonesboro, AR, saw significant real estate growth due to proximity to Arkansas State University, while Austin-Round Rock-Georgetown, TX, benefited from a population influx because of its thriving tech economy.

Top Five MSAs for Real Estate Growth (2018–2023):

Metro AreaCAGR (%)Average Contribution (Percentage Points)The Villages, FL14.13.6Jonesboro, AR12.11.2Twin Falls, ID10.81.1Austin-Round Rock-Georgetown, TX10.71.4El Centro, CA10.60.6

Visit NAHB’s dashboard for additional data and visualizations on demographics, housing market and the economy for all metro areas.

Discover more from Eye On Housing

Subscribe to get the latest posts sent to your email.


This article was originally published by a eyeonhousing.org . Read the Original article here. .


Real gross domestic product (GDP) increased in 45 states and the District of Columbia in the third quarter of 2024 compared to the second quarter of 2024 according to the U.S. Bureau of Economic Analysis (BEA). Iowa reported no change during this time. The percent change in real GDP ranged from a 6.9 percent increase at an annual rate in Arkansas to a 2.3 percent decline in North Dakota.

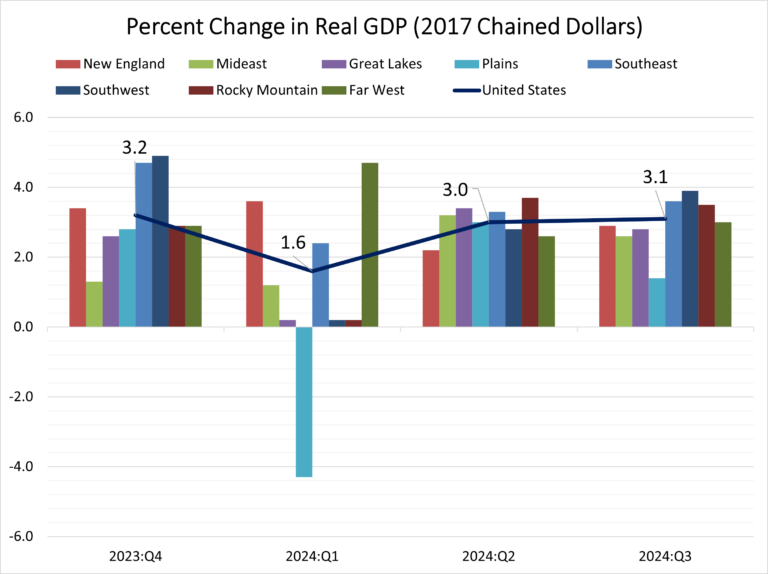
Nationwide, growth in real GDP (measured on a seasonally adjusted annual rate basis) increased 3.1 percent in the third quarter of 2024, which is roughly the same as the second quarter level of 3.0 percent. Retail trade, health care and social assistance, and information were the leading contributors to the increase in real GDP across the country.

Regionally, real GDP growth increased in all eight regions between the second and the third quarter. The percent change in real GDP ranged from a 3.9 percent increase in the Southwest region (Arizona, New Mexico, Oklahoma, and Texas) to a 1.4 percent increase in the Plains region (Iowa, Kansas, Minnesota, Missouri, Nebraska, North Dakota, and South Dakota).

At the state level, Arkansas posted the highest GDP growth rate (6.9 percent) followed by Alabama (6.0 percent) and Mississippi (5.1 percent). On the other hand, three out of the seven states that makes up and Plains region, South Dakota (-0.8 percent), Nebraska (-1.4 percent), and North Dakota (-2.3 percent) along with Montana (-0.1 percent) posted an economic contraction in the third quarter of 2024.

The agriculture, forestry, fishing, and hunting industry increased in 25 states, was the leading contributor to growth in five states including Arkansas, Alabama, and Mississippi, the states with the largest increases in real GDP. In contrast, this industry was the leading offset to growth in 14 states including North Dakota, Nebraska, South Dakota, and Montana, the only states with declines in real GDP.

Discover more from Eye On Housing

Subscribe to get the latest posts sent to your email.


This article was originally published by a eyeonhousing.org . Read the Original article here. .

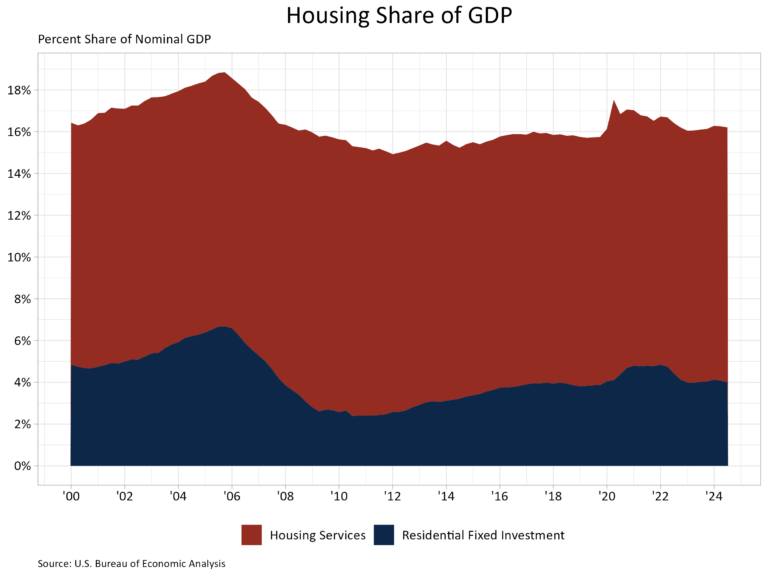
Housing’s share of the economy fell 0.1 percentage points to 16.2% in the third quarter of 2024 according to the advance estimate of GDP produced by the Bureau of Economic Analysis. The share was revised upwards for both the first and second quarter of 2024 to 16.3%.

The more cyclical home building and remodeling component – residential fixed investment (RFI) – was 4.0% of GDP, slightly lower than the 4.1% in the second quarter. RFI subtracted 21 basis points from the headline GDP growth rate in the third quarter of 2024, the second consecutive quarter where RFI negatively contributed to GDP growth.

In the third quarter, housing services added 18 basis points (bps) to GDP growth while the share grew to 12.2% of GDP. Among household expenditures for services, housing services contributions were the third-highest contributor to headline GDP growth behind health care (30 bps) and food service and accommodations (19 bps), while above other services (12 bps) and transportation services (10 bps). The graph above stacks the nominal shares for housing services and RFI, resulting in housing’s total share of the economy.

Overall GDP increased at a 2.8% annual rate, down from a 3.0% increase in the second quarter of 2024, but up from a 1.6% increase in the first quarter of 2024.

Housing-related activities contribute to GDP in two basic ways:

The first is through residential fixed investment (RFI). RFI is effectively the measure of home building, multifamily development, and remodeling contributions to GDP. RFI consists of two specific types of investment, the first is residential structures. This investment includes construction of new single-family and multifamily structures, residential remodeling, production of manufactured homes, brokers’ fees and some types of equipment that are built into the structure. RFI’s second component, residential equipment, includes investment such as furniture or household appliances that are purchased by landlords for rental to tenants.

For the third quarter, RFI was 4.0% of the economy, recording a $1.175 trillion seasonally adjusted annual pace. RFI shrank 5.1% at an annual rate in the third quarter after falling 2.8% in the second. Among the two types of RFI, real investment in residential structures fell 5.3% while for residential equipment it rose 2.2%. Investment in residential structures stood at a seasonally adjusted annual pace of $1.153 trillion, making its share of residential investment far greater than that of residential equipment, which was at seasonally adjusted annual pace of $21.5 billion.

The second impact of housing on GDP is the measure of housing services. Similar as we saw with RFI, housing services consumption can be broken out into two components. The first component, housing, includes gross rents paid by renters, owners’ imputed rent (an estimate of how much it would cost to rent owner-occupied units), rental value of farm dwellings and group housing. The inclusion of owners’ imputed rent is necessary from a national income accounting approach, because without this measure, increases in homeownership would result in declines in GDP. The second component, household utilities, is composed of consumption expenditures on water supply, sanitation, electricity, and gas.

For the third quarter, housing services represented 12.2% of the economy or $3.581 trillion on a seasonally adjusted annual basis. Housing services grew 1.5% at an annual rate in the third quarter. Real personal consumption expenditures for housing grew 1.4% while household utilities expenditures grew 1.7%. At current dollar expenditure level, housing expenditures was $3.124 trillion and household utility expenditures stood at $456.6 billion in seasonally adjusted annual rates.

Housing service growth is much less volatile when compared to RFI due to the cyclical nature of RFI. Historically, RFI has averaged roughly 5% of GDP while housing services have averaged between 12% and 13%, for a combined 17% to 18% of GDP. These shares tend to vary over the business cycle. However, the housing share of GDP lagged during the post-Great Recession period due to underbuilding, particularly for the single-family sector.

Discover more from Eye On Housing

Subscribe to get the latest posts sent to your email.


This article was originally published by a eyeonhousing.org . Read the Original article here. .

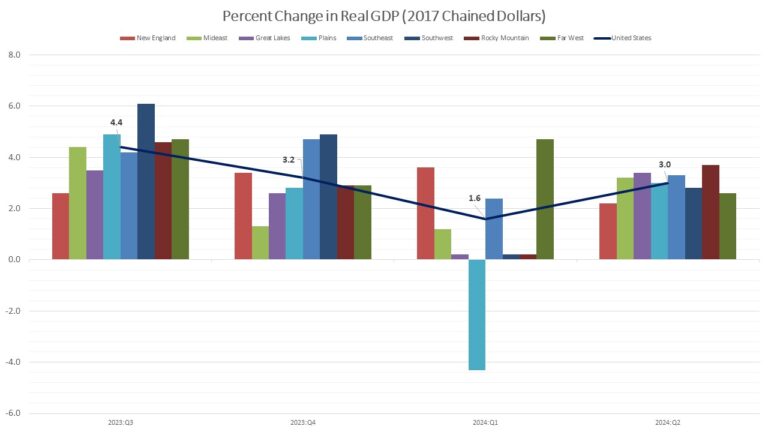
Real gross domestic product (GDP) increased in 49 states and the District of Columbia in the second quarter of 2024 compared to the last quarter of 2023 according to the U.S. Bureau of Economic Analysis (BEA). Alaska reported an economic contraction during this time. The percent change in real GDP ranged from a 5.9 percent increase at an annual rate in Idaho to a 1.1 percent decline in Alaska.

Nationwide, growth in real GDP (measured on a seasonally adjusted annual rate basis) increased 3.0 percent in the second quarter of 2024, which is higher than the first quarter level of 1.6 percent. Nondurable-goods manufacturing; finance and insurance; and health care and social assistance were the leading contributors to the increase in real GDP across the country.

Regionally, real GDP growth increased in all eight regions between the first and the second quarter. The percent change in real GDP ranged from a 3.7 percent increase in the Rocky Mountain region (Colorado, Idaho, Montana, Utah, and Wyoming) to a 2.2 percent increase in the New England region (Connecticut, Maine, Massachusetts, New Hampshire, Rhode Island, and Vermont).

At the state level, Idaho posted the highest GDP growth rate (5.9 percent) followed by Kansas (5.6 percent) and Nebraska (5.3 percent). On the other hand, Alaska posted an economic contraction in the second quarter of 2024. The agriculture, forestry, fishing, and hunting industry was the leading contributor to growth in 11 states including Idaho, Kansas, Nebraska, and the states with the highest increases in real GDP, respectively. Mining, which declined in 33 states, was the leading contributor to the decrease in real GDP in Alaska, the only state with a decline in real GDP.

Discover more from Eye On Housing

Subscribe to get the latest posts sent to your email.


This article was originally published by a eyeonhousing.org . Read the Original article here. .
Pin It