Tag

Gain

Browsing


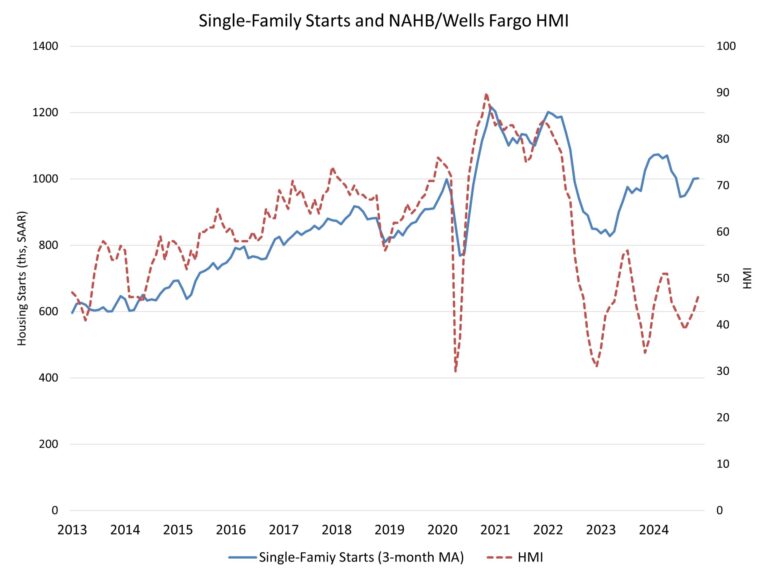
Ongoing lean levels of single-family existing home inventory helped to boost single-family production in November, while overall housing production fell because of a double-digit percentage drop in multifamily construction.

Overall housing starts decreased 1.8% in November to a seasonally adjusted annual rate of 1.29 million units, according to a report from the U.S. Department of Housing and Urban Development and the U.S. Census Bureau.

The November reading of 1.29 million starts is the number of housing units builders would begin if development kept this pace for the next 12 months. Within this overall number, single-family starts increased 6.4% to a 1.01 million seasonally adjusted annual rate. On a year-to-date basis, single-family construction is up 7.2%. The multifamily sector, which includes apartment buildings and condos, decreased 23.2% to an annualized 278,000 pace.

While the pace of single-family starts increased in November, single-family permitting was flat as builders face mixed market conditions that include an election result that promises a focus on regulatory relief, but ongoing elevated mortgage rates.

NAHB is forecasting single-family starts to post a slight increase in 2025 as the financing conditions for builders improve modestly. The significant decline for apartment construction is forecasted to end next year, with that market stabilizing during the second half of 2025.

On a regional and year-to-date basis, combined single-family and multifamily starts are 7.3% higher in the Northeast, 2.4% lower in the Midwest, 5.8% lower in the South and 5.9% lower in the West.

Overall permits increased 6.1% to a 1.51 million unit annualized rate in November. Single-family permits increased 0.1% to a 972,000 unit rate and are up 8.0% on a year-to-date basis. Multifamily permits increased 19.0% to an annualized 533,000 pace.

Looking at regional data on a year-to-date basis, permits are 3.2% higher in the Northeast, 4.8% higher in the Midwest, 2.5% lower in the South and 7.0% lower in the West.

The number of single-family units under construction is down 6.3% from a year ago, declining to 637,000 homes. The number of multifamily units under construction is down 20.5% from a year ago, to 797,000 units.

In November, there were two multifamily units completed for every one unit starting construction. Two years ago, there were just 0.7 multifamily units being completed for every 1 unit starting construction.

The count of multifamily units in 5-plus unit properties units completing construction of is up 36.1% on a year-to-date basis for 2024. In contrast, single-family completions are up 3.6% on a year-to-date basis.

Discover more from Eye On Housing

Subscribe to get the latest posts sent to your email.


This article was originally published by a eyeonhousing.org . Read the Original article here. .


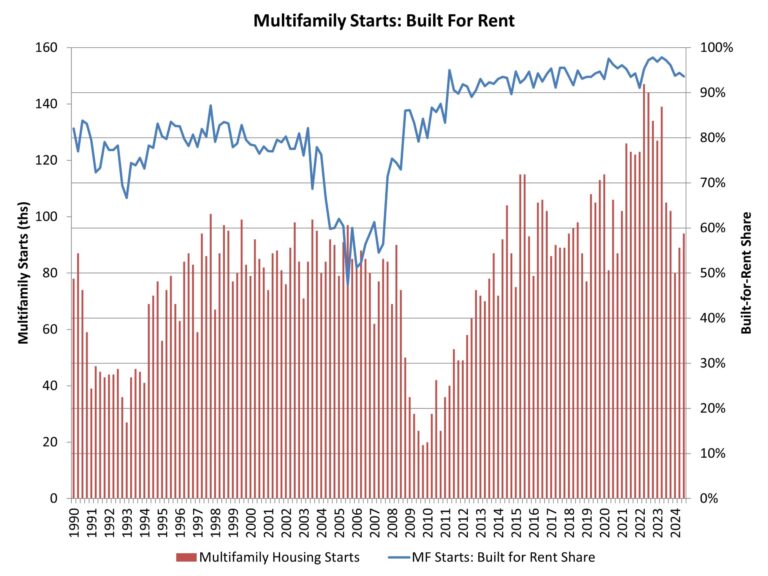
According to NAHB analysis of quarterly Census data, the count of multifamily, for-rent housing starts declined during the third quarter of 2024. For the quarter, 94,000 multifamily residences started construction. Of this total, 88,000 were built-for-rent. This was almost 14% lower than the third quarter of 2023.

The market share of rental units of multifamily construction starts declined to below 94% for the third quarter, as the built-for-sale, multifamily condo market experienced a gain. The historical low market share of 47% for bult-for-rent multifamily construction was set during the third quarter of 2005, during the condo building boom. An average share of 80% was registered during the 1980-2002 period.

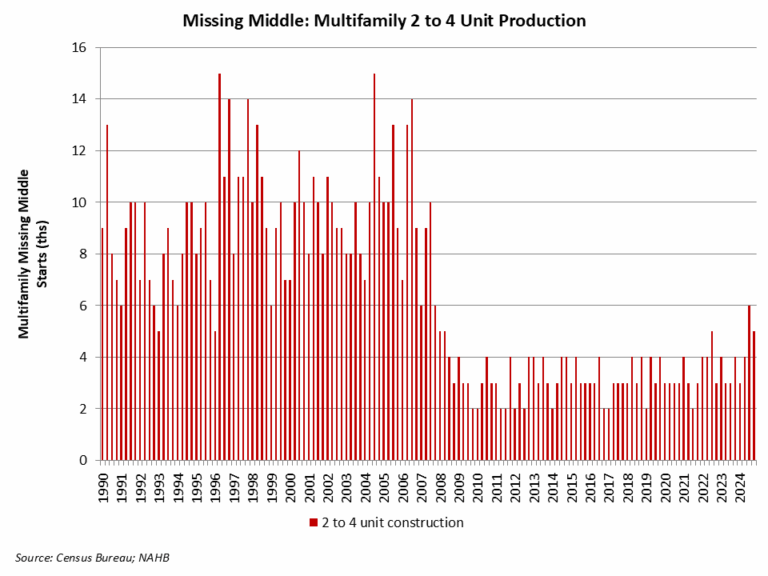
For the third quarter, there were 6,000 multifamily condo unit construction starts, up from 3,000 a year ago. While still a small market, this was the highest quarterly count since mid-2022.

An elevated rental share of multifamily construction is holding typical apartment size below levels seen during the pre-Great Recession period. According to third quarter 2024 data, the average square footage of multifamily construction starts ticked higher to 1,061 square feet. The median edged up to 1,013 square feet. These estimates are near multidecade lows.

Discover more from Eye On Housing

Subscribe to get the latest posts sent to your email.


This article was originally published by a eyeonhousing.org . Read the Original article here. .


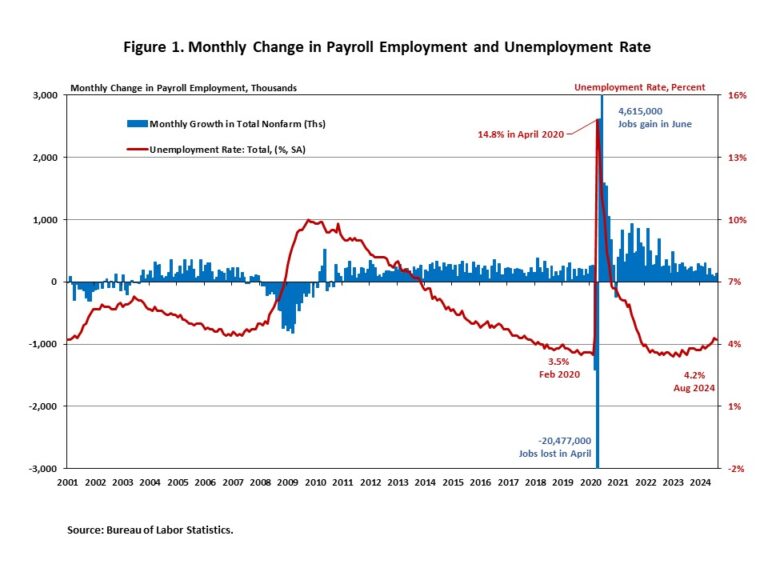
Today’s jobs report and the newly released preliminary estimate of the benchmark revision indicate that the U.S. labor market is slowing from its overheated state in 2021 and 2022 but remains stable. Among all sectors, construction led the August job gains, adding 34,000 jobs to payrolls.

Additionally, wage growth accelerated in August. Wages grew at a 3.8% year-over-year (YOY) growth rate, down 0.7 percentage points from a year ago. Wage growth is outpacing inflation, which typically occurs as productivity increases.

National Employment

Total nonfarm payroll employment increased by 142,000 in August, following a downwardly revised increase of 89,000 jobs in July, as reported in the Employment Situation Summary. The estimates for the previous two months were revised lower. The monthly change in total nonfarm payroll employment for June was revised down by 61,000, from +179,000 to +118,000, while the change for July was revised down by 25,000 from +114,000 to +89,000. Combined, the revisions were 86,000 lower than the original estimates.

Despite restrictive monetary policy, about 7.9 million jobs have been created since March 2022, when the Fed enacted the first interest rate hike of this cycle. In the first eight months of 2024, 1,475,000 jobs were created. Additionally, monthly employment growth averaged 184,000 per month, compared with the 251,000 monthly average gain for 2023.

In August, the unemployment rate eased slightly to 4.2%, from 4.3% in July. The August decrease in the unemployment rate reflected the decrease in the number of persons unemployed (-48,000) and the increase in the number of persons employed (+168,000).

Meanwhile, the labor force participation rate—the proportion of the population either looking for a job or already holding a job—remained at 62.7%. However, for people aged between 25 and 54, the participation rate dipped slightly to 83.9%. This rate exceeds the pre-pandemic level of 83.1%. Meanwhile, the overall labor force participation rate is still below its pre-pandemic levels when it stood at 63.3% at the beginning of 2020.

For industry sectors, construction (+34,000), health care (+31,000), and social assistance (+13,000) had job gains in August, while manufacturing lost 24,000 jobs. Employment in other major industries showed little change over the month.

Construction Employment

Employment in the overall construction sector in August (+34,000) experienced an increase, from the 13,000 job gains in July. While residential construction gained 5,600 jobs, non-residential construction employment added 28,300 jobs for the month.

Residential construction employment now stands at 3.4 million in August, broken down as 951,000 builders and 2.4 million residential specialty trade contractors. The 6-month moving average of job gains for residential construction was 5,667 a month. Over the last 12 months, home builders and remodelers added 63,100 jobs on a net basis. Since the low point following the Great Recession, residential construction has gained 1,385,000 positions.

In August, the unemployment rate for construction workers declined to 3.9% on a seasonally adjusted basis. The unemployment rate for construction workers has remained at a relatively lower level, after reaching 15.3% in April 2020, due to the housing demand impact of the COVID-19 pandemic.

Discover more from Eye On Housing

Subscribe to get the latest posts sent to your email.


This article was originally published by a eyeonhousing.org . Read the Original article here. .

Pin It