Tag

Falls

Browsing


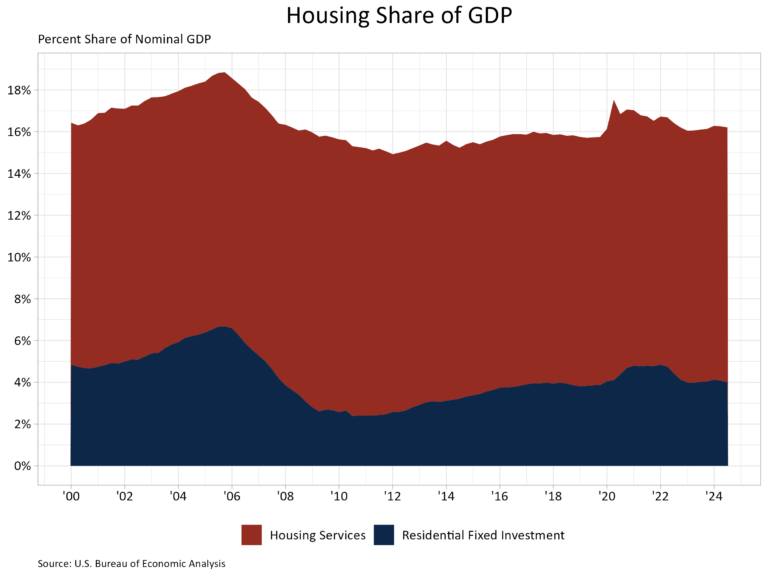
Housing’s share of the economy fell 0.1 percentage points to 16.2% in the third quarter of 2024 according to the advance estimate of GDP produced by the Bureau of Economic Analysis. The share was revised upwards for both the first and second quarter of 2024 to 16.3%.

The more cyclical home building and remodeling component – residential fixed investment (RFI) – was 4.0% of GDP, slightly lower than the 4.1% in the second quarter. RFI subtracted 21 basis points from the headline GDP growth rate in the third quarter of 2024, the second consecutive quarter where RFI negatively contributed to GDP growth.

In the third quarter, housing services added 18 basis points (bps) to GDP growth while the share grew to 12.2% of GDP. Among household expenditures for services, housing services contributions were the third-highest contributor to headline GDP growth behind health care (30 bps) and food service and accommodations (19 bps), while above other services (12 bps) and transportation services (10 bps). The graph above stacks the nominal shares for housing services and RFI, resulting in housing’s total share of the economy.

Overall GDP increased at a 2.8% annual rate, down from a 3.0% increase in the second quarter of 2024, but up from a 1.6% increase in the first quarter of 2024.

Housing-related activities contribute to GDP in two basic ways:

The first is through residential fixed investment (RFI). RFI is effectively the measure of home building, multifamily development, and remodeling contributions to GDP. RFI consists of two specific types of investment, the first is residential structures. This investment includes construction of new single-family and multifamily structures, residential remodeling, production of manufactured homes, brokers’ fees and some types of equipment that are built into the structure. RFI’s second component, residential equipment, includes investment such as furniture or household appliances that are purchased by landlords for rental to tenants.

For the third quarter, RFI was 4.0% of the economy, recording a $1.175 trillion seasonally adjusted annual pace. RFI shrank 5.1% at an annual rate in the third quarter after falling 2.8% in the second. Among the two types of RFI, real investment in residential structures fell 5.3% while for residential equipment it rose 2.2%. Investment in residential structures stood at a seasonally adjusted annual pace of $1.153 trillion, making its share of residential investment far greater than that of residential equipment, which was at seasonally adjusted annual pace of $21.5 billion.

The second impact of housing on GDP is the measure of housing services. Similar as we saw with RFI, housing services consumption can be broken out into two components. The first component, housing, includes gross rents paid by renters, owners’ imputed rent (an estimate of how much it would cost to rent owner-occupied units), rental value of farm dwellings and group housing. The inclusion of owners’ imputed rent is necessary from a national income accounting approach, because without this measure, increases in homeownership would result in declines in GDP. The second component, household utilities, is composed of consumption expenditures on water supply, sanitation, electricity, and gas.

For the third quarter, housing services represented 12.2% of the economy or $3.581 trillion on a seasonally adjusted annual basis. Housing services grew 1.5% at an annual rate in the third quarter. Real personal consumption expenditures for housing grew 1.4% while household utilities expenditures grew 1.7%. At current dollar expenditure level, housing expenditures was $3.124 trillion and household utility expenditures stood at $456.6 billion in seasonally adjusted annual rates.

Housing service growth is much less volatile when compared to RFI due to the cyclical nature of RFI. Historically, RFI has averaged roughly 5% of GDP while housing services have averaged between 12% and 13%, for a combined 17% to 18% of GDP. These shares tend to vary over the business cycle. However, the housing share of GDP lagged during the post-Great Recession period due to underbuilding, particularly for the single-family sector.

Discover more from Eye On Housing

Subscribe to get the latest posts sent to your email.


This article was originally published by a eyeonhousing.org . Read the Original article here. .

Private residential construction spending fell 0.3% in August, according to the Census Construction Spending data. Nevertheless, it remained 2.7% higher compared to a year ago.

The monthly decline in total private construction spending for August was largely due to reduced spending on single-family and multifamily construction. Spending on single-family construction fell by 1.5% in August. This marks the fifth consecutive monthly decrease. The rising new single-family home inventory and expectations for lower interest rates both weight on new home building. Despite these challenges, spending on single-family construction was still 0.8% higher than it was a year earlier.

Multifamily construction spending inched down 0.4% in August after a dip of 0.3% in July. Year-over-year, spending on multifamily construction declined 7.5%, as an elevated level of apartments under construction is being completed. Private residential improvement spending increased 1% in August and was 9.4% higher than a year ago.

The NAHB construction spending index is shown in the graph below (the base is January 2000). The index illustrates how spending on single-family construction has slowed since early 2024 under the pressure of elevated interest rates. Multifamily construction spending growth has also slowed down after the peak in July 2023. Meanwhile, improvement spending has increased its pace since late 2023.

Spending on private nonresidential construction was up 3.6% over a year ago. The annual private nonresidential spending increase was mainly due to higher spending for the class of manufacturing ($36.4 billion), followed by the power category ($8.8 billion).

Discover more from Eye On Housing

Subscribe to get the latest posts sent to your email.


This article was originally published by a eyeonhousing.org . Read the Original article here. .


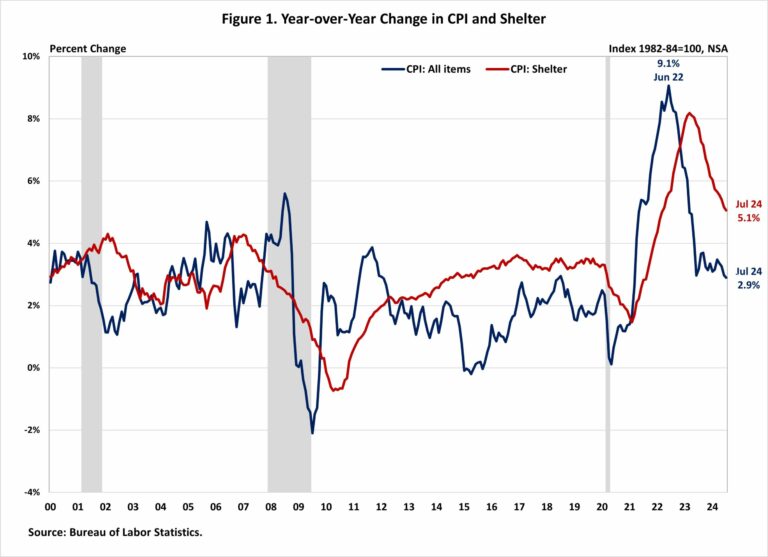
Inflation dropped below a 3% annualized growth rate for the first time since March 2021 even though housing costs continue to climb. Nonetheless, the headline reading is another dovish signal for future monetary policy, following signs of weakness in the most recent job report.   

Despite a slowdown in the year-over-year increase, shelter costs continue to exert significant upward pressure on inflation, contributing nearly 90% of the monthly increase in overall inflation and over 70% of the total 12-month increase in core inflation. As consistent disinflation and a cooling labor market bring the economy into better balance, the Fed is likely to further solidify behind the case for rate cuts, which could help ease some pressure on the housing market.

The Fed’s ability to address rising housing costs is limited because increases are driven by a lack of affordable supply and increasing development costs. Additional housing supply is the primary solution to tame housing inflation. However, the Fed’s tools for promoting housing supply are constrained. In fact, further tightening of monetary policy would hurt housing supply because it would increase the cost of AD&C financing. This can be seen on the graph below, as shelter costs continue to rise despite Fed policy tightening. Nonetheless, the NAHB forecast expects to see shelter costs decline further in the coming months.  This is supported by real-time data from private data providers that indicate a cooling in rent growth.

The Bureau of Labor Statistics reported that the Consumer Price Index (CPI) rose by 0.2% in July on a seasonally adjusted basis, after declining 0.1% in June. Excluding the volatile food and energy components, the “core” CPI increased by 0.2% in July, after a 0.1% increase in June.

The price index for a broad set of energy sources remained flat in July, with increases in electricity (+0.1%) and fuel oil (+0.9%) offsetting a decline in natural gas (-0.7%). The natural gas index was unchanged in July. Meanwhile, the food index rose 0.2%, as it did in June. The index for food away from home increased by 0.2% and the index for food at home rose 0.1%.

In July, the index for shelter (+0.4%) continued to be the largest contributor to the monthly increase in all items index. Among other top contributors that rose in July include indexes for motor vehicle insurance (+1.2%) as well as household furnishings and operations (+0.3%). Meanwhile, the top contributors that experienced a decline in July include indexes for used cars and trucks (-2.3%), medical care (-0.2%), airline fares (-1.6%), and apparel (-0.4%). The index for shelter makes up more than 40% of the “core” CPI. The index saw a 0.4% rise in July, following an increase of 0.2% in June. The indexes for owners’ equivalent rent (OER) increased by 0.4% and rent of primary residence (RPR) rose by 0.5% over the month. These gains have been the largest contributors to headline inflation in recent months. 

During the past twelve months, on a non-seasonally adjusted basis, the CPI rose by 2.9% in July, following a 3.0% increase in June. The “core” CPI increased by 3.2% over the past twelve months, following a 3.3% increase in June. This was the slowest annual gain since April 2021. Over the past twelve months, the food index rose by 2.2%, and the energy index increased by 1.1%. This marks the fifth consecutive month of year-over-year increases for the energy index since February 2024.

NAHB constructs a “real” rent index to indicate whether inflation in rents is faster or slower than overall inflation. It provides insight into the supply and demand conditions for rental housing. When inflation in rents is rising faster than overall inflation, the real rent index rises and vice versa. The real rent index is calculated by dividing the price index for rent by the core CPI (to exclude the volatile food and energy components). In July, the Real Rent Index rose by 0.3%, after a 0.2% increase in June. Over the first seven months of 2024, the monthly growth rate of the Real Rent Index averaged 0.1%, slower than the average of 0.2% in 2023.

Discover more from Eye On Housing

Subscribe to get the latest posts sent to your email.


This article was originally published by a eyeonhousing.org . Read the Original article here. .

Confidence in the market for new multifamily housing declined year-over-year in the second quarter of 2024, according to results from the Multifamily Market Survey (MMS) released today by the National Association of Home Builders (NAHB).  The MMS produces two separate indices:  The Multifamily Production Index (MPI) had a reading of 44, a decrease of 12 points year-over-year, while the Multifamily Occupancy Index (MOI) had a reading of 81, falling eight points year-over-year.

Multifamily developers are less optimistic than they were at this time last year, given high interest rates and limited financing availability to develop multifamily properties.  However, financial markets may become more stable later in the year, as recent weak economic data make it more likely that the Federal Reserve will cut interest rates.

Multifamily Production Index (MPI)

The MPI is a weighted average of four key market segments: three in the built-for-rent market (garden/low-rise, mid/high-rise, and subsidized) and the built-for-sale (or condominium) market.  The survey asks multifamily builders to rate the current conditions as “good”, “fair”, or “poor” for multifamily starts in markets where they are active.  The index and all its components are scaled so that a number above 50 indicates that more respondents report conditions as good rather than poor.

Even though all four of the components posted year-over-year declines in the second quarter, sentiment about production of garden/low-rise apartments and subsidized apartments remained in positive territory above 50. The component measuring garden/low-rise fell 11 points to 53, the component measuring subsidized units decreased four points to 51, the component measuring built-for-sale units posted a seven-point decline to 38, and the component measuring mid/high-rise units dropped 18 points to 29 (Figure 1).

Multifamily Occupancy Index (MOI)

The MOI is a weighted average of the three built-for-rent market segments (garden/low-rise, mid/high-rise and subsidized).  The survey asks multifamily builders to rate the current conditions for occupancy of existing rental apartments, in markets where they are active, as “good”, “fair”, or “poor”.  Similar in nature to MPI, the index and all its components are scaled so that a number above 50 indicates more respondents report that occupancy is good than report it as poor. 

Although still well above 50, all three components for the MOI experienced year-over-year declines.  The component measuring garden/low-rise fell nine points to 82, mid/high-rise units decreased seven points to 76, and subsidized units decreased six points to 85 (Figure 2).

The MMS was re-designed last year to produce results that are easier to interpret and consistent with the proven format of other NAHB industry sentiment surveys.  Until there is enough data to seasonally adjust the series, changes in the MMS indices should only be evaluated on a year-over-year basis.

Please visit NAHB’s MMS web page for the full report.

Discover more from Eye On Housing

Subscribe to get the latest posts sent to your email.


This article was originally published by a eyeonhousing.org . Read the Original article here. .


Private residential construction spending was down 0.3% in June, after a dip of 0.7% in the prior month, according to the Census Construction Spending data. Nevertheless, it remained 7.3% higher compared to a year ago.

The monthly decline in total private construction spending for June was largely due to reduced spending on single-family construction. Spending on single-family construction fell by 1.2% in June, following a dip of 0.6% in May. This marks the third consecutive monthly decrease. Elevated mortgage interest rates have cooled the housing market, dampening home builder confidence and new home starts. Despite this, spending on single-family construction was still 9.9% higher than it was a year earlier.

Multifamily construction spending inched up 0.1% in June after a dip of 0.6% in May. Year-over-year, spending on multifamily construction declined 7.4%, as an elevated level of apartments under construction is being completed. Private residential improvement spending increased 0.6% in June and was 10.4% higher compared to a year ago.

The NAHB construction spending index is shown in the graph below (the base is January 2000). The index illustrates how spending on single-family construction and home improvements have slowed down the pace since early 2024 under the pressure of elevated interest rates. Multifamily construction spending growth slowed down after the peak in June 2023.

Spending on private nonresidential construction was up 4.2% over a year ago. The annual private nonresidential spending increase was mainly due to higher spending for the class of manufacturing ($37.6 billion), followed by the power category ($13 billion).

Discover more from Eye On Housing

Subscribe to get the latest posts sent to your email.


This article was originally published by a eyeonhousing.org . Read the Original article here. .
Pin It