Tag

Fall

Browsing


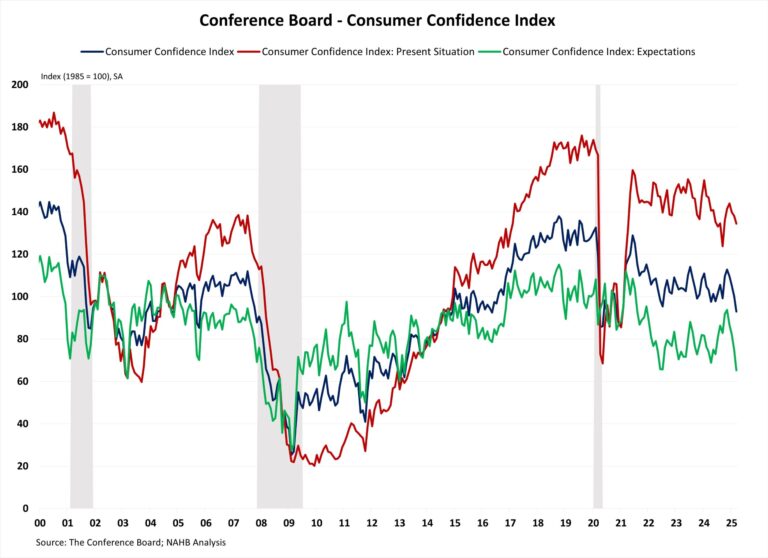
Consumer confidence fell for the fourth straight month amid growing concerns about the economic outlook and policy uncertainties, especially potential tariffs. Uncertainties continue to weigh on consumer sentiment as consumer confidence dropped to a 4-year low and expectations for the future economy fell to a 12-year low. The persistent decline in sentiment has raised recession concerns as consumers have grown pessimistic about economic conditions.

The Consumer Confidence Index, reported by the Conference Board, is a survey measuring how optimistic or pessimistic consumers feel about their financial situation. This index fell from 100 to 92.9 in March, the largest monthly decline since August 2021 and the lowest level since February 2021. The Consumer Confidence Index consists of two components: how consumers feel about their present situation and about their expected situation. The Present Situation Index decreased 3.6 points from 138.1 to 134.5, and the Expectation Situation Index dropped 9.6 points from 74.8 to 65.2, the lowest level since February 2013. This is the second consecutive month that the Expectation Index has been below 80, a threshold that often signals a recession within a year.

Consumers’ assessment of current business conditions turned negative in March. The share of respondents rating business conditions “good” decreased by 1.4 percentage points to 17.7%, while those claiming business conditions as “bad” rose by 1.8 percentage points to 16.7%. However, consumers’ assessments of the labor market improved slightly. The share of respondents reporting that jobs were “plentiful” remained unchanged at 33.6%, and those who saw jobs as “hard to get” decreased by 0.3 percentage points to 15.7%.

Consumers were pessimistic about the short-term outlook. The share of respondents expecting business conditions to improve fell from 20.8% to 17.1%, while those expecting business conditions to deteriorate rose from 25.5% to 27.3%. Similarly, expectations of employment over the next six months were less positive. The share of respondents expecting “more jobs” decreased by 2.1 percentage points to 16.7%, and those anticipating “fewer jobs” climbed by 1.9 percentage points to 28.5%.

The Conference Board also reported the share of respondents planning to buy a home within six months. The share of respondents planning to buy a home rose slightly to 5.4% in March. Of those, respondents planning to buy a newly constructed home increased to 0.5%, and those planning to buy an existing home dropped to 2.3%. The remaining 2.6% were planning to buy a home but undecided between new or existing homes.

Discover more from Eye On Housing

Subscribe to get the latest posts sent to your email.


This article was originally published by a eyeonhousing.org . Read the Original article here. .

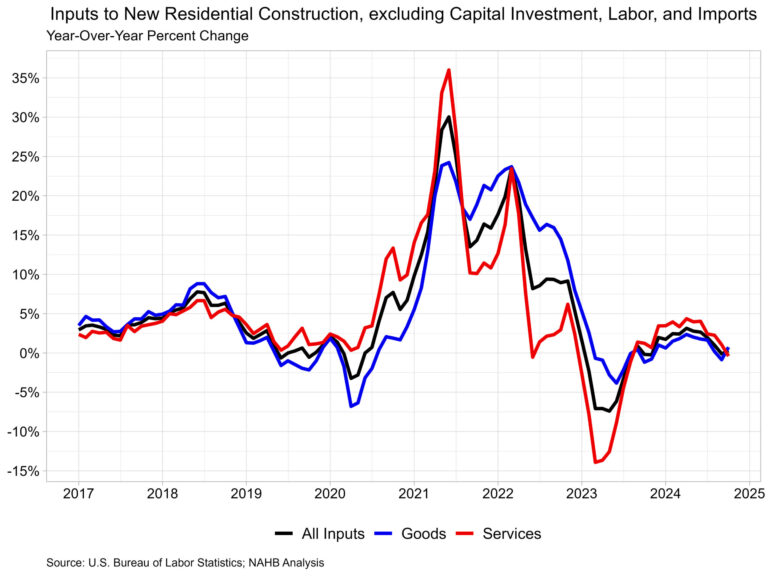
Prices for inputs to new residential construction—excluding capital investment, labor, and imports—decreased 0.2% in October according to the most recent Producer Price Index (PPI) report published by the U.S. Bureau of Labor Statistics. Compared to a year ago, this index is up 0.3% in October after a decline of 0.1% in September.

The inputs to the new residential construction price index can be broken into two components­—one for goods and another for services. The goods component increased 0.7% over the year, while services decreased 0.4%. For comparison, the total final demand index increased 2.4% over the year for October, with final demand with respect to goods up 0.2% and final demand for services up 3.5% over the year.

Input Goods

The goods component has a larger importance to the total residential construction inputs price index, representing around 60%. The price of input goods to new residential construction was up 0.3% in October from September. The input goods to residential construction index can be further broken down into two separate components, one measuring energy inputs with the other measuring goods less energy inputs. The latter of these two components simply represents building materials used in residential construction, which makes up around 93% of the goods index.

Prices for inputs to residential construction, goods less energy, were up 2.0% in October compared to a year ago. This year-over-year increase was larger than in September (1.4%) and was the first percentage point increase in the year-over-year rate since April. The growth rate in October 2023 was 0.8%. The index for inputs to residential construction for energy fell 13.1% year-over-year in October, the third straight yearly decline in input energy prices.

The graph below focuses on the data since the start of 2023 for residential goods inputs. Energy prices have continued to fall over the past year, with only two periods of growth in 2024.

At the individual commodity level, excluding energy, the five commodities with the highest importance for building materials to the new residential construction index were as follows: ready-mix concrete, general millwork, paving mixtures/ blocks, sheet metal products, and wood office furniture/store fixtures. Across these commodities, there was price growth across the board compared to last year. Ready-mix concrete was up 3.7%, wood office furniture/store fixtures up 3.6%, general millwork up 2.8%, paving mixtures/blocks up 2.4% and sheet metal products up 0.6%.

Input Services

Prices of inputs to residential construction for services fell 1.0% in October from September. The price index for service inputs to residential construction can be broken out into three separate components: a trade services component, a transportation and warehousing services component, and a services excluding trade, transportation and warehousing component. The most significant component is trade services (around 60%), followed by services less trade, transportation and warehousing (around 29%), and finally transportation and warehousing services (around 11%). The largest component, trade services, compared to last year was down 1.5% in October after increasing 0.6% in September. The decline in October was the first decline since August 2023, when the trade services index was down 1.2%.

Discover more from Eye On Housing

Subscribe to get the latest posts sent to your email.


This article was originally published by a eyeonhousing.org . Read the Original article here. .

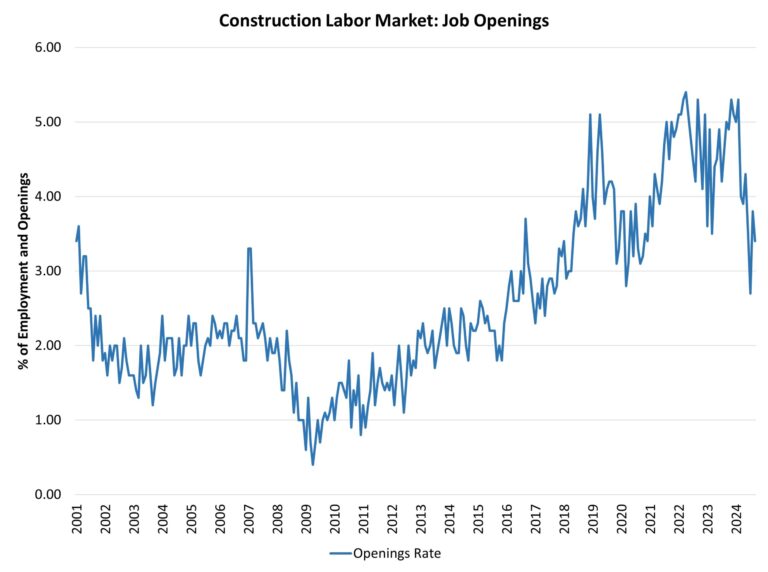
After a period of slowing associated with declines for some elements of residential construction, the count of open construction sector jobs trended lower in the September data, per the Bureau of Labor Statistics’ Job Openings and Labor Turnover Survey (JOLTS). The data indicates the demand for construction labor market remains weaker than a year ago.

In September, after revisions, the number of open jobs for the overall economy declined from 7.86 million to 7.44 million. This is notably smaller than the 9.31 million estimate reported a year ago and a clear sign of a softening aggregate labor market. Previous NAHB analysis indicated that this number had to fall below 8 million on a sustained basis for the Federal Reserve to feel more comfortable about labor market conditions and their potential impacts on inflation. With estimates now remaining near 8 million for national job openings, the Fed has begun a credit easing cycle should continue lowering rates.

The number of open construction sector jobs fell from a revised 328,000 in August to a softer 288,000 in September. Elements of the construction sector slowed in prior months as tight Fed policy persisted. The September reading of opening, unfilled construction jobs is lower than that registered a year ago: 422,000.

The construction job openings rate fell back to 3.4% in September and continues to trend lower.

The layoff rate in construction edged higher to 2.1% in September after a 2% rate in August. The quits rate in construction decreased to just 1.4% in September as job churn slowed.

Discover more from Eye On Housing

Subscribe to get the latest posts sent to your email.


This article was originally published by a eyeonhousing.org . Read the Original article here. .

Despite recent easing mortgage rates and improved inventory, existing home sales fell to a 14-year low in September as elevated home prices are causing potential buyers to hold out for lower rates, according to the National Association of Realtors (NAR). Sales remained sluggish as the lock-in effect kept home prices elevated. However, we expect increased activity in the coming months as mortgage rates moderate with additional Fed easing. Improving inventory should help slow home price growth and enhance affordability.

Homeowners with lower mortgage rates have opted to stay put, avoiding trading existing mortgages for new ones with higher rates. This trend is driving home prices higher and holding back inventory. With the Federal Reserve beginning its easing cycle at the September meeting, mortgage rates are expected to gradually decrease, leading to increased demand and unlocking lock-in inventory in the coming quarters.

Total existing home sales, including single-family homes, townhomes, condominiums, and co-ops, fell 1.0% to a seasonally adjusted annual rate of 3.84 million in September, the lowest level since October 2010. On a year-over-year basis, sales were 3.5% lower than a year ago.

The first-time buyer share remained at 26% in September, matching the lowest level since November 2021 and August 2024, but down from 27% in September 2023.

The existing home inventory level rose from 1.37 million in August to 1.39 million units in September and is up 23.0% from a year ago. At the current sales rate, September unsold inventory sits at a 4.3-months supply, up from 4.2-months last month and 3.4-months a year ago. This inventory level remains low compared to balanced market conditions (4.5 to 6 months’ supply) and illustrates the long-run need for more home construction. However, the count of single-family resale homes available for sale is up almost 22.2% on a year-over-year basis.

Homes stayed on the market for an average of 28 days in September, up from 26 days in August and 21 days in September 2023.

The September all-cash sales share was 30% of transactions, up from 26% in August and 29% a year ago. All-cash buyers are less affected by changes in interest rates.

The September median sales price of all existing homes was $404,500, up 3.0% from last year. This marked the 15th consecutive month of year-over-year increases and the highest level for the month of September. The median condominium/co-op price in September was up 2.2% from a year ago at $361,600. This rate of price growth will slow as inventory increases.

Existing home sales in September were mixed across the four major regions. In the Northeast, Midwest, and South, sales fell by 4.2%, 2.2%, and 1.7%, respectively, while sales in the Midwest rose by 4.1%. On a year-over-year basis, sales decreased in the Northeast (-6.1%), Midwest (-5.3%) and South (-5.5%). Sales in the West increased 5.6% from a year ago.

The Pending Home Sales Index (PHSI) is a forward-looking indicator based on signed contracts. The PHSI rose from 70.2 to 70.6 in August due to lower mortgage rates. On a year-over-year basis, pending sales were 3.0% lower than a year ago per National Association of Realtors data.

Discover more from Eye On Housing

Subscribe to get the latest posts sent to your email.


This article was originally published by a eyeonhousing.org . Read the Original article here. .


4. Butterscotch Beauty

Purple ‘Midnight Fire’ ornamental peppers and cool blue-purple ‘Peacock Red’ kale help set off the butterscotch-colored foliage of a ruffled coral bells (Heuchera sp.) in this fall container design by Stephanie Town of Garden Stories. For more textural interest, the designer added dried dogwood stems, clips of bittersweet berries and wispy Red Rooster sedge (Carex buchananii ‘Red Rooster’).

To transition the container from fall to winter, Town says: “I would transplant the Coral Bells and kale into the bed somewhere. This particular client loves red and a bit of ‘bling,’ so I’ll add spruce tips, red glitter lotus pods and bright red ‘Cardinal’ dogwood, with a skirting of white pine and pepperberry.”

Water requirement: Moderate (watered by hand two to three times a week)
Light requirement: Full sun

Note: Oriental bittersweet can be invasive; American bittersweet is a good substitute. Both species are toxic.


This article was originally published by a www.houzz.com . Read the Original article here. .


Expectations of the Federal Reserve beginning the first in a series of rate reductions kept potential home buyers in a holding pattern in August.

Sales of newly built, single-family homes in August fell 4.7% after an unusually strong July, according to newly released data from the U.S. Department of Housing and Urban Development and the U.S. Census Bureau.  August new home sales registered a 716,000 seasonally adjusted annual rate, after an upwardly revised estimate of 751,000 for July.

Despite the slip in August, the three-month moving average for new home sales is at its highest level since March of 2022. New home sales are up 4% on a year-to-date basis through August.

Builder sentiment and future sales expectations are improving as the Federal Reserve begins a credit easing cycle. However, due to the mortgage interest lock-in effect, declining interest rates will mean rising existing home inventories and some additional new competition for home builders.

While a 7.8 months’ supply may be considered elevated in normal market conditions, there is currently only a 4.1 months’ supply of existing single-family homes on the market. Combined, new and existing total months’ supply remains below historic norms at approximately 4.7, although this measure is expected to increase as more home sellers test the market in the months ahead.

A new home sale occurs when a sales contract is signed, or a deposit is accepted. The home can be in any stage of construction: not yet started, under construction or completed. In addition to adjusting for seasonal effects, the August reading of 716,000 units is the number of homes that would sell if this pace continued for the next 12 months.

New single-family home inventory increased 1.7% to 467,000 in August, a 7.8 months’ supply at the current sales pace.  Completed, ready to occupy inventory increased to 105,000 homes, which is the highest level since 2009. However, this share makes up only 22% of new home inventory.

Median new home price fell back to $420,600, down 4.6% from a year ago due to builder price incentives amid multidecade highs for housing affordability challenges. The Census data reveals a gain for new home sales priced below $300,000, which made up 18% of new home sales in August compared to 12% a year ago.

Regionally, on a year-to-date basis, new home sales are up in all four regions, rising 2.1% in the Northeast, 21.9% in the Midwest, 0.8% in the South and 4.7% in the West.

Discover more from Eye On Housing

Subscribe to get the latest posts sent to your email.


This article was originally published by a eyeonhousing.org . Read the Original article here. .


This article was originally published by a
www.houzz.com . Read the Original article here. .


This article was originally published by a
www.houzz.com . Read the Original article here. .


This article was originally published by a
www.houzz.com . Read the Original article here. .



This article was originally published by a
www.houzz.com . Read the Original article here. .

Pin It