Tag

Energy

Browsing


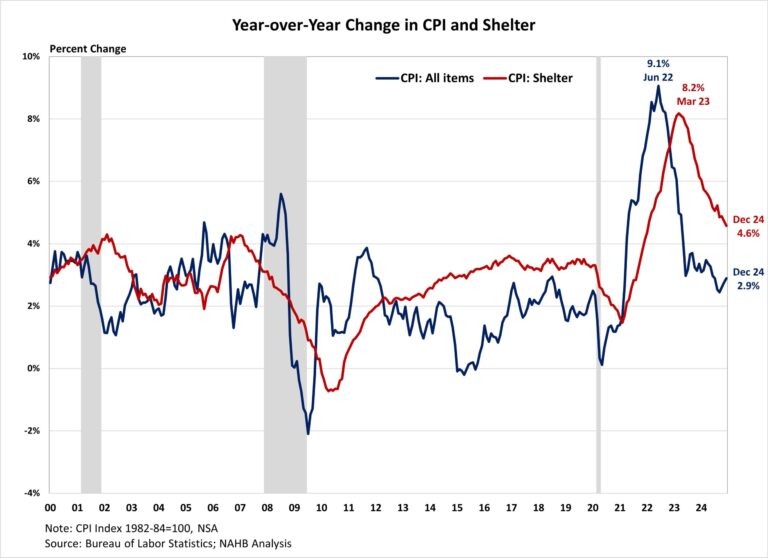
Inflation edged up to a five-month high in December as energy prices surged, accounting for more than 40% of the monthly headline increase. Inflation ended 2024 at a 2.9% rate, down from 3.4% a year ago, although the last mile to the Fed’s 2% target continues to be challenging. While core inflation remained stubborn due to elevated shelter and other service costs, housing costs showed signs of cooling – the year-over-year change in the shelter index remained below 5% for a fourth straight month and posted its lowest annual gain since January 2022, suggesting a continued moderation in housing inflation.

While the Fed’s interest rate cuts could help ease some pressure on the housing market, its ability to address rising housing costs is limited, as these increases are driven by a lack of affordable supply and increasing development costs. In fact, tight monetary policy hurts housing supply because it increases the cost of AD&C financing. This can be seen on the graph below, as shelter costs continue to rise at an elevated pace despite Fed policy tightening. Additional housing supply is the primary solution to tame housing inflation.

Furthermore, the election result has put inflation back in the spotlight and added additional   risks to the economic outlook. Proposed tax cuts and tariffs could increase inflationary pressures, suggesting a more gradual easing cycle with a slightly higher terminal federal funds rate. However, economic growth could also be higher with lower regulatory burdens. Given the housing market’s sensitivity to interest rates, a higher inflation path could extend the affordability crisis and constrain housing supply as builders continue to grapple with lingering supply chain challenges. During the past twelve months, on a non-seasonally adjusted basis, the Consumer Price Index rose by 2.9% in December, according to the Bureau of Labor Statistics’ report. This followed a 2.7% year-over-year increase in November. Excluding the volatile food and energy components, the “core” CPI increased by 3.2% over the past twelve months, after holding steady at 3.3% for three months. The component index of food rose by 2.5%, while the energy component index fell by 0.5%.

On a monthly basis, the CPI rose by 0.4% in December on a seasonally adjusted basis, after a 0.3% increase in November. The “core” CPI increased by 0.2% in December, after rising  0.3% for three consecutive months.

The price index for a broad set of energy sources rose by 2.6% in December, with increases across all categories including gasoline (+4.4%), fuel oil (+4.4%), natural gas (+2.4%) and electricity (+0.3%). Meanwhile, the food index rose 0.3%, after a 0.4% increase in November. Both indexes for food away from home and food at home increased by 0.3%.

The index for shelter (+0.3%) was the largest contributor to the monthly increase in all items index, accounting for nearly 37% of the total increase. Other top contributors that rose in December include indexes for airline fares (+3.9%), used cars and trucks, (+1.2%) and new vehicles (+0.5%). Meanwhile, the index for personal care (-0.2%) was among the few major indexes that decreased over the month. The index for shelter makes up more than 40% of the “core” CPI, rose by 0.3% in December, the same increase last month. Both indexes for owners’ equivalent rent (OER) and rent of primary residence (RPR) increased by 0.3% over the month. Despite the moderation, shelter costs remained the largest contributors to headline inflation.

NAHB constructs a “real” rent index to indicate whether inflation in rents is faster or slower than overall inflation. It provides insight into the supply and demand conditions for rental housing. When inflation in rents is rising faster than overall inflation, the real rent index rises and vice versa. The real rent index is calculated by dividing the price index for rent by the core CPI (to exclude the volatile food and energy components). In December, the Real Rent Index rose by 0.1%. Over the twelve months of 2024, the monthly growth rate of the Real Rent Index averaged 0.1%, slower than the average of 0.2% in 2023.

Discover more from Eye On Housing

Subscribe to get the latest posts sent to your email.


This article was originally published by a eyeonhousing.org . Read the Original article here. .

Nearly 1.3 million tax returns filed for tax year 2023 utilized the Residential Clean Energy Credit (25D tax credit), according to the latest IRS clean energy tax credit statistics. Through May 23rd of the 2024 tax filing season for 2023 returns, almost 138 million tax returns had been filed with the IRS, which indicates that 0.9% of returns filed utilized the 25D credit. Both 25C (Energy Efficient Home Improvement Credit) and 25D are claimed on Form 5695, as both are residential energy tax credits. A previous blog discussed the 25C credit, while this one focuses on the 25D credit. The two credits main difference is that 25C relates to improvements that make homes more energy efficient, while 25D is focused on investments associated with renewable energy in the home. The 25D credit is an annual credit that taxpayers may claim for investing in renewable energy for their residence, such as solar, wind, geothermal, fuel cells or battery storage technology.

The 25D tax credit allows home owners to claim qualifying residential clean energy expenditures made to their primary or secondary residence. Renters can also claim the credit for certain residential clean energy expenditures made to their residence while landlords cannot. Additionally, 25D can be applied to newly constructed homes as well as existing homes. The 25D credit amount is based on 30% of the clean energy expenditure and, unlike 25C, has no credit limit with one exception— the credit for fuel cell property expenditures is 30% up to $500 for each half kilowatt of capacity for the qualified fuel cell property. The 30% credit amount will fall to 26% in 2033 and 22% in 2034. Taxpayers can also include installation costs in the calculation of their credit amount.  While the credit is non-refundable, taxpayers can carryforward the credit to reduce their tax liability in future years. Clean energy property must meet certain standards to qualify for the credit. For example, geothermal heat pumps must meet Energy Star requirements at the time of purchase.

Cost of Energy Property and Usage

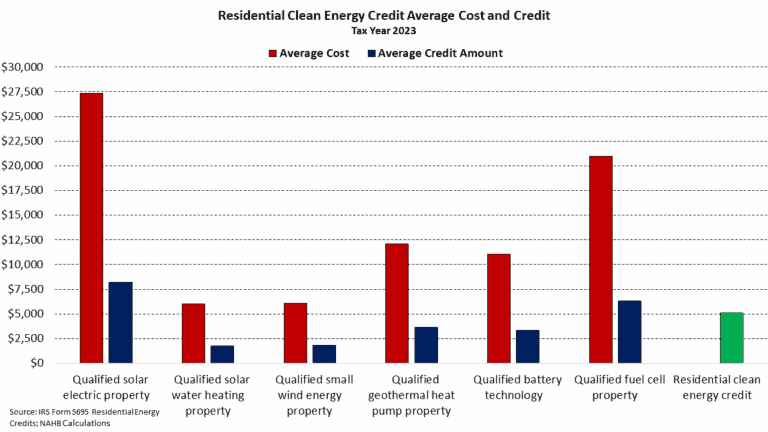
The recent IRS data indicates that the most expensive clean energy investment claimed in tax year 2023 was the purchase and installation of qualified solar electric property at an average cost of $27,355. Shown below are the average cost and average credit (30% of cost) across each investment, while the average credit amount across all returns that claimed 25D is shown in green at $5,084. While not shown below, the average credit claimed in 2023 that was carryforward from a previous year was $7,019 and the average credit carryforward to next year was $7,464. Both carryforward credits were higher than the average credit amount claimed in 2023.

Solar electric property was also by far the most frequently claimed investment at 752,300 returns. The next highest claimed investment was qualified solar water heating property, with 139,130 returns. No other improvement appeared on over 100,000 returns. The qualified improvement that was least claimed on tax returns was fuel cell property, with only 35,850 returns. Fuel cell property is the only expenditure subject to a cap.

Income and Geographic Differences

The Residential Clean Energy Credit is not subject to income limitations, meaning any taxpayer regardless of income can claim the credit on their tax return. The income level that most frequently claimed the credit was between $500,000 and $1,000,000 at 1.99%. Given the average cost of each improvement, it comes as little surprise that lower incomes claim the credit less frequently.

Geographically, the highest claim rate of the 25D tax credit was in Nevada, with 2.0% of returns claiming the credit. Florida had the second highest claim rate at 1.8%. The lowest claim rate was in North Dakota, at just 0.2%. Of note, higher usage rates of the 25D tax credit are found in states in the southwest, with Nevada (2.0%), Arizona (1.6%), Texas (1.6%), California (1.6%), and New Mexico (1.5%) all ranking in the top ten. This may be due to their significantly higher exposure to the sun, leading to higher potential benefits from installing solar electric property.

New Hampshire had the highest average credit amount at $7,581. This was $500 more than the second highest state which was Hawaii at $7,055. The lowest average credit amount was in Mississippi, at $2,248.

Discover more from Eye On Housing

Subscribe to get the latest posts sent to your email.


This article was originally published by a eyeonhousing.org . Read the Original article here. .

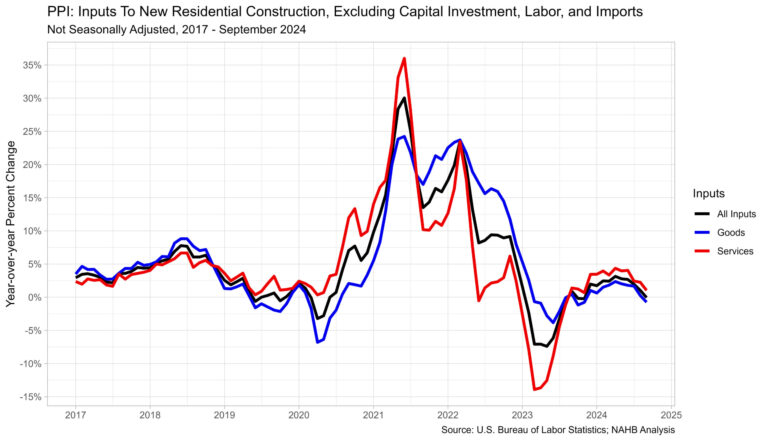
Prices for inputs to new residential construction—excluding capital investment, labor, and imports—decreased 0.6% in September according to the most recent Producer Price Index (PPI) report published by the U.S. Bureau of Labor Statistics. Compared to a year ago, this index was down 0.1% in September after an increase of 1.0% in August.

The inputs to new residential construction price index can be broken into two components­—one for goods and another for services. The goods component decreased 0.7% over the year, while services increased 1.0%. For comparison, the total final demand index increased 1.8% over the year in September, with final demand goods down 1.1% and final demand services up 3.1% over the year.

Input Goods

The goods component has a larger importance to the total residential construction inputs price index, around 60%. The price of input goods to residential construction was down 0.7% in September from August. The input goods to residential construction index can be further broken down into two separate components, one measuring energy inputs with the other measuring goods less energy inputs. The latter of these two components simply represents building materials used in residential construction, which makes up around 93% of the goods index.

Prices for inputs to residential construction, goods less energy, were up 1.5% in September compared to a year ago. This year-over-year growth has continued to slow since April when it was at 2.5% and remains well below growth in September of 2022 when it was at 14.3%. The year-over-year growth in September 2023 was 1.0%, making this year’s growth slightly higher. The index for inputs to residential construction for energy fell 23.5% in September, the largest yearly decrease since 26.1% in July 2023.

The graph below focuses on the data since the start of 2023 for residential goods inputs. Energy prices have retreated over the past year, with only two periods of growth in 2024.

Input Services

Prices of inputs to residential construction, services, fell 0.5% in September from August. The price index for service inputs to residential construction can be broken out into three separate components: the trade services component, the transportation and warehousing services component, and the services less trade, transportation and warehousing component. The most vital component is trade services (around 60%), followed by services less trade, transportation and warehousing (around 29%), and finally transportation and warehousing services (around 11%). The largest component, trade services, compared to last year was up 0.4% in September after increasing 2.1% in August.

Discover more from Eye On Housing

Subscribe to get the latest posts sent to your email.


This article was originally published by a eyeonhousing.org . Read the Original article here. .

Approximately 2.3 million tax returns filed for tax year 2023 utilized the Energy Efficient Home Improvement credit (25C tax credit), according to the latest IRS clean energy tax credit statistics. Through May 23rd of the 2024 tax filing season for 2023 returns, almost 138 million tax returns had been filed with the IRS, which indicates that 1.7% of returns filed utilized the 25C credit. There are various types of improvements that can be claimed under the 25C credit; each improvement varies in its cost and credit amount. Additionally, claim rates of the 25C tax credit varies across taxpayers’ incomes as well as geographies. This post examines these data.

The 25C tax credit allows homeowners to claim qualifying energy efficiency improvements to their primary or secondary residence. Renters can also claim the credit for certain energy efficient appliance and product expenditures. The 25C credit amount is based on 30% of the improvement’s cost and is subject to the improvement’s specific credit limit. For improvements such as electric or natural gas heat pumps, heat pump water heaters, or biomass stoves/boilers, the credit limit per year is $2,000. All other home improvements, such as efficient AC units, insulation/air sealing or home energy audits are limited to a combined credit limit of $1,200, with individual limitations for each item. The total annual credit amount that can be claimed is $3,200 per year. The table below from the Department of Energy shows the available tax credit amounts for tax years 2023 through 2032.

Cost of Improvement and Usage

The credit can cover both the purchase and installation costs for heat pumps, energy efficient AC units, furnaces/ boilers, water heaters, biomass stoves/ boilers, and electric panel/circuit board upgrades. For building envelope components (insulation, doors, windows, skylights), only the purchase can be covered.

The recent IRS data indicates that the most expensive improvement claimed in tax year 2023 was the purchase and installation of electric or natural gas heat pumps at an average cost of $11,213. The costliest item that did not cover installation costs was exterior windows and skylights at $9,143.

Shown below in orange are the average costs for each 25C improvement item in the IRS data. In blue is the credit amount of each improvement, based on its average cost and applicable credit limits. For almost all items, 30% of the improvement’s cost far surpass the credit limit amounts. The only exceptions are heat pump water heaters and biomass stoves/broilers that on average do not exceed the credit limit.

For example, the average cost of installation and purchase of a biomass stove/broiler was $5,221. Taking 30% of this cost, we find a credit amount of $1,566, which is below the credit limit of $2,000 for this improvement. Compared with the costliest improvement, electric or natural gas heat pumps, 30% of the average cost is $3,364. This is above the credit limit, making the largest possible credit amount $2,000 for electric or natural gas heat pumps installation and purchase. The average credit amount, shown below in purple, was $882, well below the maximum possible credit limit of $3,200, shown in light purple.

Of the 2.3 million taxpayers that claimed the 25C credit, the most frequent improvement was the purchase of insulation or air sealing materials or system with 699,440 returns (29.9%). This improvement is the only item to the combined cap of $1,200 that also has an individual limit of $1,200. Improvements that have a combined limit of $1,200 are in the green shaded box below. The least claimed improvement was home energy audits, which also had the lowest credit limit of $150.

Income and Geographic Differences

The highest claim rate of the 25C credit by income was for taxpayers in the $200,000-$500,000 income range, with 4.83% of returns claiming a 25C tax credit. The lowest was for incomes between $1-$10,000, as 0.02% of returns claimed the credit.

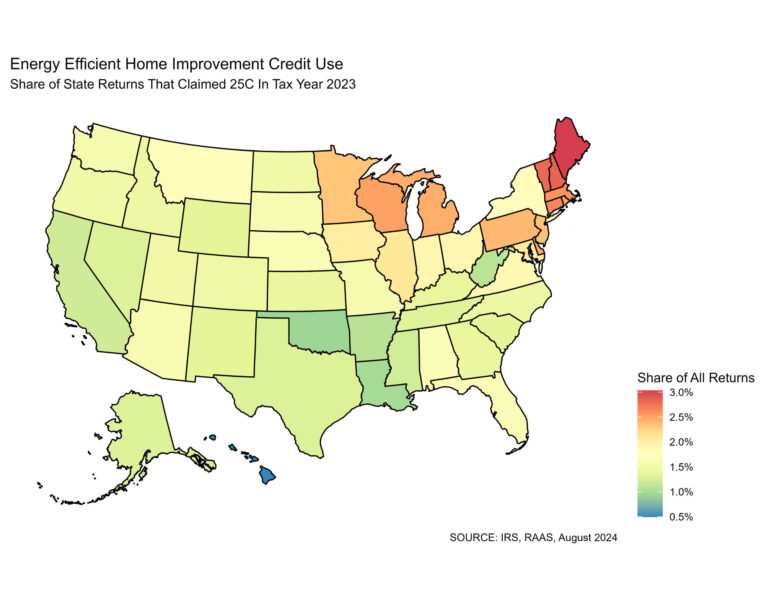
Geographically, the highest claim rate of the 25C tax credit was in Maine, with 3.03% of tax returns in the state claiming 25C. The lowest rate was in Hawaii, where only 0.50% of returns claimed the credit. Usage was significantly higher in the Midwest and Northeast, as the top 10 usage rates were all located in these regions.

While Maine has the highest claim rate, Washington had the highest average credit amount at $1,191. The lowest average credit amount was in Iowa, at $743. Of particular note, Michigan and Wisconsin had low average credit amounts but were among the top ten in terms of claim rates. In Michigan, the average credit amount was $747, ranking 49th (includes DC), while the claim rate was 9th at 2.45%. In Wisconsin, the average credit amount was $761, ranking 48th, and the claim rate was 6th, at 2.51%. The reasoning for this trend could be due to the type of improvements by region but there is no IRS data published yet to clarify this hypothesis.

Additionally, usage rates could be relatively lower in the Southern portion of the U.S. because the costliest items, such as heat pumps, are not as critical as regional weather is warmer. Since this credit cannot be applied to new construction, it should also be noted that most new homes are being built with central AC, making it less likely to be claimed as a 25C improvement. Also, most homes in the North are built without heat pumps which allows for more opportunity for the cost to be claimed under 25C if such improvement is made. Nationally, the claim rate was 1.7% with an average credit amount of $882.

Discover more from Eye On Housing

Subscribe to get the latest posts sent to your email.


This article was originally published by a eyeonhousing.org . Read the Original article here. .

NAHB published research earlier this year on home buyer preferences called What Home Buyers Really Want. Consumers were asked to rate how 19 technology features would influence their home purchase decision, if at all, using the following four-point scale:

Do not want – not likely to buy a home with this design or feature.

Indifferent – wouldn’t influence decision.

Desirable – would be seriously influenced to purchase a home because this design or feature was included.

Essential/Must have – unlikely to purchase a home without this design or feature

Seventy-eight percent of home buyers rated a programmable thermostat as either essential/must have or desirable, followed by security cameras (76%), video doorbell (74%), and wireless home security system (70%).  Sixteen of the 19 technology features had at least 50% of home buyers rating them as essential or desirable.

The top eight features reveal that home buyers are looking for technology that helps them achieve two main goals:

Improve Energy Efficiency (programmable thermostat, multi-zone HVAC system, lighting control system, energy management system/display) AND

Increase Safety (security cameras, video doorbell, wireless & wired home security system)

Additionally, like the other areas of the home covered in the study, every question on technology features is tabulated by the buyer’s income, age, geography, race, household type, and the price they expect to pay for the home. These details can be very useful in particular cases. For example, the study discusses the five technology features that have the largest preference margins between the youngest and oldest buyers along with analyzing the prevalence of virtual tours by income and price point. 

Discover more from Eye On Housing

Subscribe to get the latest posts sent to your email.


This article was originally published by a eyeonhousing.org . Read the Original article here. .

Pin It