Tag

employment/labor

Browsing


The residential construction industry plays a crucial role in driving economic growth and local community development. It has a lasting impact on local communities by creating jobs, improving infrastructure, boosting local businesses, and enhancing property values.

The residential construction industry is more reliant on labor than capital in the United States. As of October 2024, about 3.4 million people work in the residential construction industry in the United States, with 957,000 builders and 2.4 million residential specialty trade contractors.

The NAHB analysis of the Quarterly Census of Employment and Wages (QCEW) data provides an insight into employment and establishment concentration of the residential construction industry across metro areas (MSA).

Location quotients (LQ) are ratios that compare the concentration of the residential construction industry within a metro area to the concentration of the industry nationwide. LQs are used in this article to evaluate the employment and establishment concentration of the residential construction industry in local areas.  

Employment

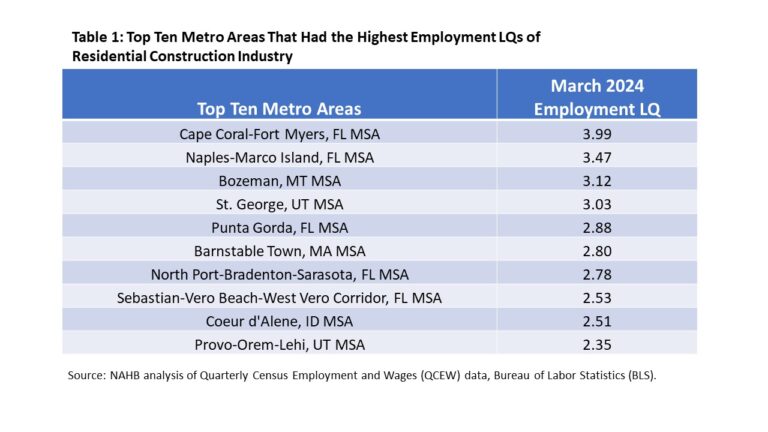
The March 2024 QCEW data indicates that employment in the residential construction industry, while found throughout the country, was more highly concentrated in some metro areas than others.

Among 387 metro areas, employment LQs ranged from 0.02 to 3.99. Cape Coral-Fort Myers, FL had the highest employment concentration of the residential construction industry with an LQ of 3.99. It was followed by Naples-Marco Island, FL (LQ: 3.47) and Bozeman, MT (LQ: 3.12).

Florida, experiencing a rapid growth in population, reported a relatively high employment concentration in residential construction. All metro areas in Florida had a higher employment concentration than the nation’s concentration. Moreover, half of the top ten metro areas with the highest employment concentrations of the residential construction industry were in Florida.

Various metro areas in the Mountain Division also have a high reliance on the residential construction industry for employment. Bozeman, MT (LQ: 3.12), St. George, UT (LQ: 3.03), Coeur d’Alene, ID (LQ: 2.51), and Provo-Orem-Lehi, UT (LQ: 2.35) were ranked in the top ten markets with a higher employment concentration of the residential construction industry.

Metro areas in the South reported the three lowest employment LQs of the residential construction industry. The lowest was Owensboro, KY with a LQ of 0.02, followed by Dalton, GA (LQ: 0.03) and Eagle Pass, TX (LQ: 0.05).

Establishment

On aggregate, New York-Newark-Jersey City, NY-NJ, Los Angeles-Long Beach-Anaheim, CA, and Miami-Fort Lauderdale-West Palm Beach, FL were the three metro areas that not only had the most employment in residential construction but also had the largest number of residential construction establishments among all metro areas. However, these three metro areas didn’t have higher establishment concentrations of the residential construction industry than the nation.

Among all the 387 metro areas, 104 of them had a higher establishment concentration of the residential construction industry than the nation. St. George, UT had the highest establishment concentration of the residential construction industry, which was more than three times that of the nation, followed by Barnstable Town, MA (LS: 2.42) and Cape Coral-Fort Myers, FL (LQ: 2.38).

The three metro areas in the South that reported the lowest employment LQs of the residential construction industry also had the lowest establishment LQs of the residential construction industry.

For more information on QCEW, please check the “Handbook of Methods” published by BLS.

Discover more from Eye On Housing

Subscribe to get the latest posts sent to your email.


This article was originally published by a eyeonhousing.org . Read the Original article here. .

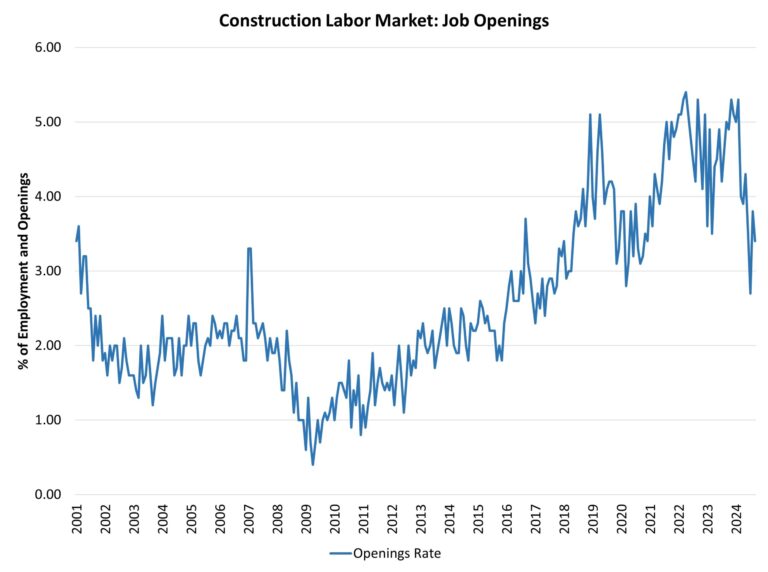
After a period of slowing associated with declines for some elements of the residential construction industry, the count of open construction sector jobs trended lower in the October data, per the Bureau of Labor Statistics’ Job Openings and Labor Turnover Survey (JOLTS). The data indicates the demand for construction labor market remains weaker than a year ago.

In contrast, after revisions, the number of open jobs for the overall economy increased from 7.37 million to 7.74 million in October. Nonetheless, this is notably smaller than the 8.69 million estimate reported a year ago and is a sign of a softening aggregate labor market. Previous NAHB analysis indicated that this number had to fall below 8 million on a sustained basis for the Federal Reserve to feel more comfortable about labor market conditions and their potential impacts on inflation. With estimates remaining below 8 million for national job openings, the Fed is underway easing credit conditions.

The number of open construction sector jobs fell from a revised 258,000 in September to a softer 249,000 in October. Elements of the construction sector slowed in prior months as tight Fed policy persisted. The October reading of opening, unfilled construction jobs is lower than that registered a year ago: 413,000.

The construction job openings rate fell back to 2.9% in October and continues to trend lower, albeit with a fair amount of statistical month-to-month noise in the recent data.

The layoff rate in construction moved lower to 1.2% in October after a 2% rate in September. This was the lowest layoff rate for construction in the data series (going back to late 2000). The quits rate in construction increased to 1.9% in October.

Discover more from Eye On Housing

Subscribe to get the latest posts sent to your email.


This article was originally published by a eyeonhousing.org . Read the Original article here. .


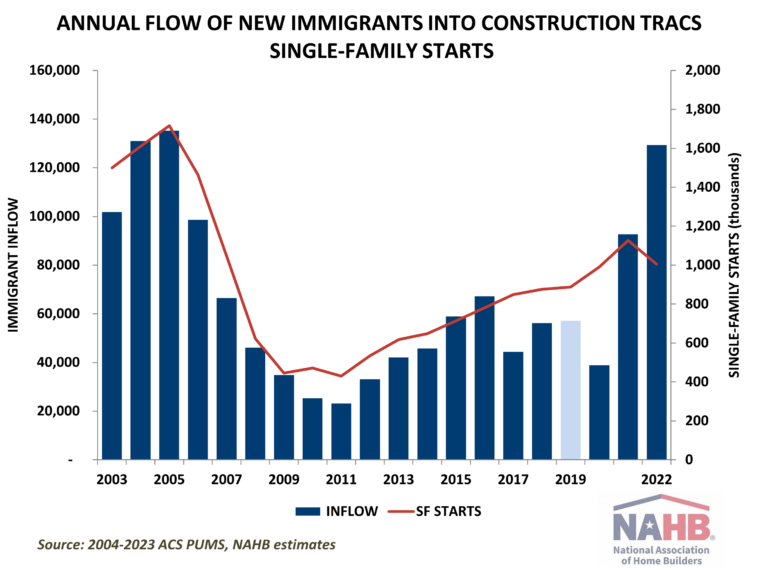
Reflecting the sharp increase in net immigration of recent years, the number of new immigrants joining the construction industry rose substantially in 2022. According to the latest American Community Survey (ACS), the industry managed to attract close to 130,000 new workers coming from outside the U.S. to help with persistent labor shortages. For comparison, this inflow surpasses the combined number of new immigrants who joined the industry in the two years prior to the pandemic. Only during the housing boom of 2005-2006, was the industry absorbing a similar number of new foreign-born workers.

Native-born workers remain reluctant to join the industry, with their total count remaining below the record levels of the housing boom of the mid-2000s by over half a million. As a result, the share of immigrants in construction reached a new historic high of 25.5%. In construction trades, the share of immigrants remains even higher, with one in three craftsmen coming from outside the U.S. This is consistent with the earlier ACS data that regularly shows higher shares of immigrants in the construction trades.

In 2023, 11.9 million workers, including both self-employed and temporarily unemployed, comprised the construction workforce. Out of these, 8.9 million were native-born, and 3 million were foreign-born, the highest number of immigrant workers in construction ever recorded by the ACS.

The construction labor force, including both native- and foreign-born workers, exceeds the pre-pandemic levels but remains smaller than during the housing boom of the mid-2000s.  As the chart above illustrates, it is the native-born workers that remain missing. Compared to the peak employment levels of 2006, construction is short 550,000 native-born workers and new immigrants only partially close the gap. Due to the data collection issues during the early pandemic lockdown stages, we do not have reliable estimates for 2020 and omit these in the chart above.

Typically, the annual flow of new immigrant workers into construction is highly responsive to the changing labor demand. The number of newly arrived immigrants in construction rises rapidly when housing starts are rising and declines precipitously when the housing industry is contracting. The response of immigration is normally quite rapid, occurring in the same year as a change in construction activity. Statistically, the link is captured by high correlation between the annual flow of new immigrants into construction and measures of new home construction, especially new single-family starts. 

The latest data show that the substantial uptick in the number of new immigrants in 2022 does not reflect the changing volume of home building as new single-family starts declined during that time period.

Previously, the link between immigrant inflow and home building activity also disconnected in 2017 when NAHB’s estimates showed a surprising drop in the number of new immigrants in construction despite steady gains in housing starts. The connection was further severed by pandemic-triggered lockdowns and restrictions on travel and border crossings, drastically interrupting the flow of new immigrant workers. In 2021, however, the flow of immigrants into construction returned to typical levels driven by home building activity.

The overall rising trend and the noticeable uptick after the pandemic in the share of immigrants are consistent with but more pronounced in construction compared to broader U.S. economy. Excluding construction, where the reliance on foreign-born workers is greater, the share of immigrants in the U.S. labor force increased from just over 14% in 2004 to over 17% in 2023, the highest share recorded by the ACS.

Discover more from Eye On Housing

Subscribe to get the latest posts sent to your email.


This article was originally published by a eyeonhousing.org . Read the Original article here. .

Clouded by hurricanes in the southeast part of the country and strike activity in the manufacturing sector, October nonfarm payroll figures were mediocre. Nonfarm payroll employment increased in 21 states in October compared to the previous month, while it decreased in 29 states and the District of Columbia. According to the Bureau of Labor Statistics, nationwide total nonfarm payroll employment increased by a meager 12,000 in October, following a gain of 223,000 jobs in September.

On a month-over-month basis, employment data was most favorable in Colorado, which added 9,000 jobs. Louisiana came in second (+7,700), followed by Ohio (+6,400). A total of 144,500 jobs were lost across 29 states and the District of Columbia, with Florida reporting the steepest job losses at 38,000. Washington lost 35,900 jobs while New York lost a total of 10,900 jobs. In percentage terms, employment increased the highest in South Dakota at 0.4%, while Washington saw the biggest decline at 1.0% between September and October.

Year-over-year ending in October, 2.2 million jobs have been added to the labor market across all 50 states and the District of Columbia. This is a 1.4% increase compared to October 2023 level. The range of job gains spanned from 2,800 jobs in Wyoming to 274,600 jobs in Texas. In percentage terms, the range of job growth spanned 3.1% in Idaho to 0.4% in Washington.

Across the nation, construction sector jobs data —which includes both residential and non-residential construction—showed that 33 states and the District of Columbia reported an increase in October compared to September, while 13 states lost construction sector jobs. The four remaining states reported no change on a month-over-month basis. Louisiana, with the highest increase, added 3,400 construction jobs, while Florida, on the other end of the spectrum, lost 5,400 jobs. Overall, the construction industry added a net 8,000 jobs in October compared to the previous month. In percentage terms, Louisiana reported the highest increase at 2.5% and Iowa reported the largest decline at 2.1%.

Year-over-year, construction sector jobs in the U.S. increased by 223,000, which is a 2.8% increase compared to the October 2023 level. Texas added 38,800 jobs, which was the largest gain of any state, while New York lost 9,200 construction sector jobs. In percentage terms, Alaska had the highest annual growth rate in the construction sector at 19.1%. Over this period, Oregon reported the largest decline of 4.3%.

Discover more from Eye On Housing

Subscribe to get the latest posts sent to your email.


This article was originally published by a eyeonhousing.org . Read the Original article here. .


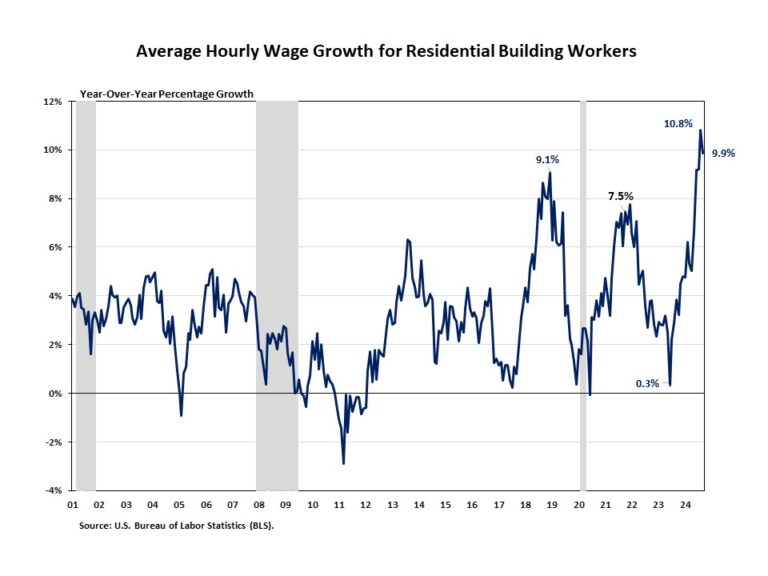
Wages for residential building workers grew at a fast pace of 9.9% in September, following a 10.8% gain in August. These year-over-year growth rates in the past four months were unprecedented in the history of the data series since 1990. After a 0.3% increase in June 2023, the YOY growth rate for residential building worker wages has been trending higher over the past year.

The ongoing skilled labor shortage in the construction labor market and lingering inflation impacts account for the recent acceleration in wage growth. However, the demand for construction labor remained weaker than a year ago. As mentioned in the latest JOLTS blog, the number of open construction sector jobs fell from a revised 328,000 in August to a softer 288,000 in September. Nonetheless, the ongoing skilled labor shortage continues to challenge the construction sector.

According to the Bureau of Labor Statistics report, average hourly earnings for residential building workers was $33.51 per hour in September 2024, increasing 9.9% from $30.5 per hour a year ago. This was 19.2% higher than the manufacturing’s average hourly earnings of $28.12 per hour, 14.7% higher than transportation and warehousing ($29.21 per hour), and 8.1% lower than mining and logging ($36.46 per hour).

Discover more from Eye On Housing

Subscribe to get the latest posts sent to your email.


This article was originally published by a eyeonhousing.org . Read the Original article here. .

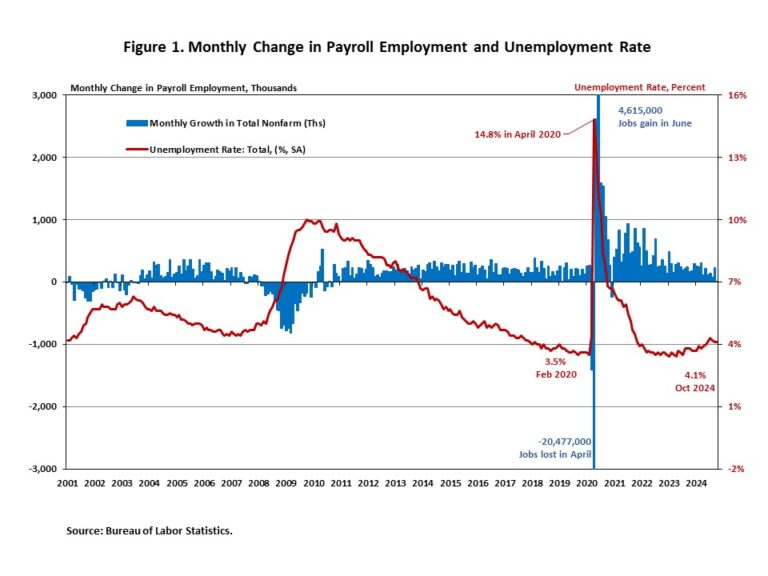
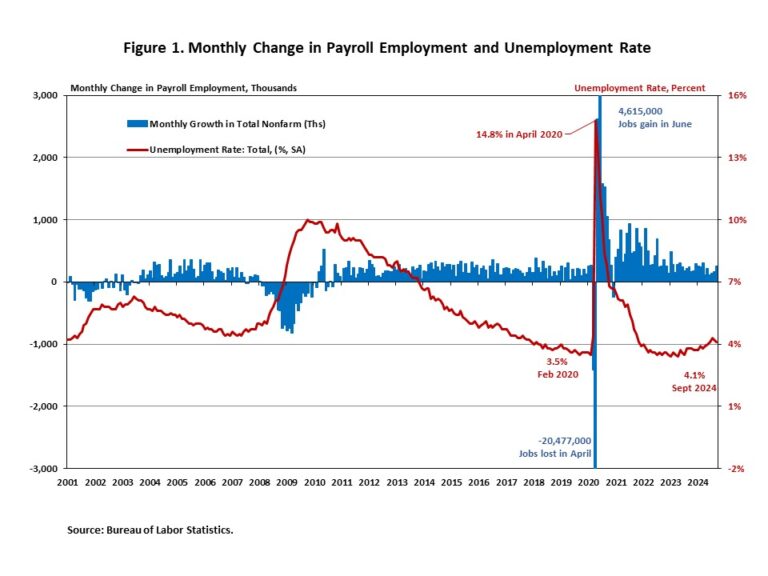
Job growth decelerated significantly in October, driven by the effects of strikes and hurricanes. As stated in this month’s job report, October data are “the first collected since Hurricanes Helene and Milton struck the United States”. Despite lower monthly job gains, the unemployment rate held steady at 4.1%, indicating the labor market remains solid.

In October, wage growth remained unchanged. Wages grew at a 4.0% year-over-year (YOY) growth rate, down 0.3 percentage points from a year ago. Wage growth is outpacing inflation, which typically occurs as productivity increases.

National Employment

According to the Employment Situation Summary reported by the Bureau of Labor Statistics (BLS), total nonfarm payroll employment rose by 12,000 in October, down sharply from a downwardly revised increase of 223,000 jobs in September, marking the smallest monthly job gain in years. The estimates for the previous two months were revised lower. The monthly change in total nonfarm payroll employment for August was revised down by 81,000, from +159,000 to +78,000, while the change for September was revised down by 31,000 from +254,000 to +223,000. Combined, the revisions were 112,000 lower than previously reported.

In the first ten months of 2024, 1,701,000 jobs were created. Additionally, monthly employment growth averaged 170,000 per month, compared to the 251,000 monthly average gain for 2023. The Fed’s easing cycle began on September 18, marking the end of a period of restrictive monetary policy. The U.S. economy has created about 8 million jobs since March 2022, when the Fed enacted the first interest rate hike of this cycle.

The unemployment rate was unchanged at 4.1% in October. While the number of employed persons decreased by 368,000, the number of unemployed persons rose by 150,000.

Meanwhile, the labor force participation rate—the proportion of the population either looking for a job or already holding a job—decreased by one percentage point to 62.6%. However, for people aged between 25 and 54, the participation rate declined for the third straight month to 83.5%. This rate still exceeds the pre-pandemic level of 83.1%. Meanwhile, the overall labor force participation rate remains below its pre-pandemic levels of 63.3% at the beginning of 2020.

In October, employment continued to trend up in health care (+52,000) and government (+40,000). Temporary help for business and professional services lost 49,000 jobs. Manufacturing employment fell by 46,000 in October. The BLS noted that a decline of 44,000 in transportation equipment manufacturing was “largely due to strike activity.”

Construction Employment

Employment in the overall construction sector increased by 8,000 in October, after 27,000 gains in September. While residential construction shed 5,300 jobs, non-residential construction employment added 13,500 jobs for the month.

Residential construction employment now stands at 3.4 million in October, broken down as 957,000 builders and 2.4 million residential specialty trade contractors. The 6-month moving average of job gains for residential construction was 3,000 a month. Over the last 12 months, home builders and remodelers added 44,500 jobs on a net basis. Since the low point following the Great Recession, residential construction has gained 1,388,200 positions.

In October, the unemployment rate for construction workers rose to 5.3% on a seasonally adjusted basis. The unemployment rate for construction workers has remained at a relatively lower level, after reaching 15.3% in April 2020 due to the housing demand impact of the COVID-19 pandemic.

Discover more from Eye On Housing

Subscribe to get the latest posts sent to your email.


This article was originally published by a eyeonhousing.org . Read the Original article here. .

After a period of slowing associated with declines for some elements of residential construction, the count of open construction sector jobs trended lower in the September data, per the Bureau of Labor Statistics’ Job Openings and Labor Turnover Survey (JOLTS). The data indicates the demand for construction labor market remains weaker than a year ago.

In September, after revisions, the number of open jobs for the overall economy declined from 7.86 million to 7.44 million. This is notably smaller than the 9.31 million estimate reported a year ago and a clear sign of a softening aggregate labor market. Previous NAHB analysis indicated that this number had to fall below 8 million on a sustained basis for the Federal Reserve to feel more comfortable about labor market conditions and their potential impacts on inflation. With estimates now remaining near 8 million for national job openings, the Fed has begun a credit easing cycle should continue lowering rates.

The number of open construction sector jobs fell from a revised 328,000 in August to a softer 288,000 in September. Elements of the construction sector slowed in prior months as tight Fed policy persisted. The September reading of opening, unfilled construction jobs is lower than that registered a year ago: 422,000.

The construction job openings rate fell back to 3.4% in September and continues to trend lower.

The layoff rate in construction edged higher to 2.1% in September after a 2% rate in August. The quits rate in construction decreased to just 1.4% in September as job churn slowed.

Discover more from Eye On Housing

Subscribe to get the latest posts sent to your email.


This article was originally published by a eyeonhousing.org . Read the Original article here. .

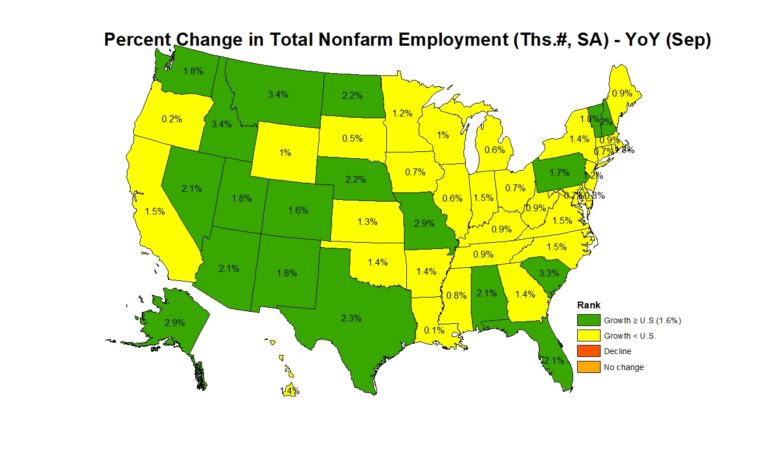
Nonfarm payroll employment increased in 41 states and the District of Columbia in September compared to the previous month, while eight states saw a decrease. Nevada reported no change. According to the Bureau of Labor Statistics, nationwide total nonfarm payroll employment increased by 254,000 in September, following a gain of 159,000 jobs in August.

On a month-over-month basis, employment data was most favorable in Texas, which added 29,200 jobs. New Jersey came in second (+19,200), followed by Florida (+17,000). A total of 17,400 jobs were lost across eight states, with Iowa reporting the steepest job losses at 4,800. In percentage terms, employment increased the highest in Idaho at 0.7%, while Iowa saw the biggest decline at 0.3% between August and September.

Year-over-year ending in September, 2.4 million jobs have been added to the labor market across all 50 states and the District of Columbia. The range of job gains spanned from 2,000 jobs in Louisiana to 327,400 jobs in Texas. In percentage terms, the range of job growth spanned 3.4% in Idaho to 0.1% in Louisiana.

Across the nation, construction sector jobs data   —which includes both residential and non-residential construction—showed that 24 states and the District of Columbia reported an increase in September compared to August, while 23 states lost construction sector jobs. The three remaining states reported no change on a month-over-month basis. Texas, with the highest increase, added 8,100 construction jobs, while Tennessee, on the other end of the spectrum, lost 1,600 jobs. Overall, the construction industry added a net 25,000 jobs in September compared to the previous month. In percentage terms, Ohio reported the highest increase at 2.7% and North Dakota reported the largest decline at 2.1%.

Year-over-year, construction sector jobs in the U.S. increased by 238,000, which is a 3.0% increase compared to the September 2023 level. Texas added 42,300 jobs, which was the largest gain of any state, while New York lost 6,900 construction sector jobs. In percentage terms, Alaska had the highest annual growth rate in the construction sector at 21.1%. Over this period, Oregon reported the largest decline of 4.1%.

Discover more from Eye On Housing

Subscribe to get the latest posts sent to your email.


This article was originally published by a eyeonhousing.org . Read the Original article here. .

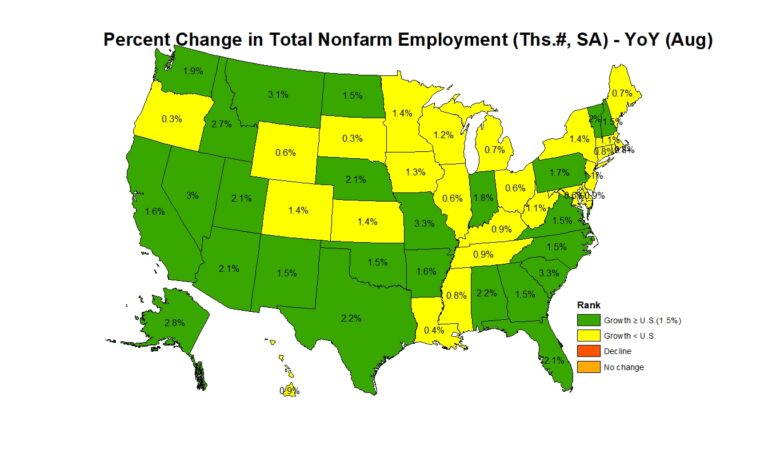
Nonfarm payroll employment increased in 32 states in August compared to the previous month, while 17 states and the District of Columbia saw a decrease. Kansas reported no change. According to the Bureau of Labor Statistics, nationwide total nonfarm payroll employment increased by 142,000 in August, following a gain of 89,000 jobs in July.

On a month-over-month basis, employment data was most favorable in Texas, which added 78,000 jobs. Texas accounted for more than half the jobs created nationwide in August. Indiana came in second (+19,800), followed by Minnesota (+14,400). A total of 42,400 jobs were lost across the 17 states and the District of Columbia, with New York reporting the steepest job losses at 7,400. In percentage terms, employment increased the highest in Texas and Indiana at 0.6%, while South Dakota saw the biggest decline at 0.7% between July and August.

Year-over-year ending in August, 2.4 million jobs have been added to the labor market across all 50 states and the District of Columbia. The range of job gains spanned from 1,500 jobs in South Dakota to 302,400 jobs in Texas. In percentage terms, the range of job growth spanned 3.3% in Missouri to 0.3% in South Dakota.

Across the nation, construction sector jobs data1 —which includes both residential and non-residential construction—showed that 27 states and the District of Columbia reported an increase in August compared to July, while 20 states lost construction sector jobs. The three remaining states reported no change on a month-over-month basis. Texas, with the highest increase, added 8,300 construction jobs, while California, on the other end of the spectrum, lost 3,300 jobs. Overall, the construction industry added a net 34,000 jobs in August compared to the previous month. In percentage terms, Wyoming reported the highest increase at 2.3% and Tennessee reported the largest decline at 1.6%.

Year-over-year, construction sector jobs in the U.S. increased by 228,000, which is a 2.8% increase compared to the August 2023 level. Texas added 36,600 jobs, which was the largest gain of any state, while Maryland lost 4,800 construction sector jobs. In percentage terms, Alaska had the highest annual growth rate in the construction sector at 17.8%. Over this period, Maine reported the largest decline of 4.7%.

Discover more from Eye On Housing

Subscribe to get the latest posts sent to your email.


This article was originally published by a eyeonhousing.org . Read the Original article here. .

The September jobs report indicates that the U.S. labor market remains strong. Job growth accelerated, and the unemployment rate fell to a three-month low of 4.1%.  Meanwhile, job growth for the previous two months (July and August) was upwardly revised.

In September, wage growth accelerated for the second straight month. Wages grew at a 4.0% year-over-year (YOY) growth rate in September, down 0.5 percentage points from a year ago. Wage growth is outpacing inflation, which typically occurs as productivity increases.

National Employment

Total nonfarm payroll employment increased by 254,000 in September, following an upwardly revised increase of 159,000 jobs in August, as reported in the Employment Situation Summary. It marks the largest monthly job gain in the past six months. The estimates for the previous two months were revised higher. The monthly change in total nonfarm payroll employment for July was revised up by 55,000, from +89,000 to +144,000, while the change for August was revised up by 17,000 from +142,000 to +159,000. Combined, the revisions were 72,000 higher than previously reported.

In the first nine months of 2024, 1,801,000 jobs were created. Additionally, monthly employment growth averaged 200,000 per month, compared with the 251,000 monthly average gain for 2023. The Fed’s easing cycle began on September 18, marking the end of a period of restrictive monetary policy. The U.S. economy has created roughly 8 million jobs since March 2022, when the Fed enacted the first interest rate hike of this cycle.

The unemployment rate fell slightly to 4.1% in September, from 4.2% in August. The September decrease in the unemployment rate reflected the decrease in the number of persons unemployed (-281,000) and the increase in the number of persons employed (+430,000).

Meanwhile, the labor force participation rate—the proportion of the population either looking for a job or already holding a job—was 62.7% for the third consecutive month. However, for people aged between 25 and 54, the participation rate dipped slightly to 83.8%. This rate exceeds the pre-pandemic level of 83.1%. Meanwhile, the overall labor force participation rate is still below its pre-pandemic levels when it stood at 63.3% at the beginning of 2020.

In September, employment continued to trend up in food services and drinking places (+69,000), health care (+45,000), government (+31,000), social assistance (+27,000), and construction (+25,000).

Construction Employment

Job gains in the overall construction sector continued in September, averaging 20,000 per month over the past 12 months. While residential construction gained 7,800 jobs, non-residential construction employment added 17,900 jobs for the month.

Residential construction employment now stands at 3.4 million in September, broken down as 952,000 builders and 2.4 million residential specialty trade contractors. The 6-month moving average of job gains for residential construction was 3,450 a month. Over the last 12 months, home builders and remodelers added 60,500 jobs on a net basis. Since the low point following the Great Recession, residential construction has gained 1,393,800 positions.

In September, the unemployment rate for construction workers rose to 4.9% on a seasonally adjusted basis. The unemployment rate for construction workers has remained at a relatively lower level, after reaching 15.3% in April 2020 due to the housing demand impact of the COVID-19 pandemic.

Discover more from Eye On Housing

Subscribe to get the latest posts sent to your email.


This article was originally published by a eyeonhousing.org . Read the Original article here. .
Pin It